New: orbital endpoints and thermal closure
Both starts and endings, component-temperature tests, and the spatial remainder · New: background-removal bias test · Updated16October2026.
Figure 1. The leading spatial motion follows velocity aberration
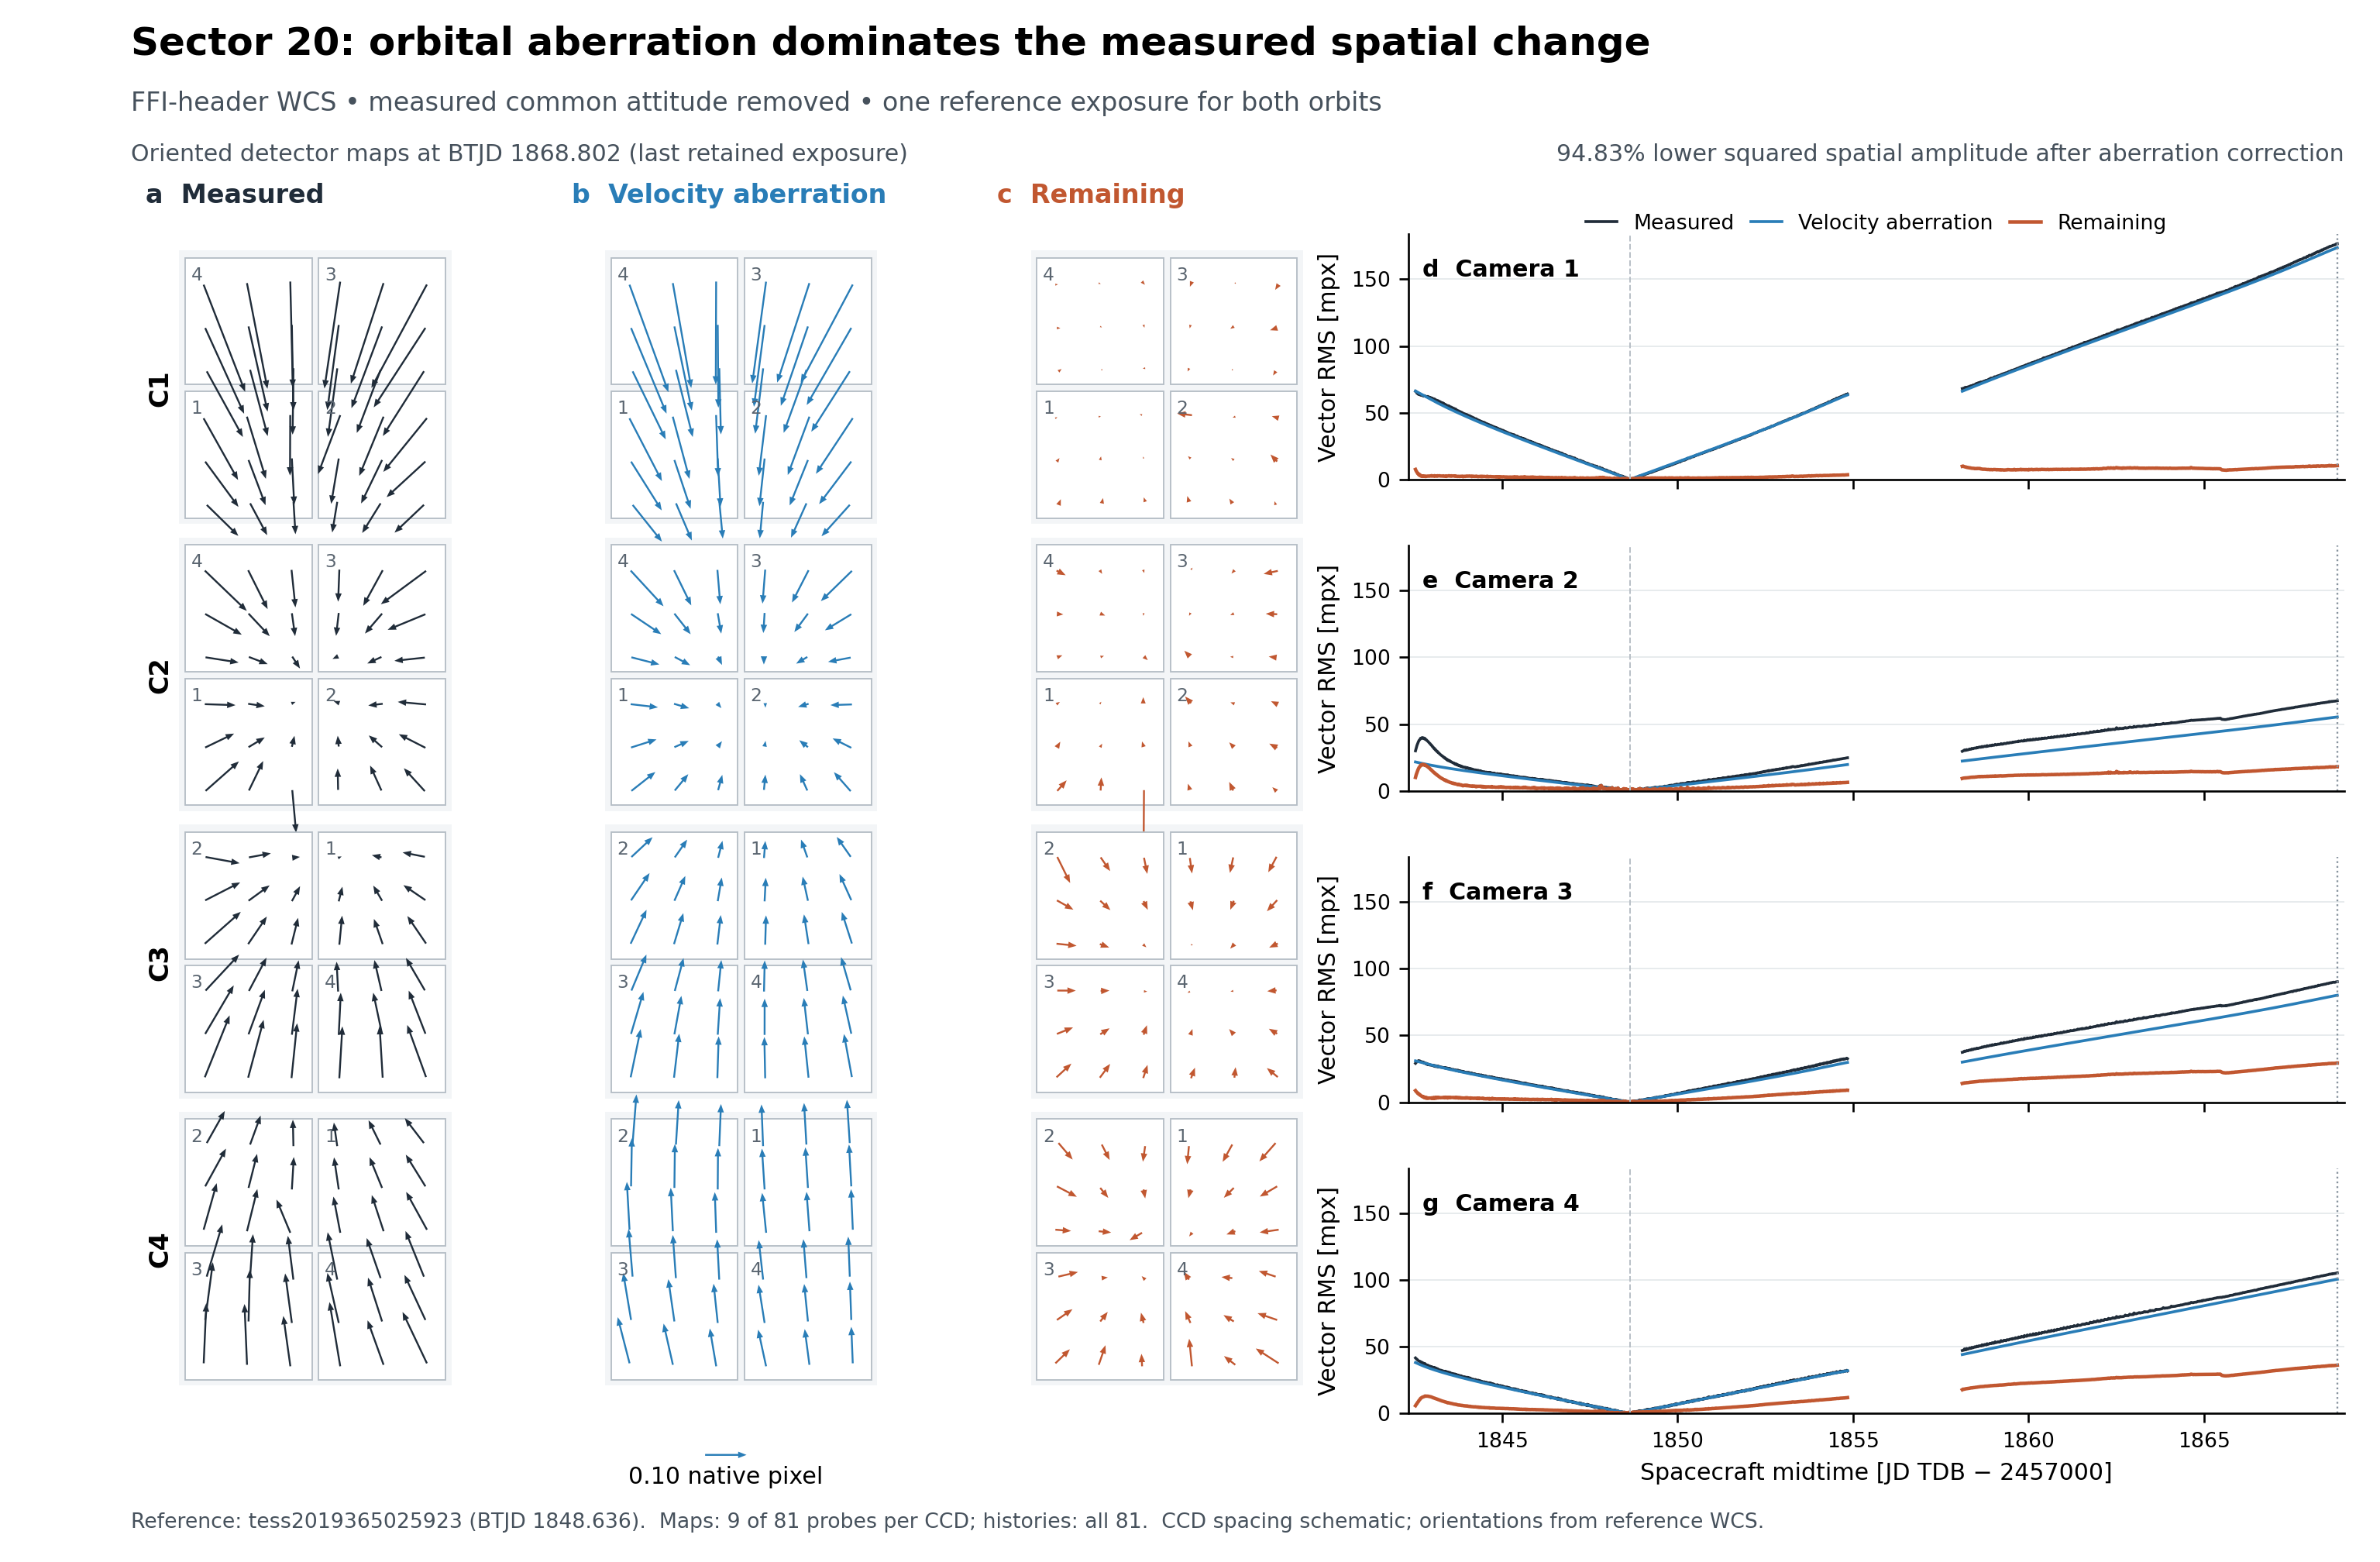
Figure 1 — Orbital aberration and remaining spatial WCS change
Proposed caption. Sector 20 sky-map changes after removing measured common attitude. Panels a–c show all 16 CCDs at the last retained exposure, tess2020020065923 (spacecraft BTJD 1868.802), relative to tess2019365025923 (BTJD 1848.636): measured catalogue-frame change, the physical full-velocity aberration correction, and the remaining apparent-frame change. The panels share one arrow scale in native detector pixels. CCD numbers identify each detector; placement is schematic, but detector positions and arrows are rotated consistently using each reference WCS. Nine of 81 inset probes per CCD are displayed. Panels d–g show the two-component vector RMS over all 324 retained probes per camera at each exposure, in millipixels (mpx). Dashed vertical lines mark the reference exposure; dotted lines mark the mapped exposure. The spacecraft-velocity correction includes both Earth's barycentric motion and TESS's Earth-relative motion; no aberration amplitude is fitted. Over 1,100 quality-selected exposures and1,296 probes, the all-camera vector RMS decreases from 60.067 to 13.652 mpx, a 94.834% reduction in summed squared amplitude after common-attitude removal. These are FFI-header WCS measurements with measured pointing retained as a conditioning quantity, not independent stellar accuracy or a complete pointing forecast. Remaining change includes temperature-associated distortion and other optical, attitude-convention and measurement effects. All-camera quality selection excludes camera 1-contaminated orbit 48startup; the gap is not interpolated.
Quantity and exact denominator
For each retained exposure–probe pair, define
Here is the measured catalogue-frame WCS displacement after the fitted common-rotation projection, in native pixels (model.npz/raw_residual); is the corresponding apparent-frame residual after applying full-velocity aberration and the same projection basis (model.npz/residual), also in native pixels. The vector is the exact physical-aberration correction to these measured directions, not a regression against a reference-direction template. The index enumerates the retained vectors, and (2,851,200 scalar components). The dimensionless compares squared amplitudes relative to the common reference; it is neither variance about a fitted temporal mean nor a held-out predictive score. No temperature-model term enters this figure.
The plotted vectors describe sky-map changes at fixed detector positions. Fixed-star detector displacement has the opposite first-order sign. Orthogonal orientation transforms preserve their native-pixel vector norms; a common layout does not imply a common angular plate scale. The apparent common attitude is fitted from the header maps, so deformation components degenerate with common rotation are absorbed into that convention.
Figure 2. Thermal prediction leaves structured startup errors
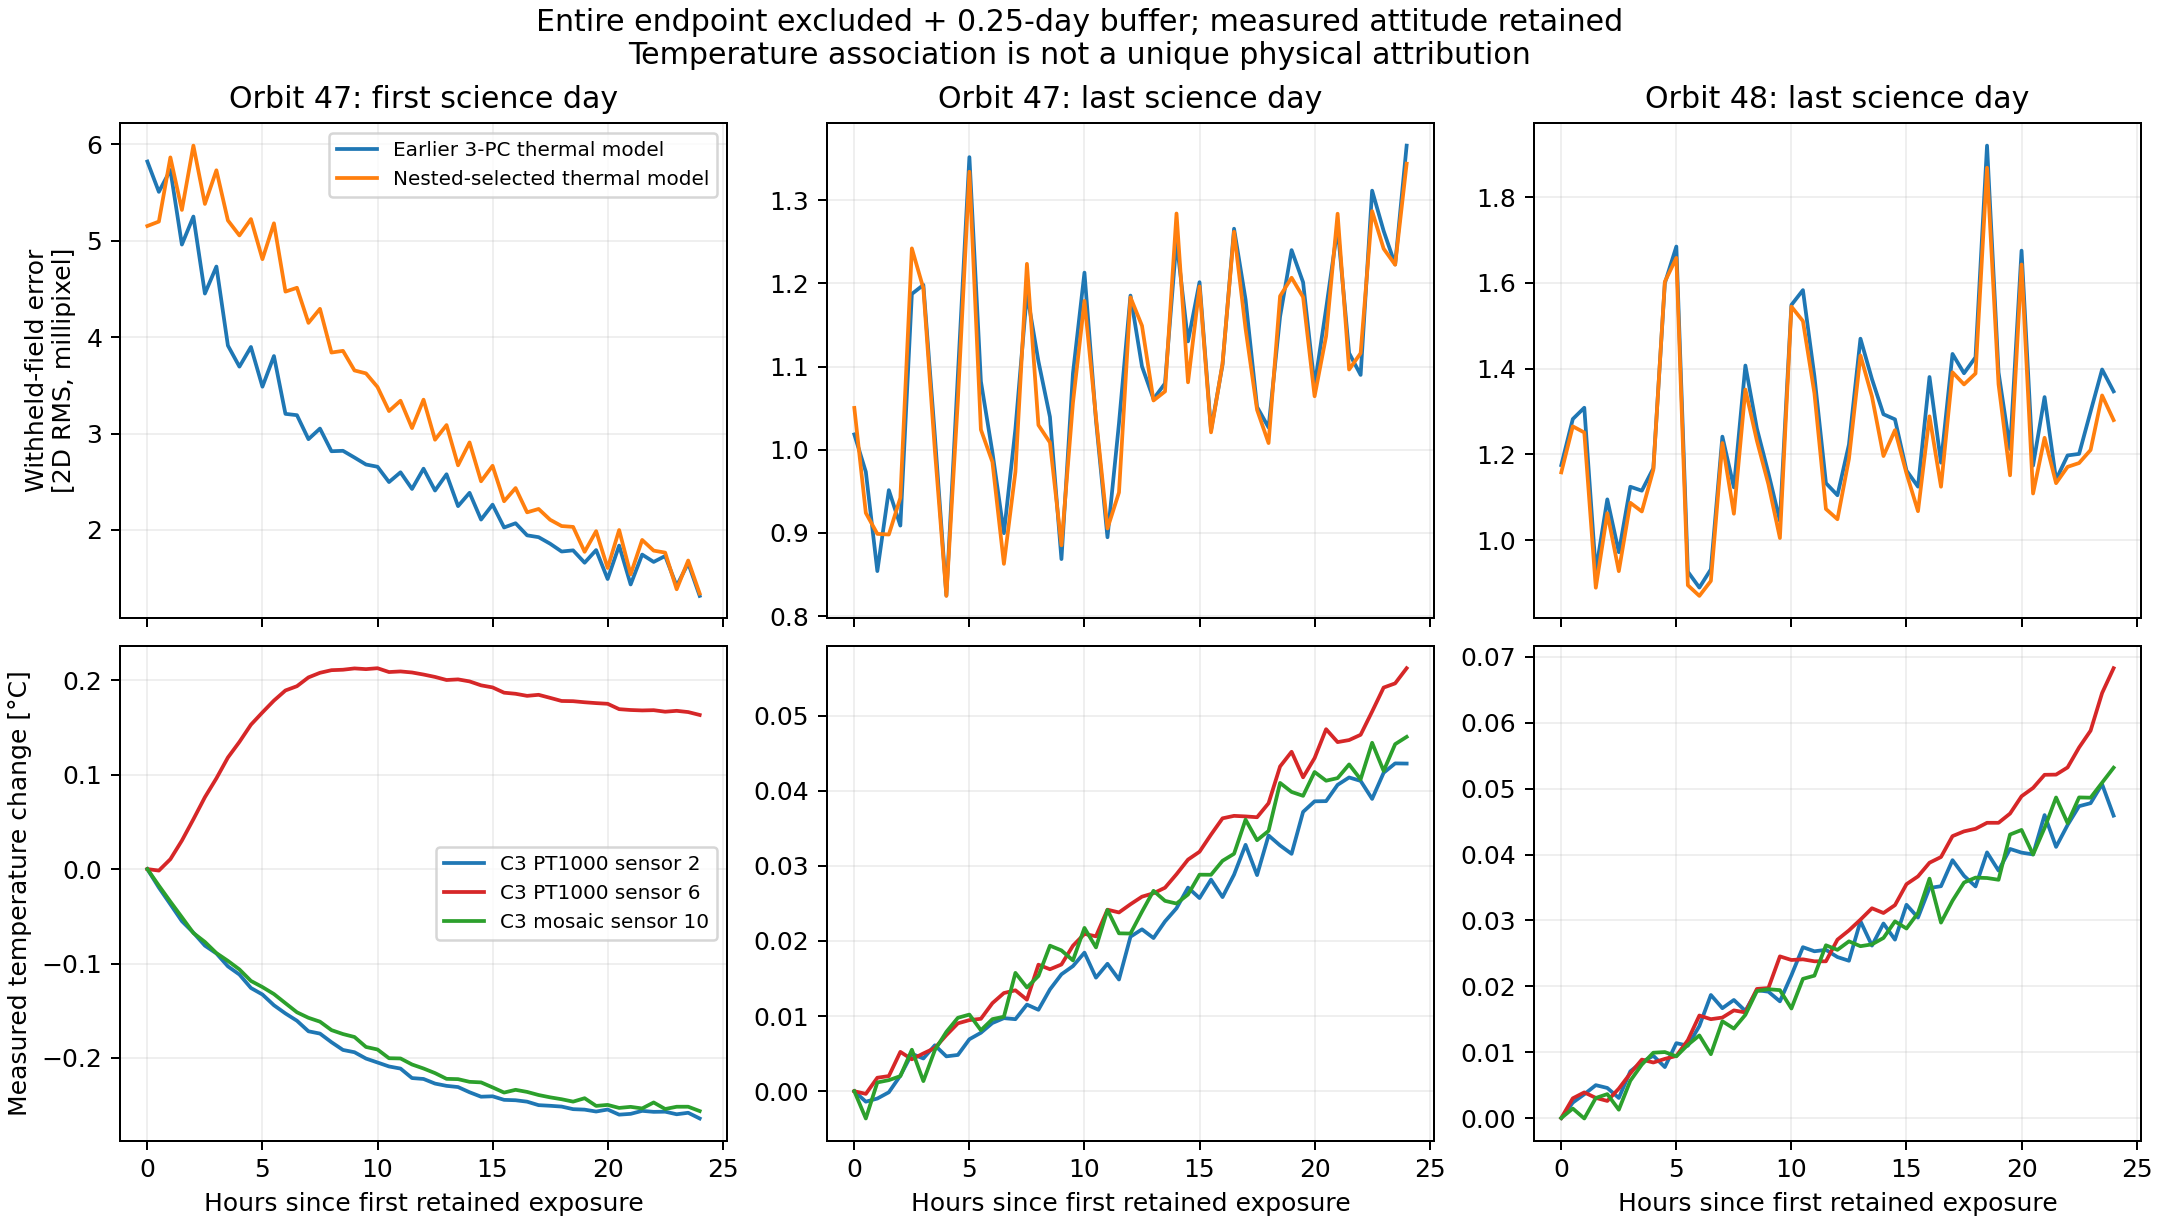
Thermal histories and predictions
- Caption: Full-day withheld distortion errors (top) and simultaneous measured Camera 3 temperatures (bottom). Columns show the first science day of orbit 47 and the final science days of orbits 47 and 48. Each endpoint was excluded from training with an additional 0.25-day buffer. Upper curves use equal-weight two-dimensional vector RMS over all 16 CCDs and 81 inset probes per CCD, after exact physical velocity aberration and the measured common attitude are removed. Blue uses the earlier three-temperature-PC predictor; orange uses the separately evaluated nested selection policy allowing instantaneous, rate and lag features. Each interval contains 49 retained exposures. Bottom curves are exposure-averaged sensor changes relative to that interval's first retained exposure; they illustrate different thermal histories and do not establish a causal component-by-component attribution.
- Evidence boundary: Orange is the saved
dynamic_selectedendpoint prediction, not the best instantaneous-only policy. Its interval RMS is 3.625, 1.099 and 1.246 millipixel, respectively. Startup is worse than the earlier model here; additional candidate lags do not guarantee better predictions. The historical instantaneous-only first-day value of 2.874 millipixel is not plotted. - Why this figure: Demonstrates the endpoint asymmetry and the difference between thermal correlation and predictive completeness. Upper and lower axes use different column ranges to display structure; read numerical scales when comparing amplitudes.
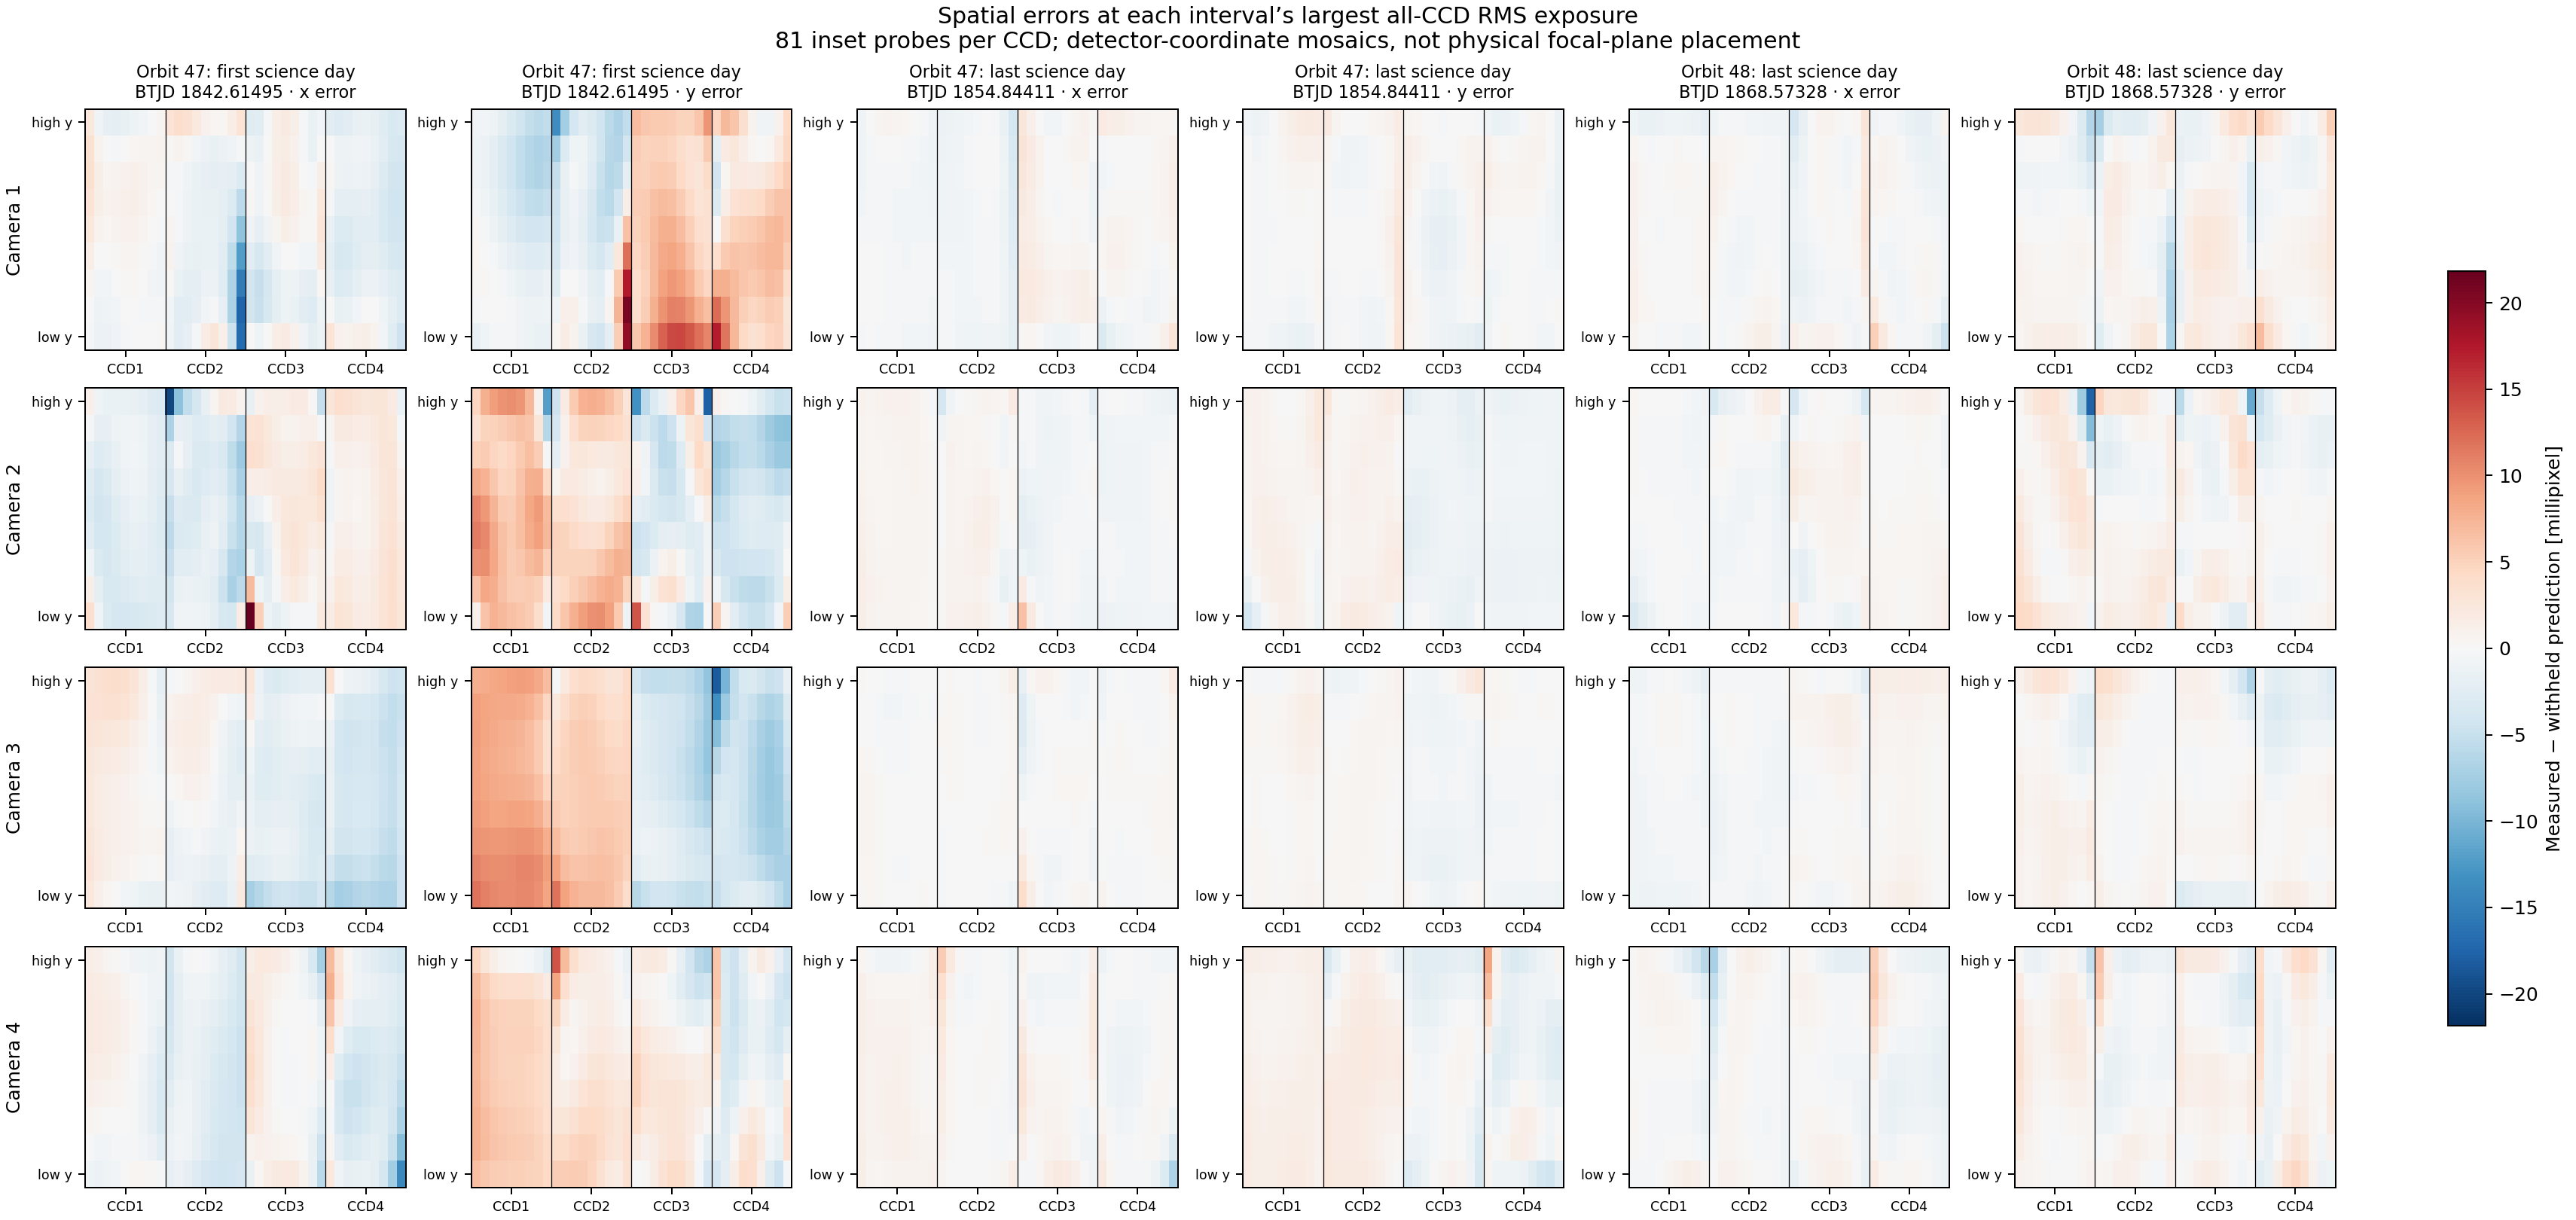
Spatial prediction errors
- Caption: Signed x and y components of measured-minus-withheld-predicted distortion for the orange model in Figure A. For each interval, the exposure with the largest all-CCD vector RMS was selected by a fixed rule. Rows represent cameras; each panel contains four separate detector-coordinate 9×9 probe maps, ordered CCD1–4 from left to right. These are not physical focal-plane mosaics. Every panel shares the same symmetric colour scale, with no clipping (±21.854 millipixel). Selected spacecraft times are BTJD 1842.61495, 1854.84411 and 1868.57328. The maps display the actual fields underlying Figure A's error statistic, rather than residuals of an in-sample atlas calibration.
- Evidence boundary: These are WCS-probe displacement images, not stellar intensity residual stamps. They illustrate the worst all-CCD exposure in each interval, not every exposure entering the interval RMS. Smoothly coherent startup error and local extremes are visible. The single shared scale deliberately leaves the weaker last-day structure comparatively faint.
- Gauge: All-camera measured attitude and common-clean support are retained. Camera 1's contaminated orbit-48 startup has no clean common frames; that interval is omitted. The separately recovered cameras 2–4 startup solution uses a different attitude convention and is not mixed into this figure.
Figure 3. Pointing is a separate prediction problem
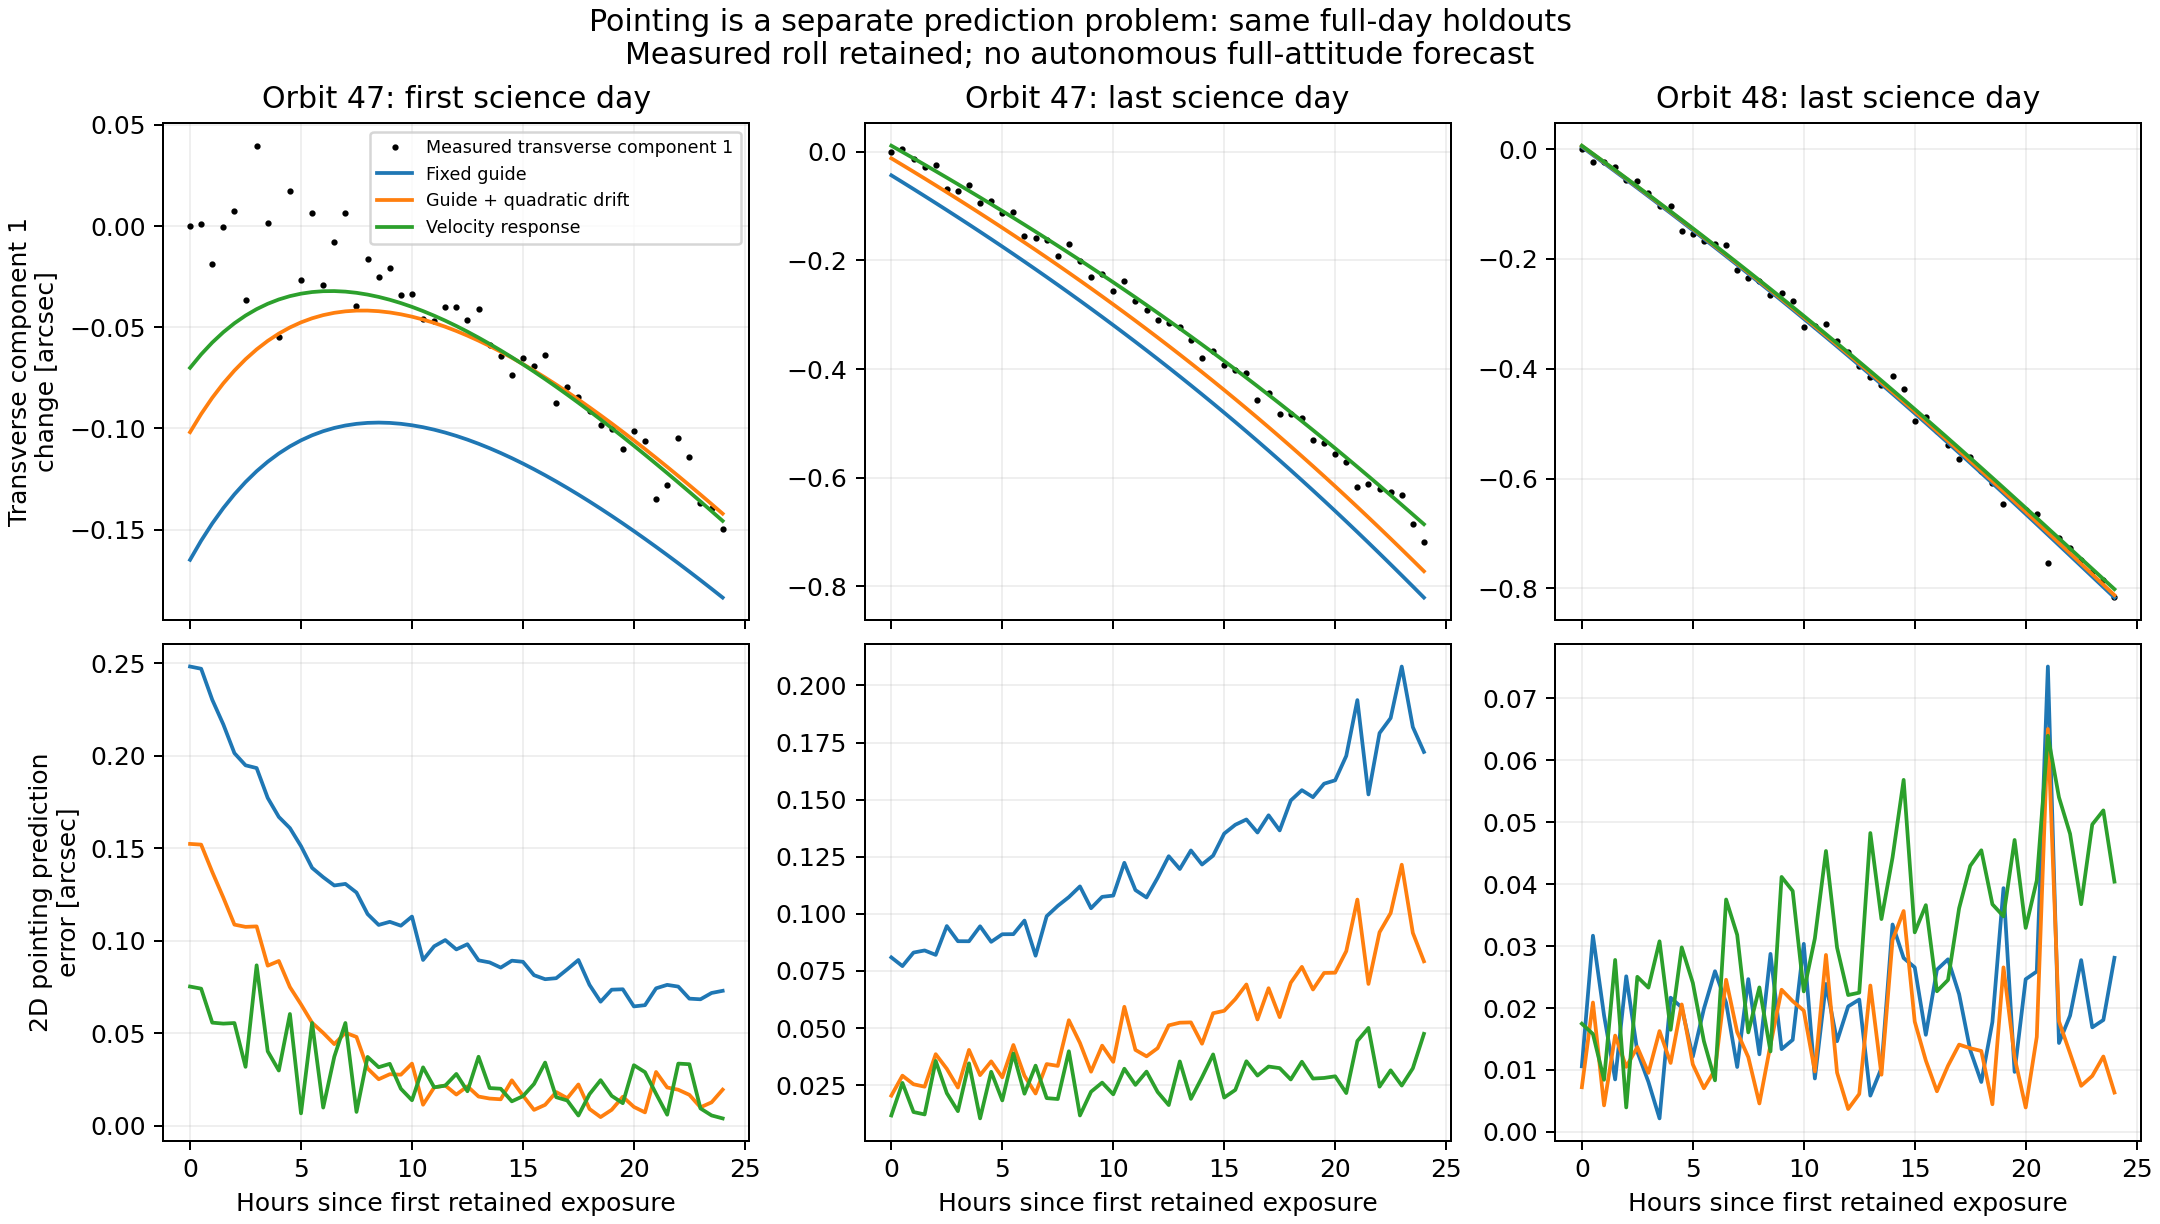
- Caption: Withheld endpoint pointing predictions from fixed-guide, guide-plus-quadratic-drift and empirical velocity-response models. Upper panels show measured transverse attitude component 1 and predictions, all relative to the first measured value in that interval. Lower panels show the two-component prediction-error magnitude in arcseconds. Training excludes the entire endpoint and its 0.25-day buffer. The roll component remains measured; these are not autonomous full-attitude forecasts. The empirical velocity response need not recover unique onboard guide weights.
- Why separate: A small attitude-conditioned distortion error does not certify a good pointing prediction. None of the three displayed models dominates every endpoint.
Figure 4. Changing the ePSF centre does not remove startup motion
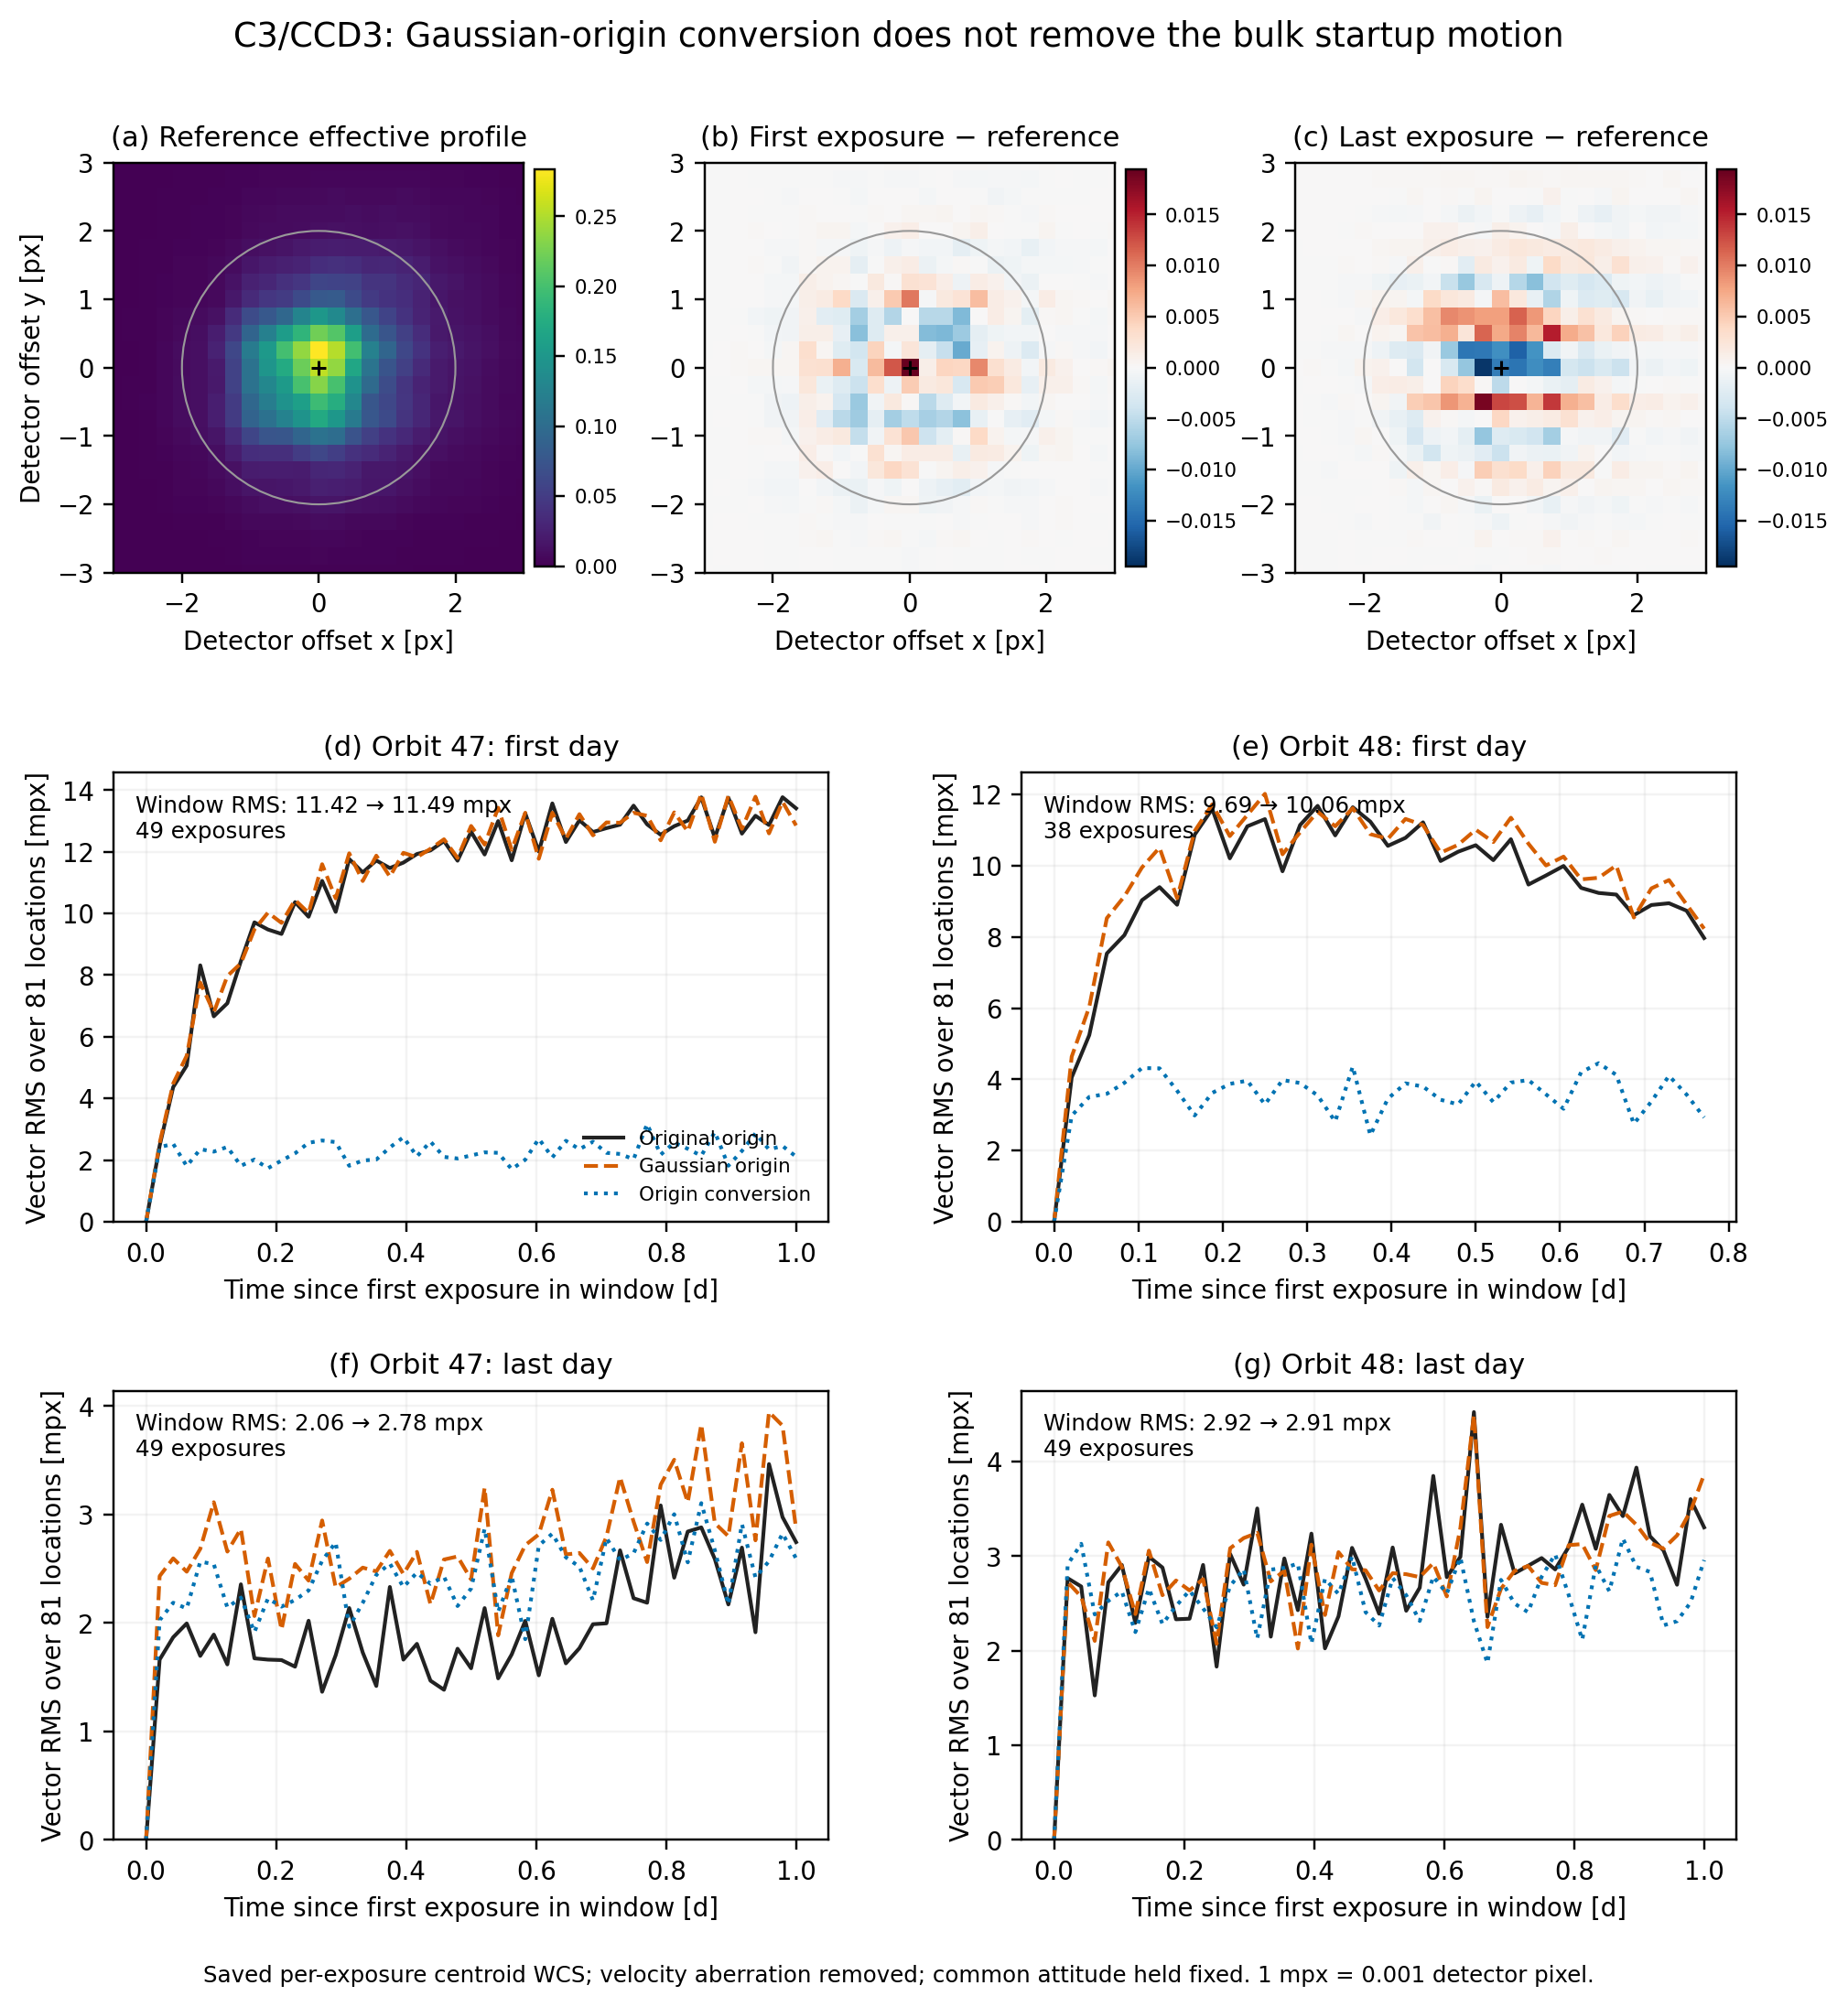
Figure: centre conventions and orbital endpoints
Caption — centres_endpoints.pdf. Effect of a fixed elliptical-Gaussian centre convention on Sector20 camera3/CCD3 centroid-derived WCS. (a) The saved effective profile at the central detector probe in reference exposure292. (b,c) First- and last-exposure profiles of orbit47, minus that reference; their amplitudes are matched within the two-pixel fitting radius, without translating either profile. The difference panels share a colour scale. Circles mark the fitting radius. (d–g) RMS vector motion across81 detector locations, measured relative to the first usable exposure in each orbital-endpoint window. Black and orange curves use the original and Gaussian origins, respectively; blue shows the conversion itself. Physical velocity aberration is removed, and the measured common attitude is held fixed. These curves use the complete usable-cadence archive, not the earlier sparse pilot. An origin conversion does not remove the bulk startup motion. It is a coordinate-convention test, not an independent measurement of true positions or a causal thermal attribution.
- Source coverage:1167 usable exposures;81 locations; C3/CCD3 only. Gaussian fits use the saved pixel-integrated effective profiles, fixed radius2 pixels, free elliptical covariance, and zero background.
- Orbit47 first-day window RMS:11.424→11.495 millipixels;49 exposures.
- Orbit48 first-day window RMS:9.692→10.062 millipixels;38 exposures.
- Orbit47 last-day window RMS:2.064→2.777 millipixels;49 exposures.
- Orbit48 last-day window RMS:2.917→2.910 millipixels;49 exposures.
- Window metrics include the common detector translation remaining after the fixed attitude subtraction; they are not the separately tabulated shape-only metric.
- Window metrics are relative to each window's first exposure, not absolute errors or withheld-time prediction scores. Their numerical denominator differs from the thermal-model validation figures.
- Display amplitudes are adjusted only to make profile-shape differences visible. No position or ePSF is refitted for figure generation.
- First/last profile images are illustrative central-probe orbit47 exposures0 and588; the WCS curves summarize all81 probes in each window. These images do not alone represent every spatial or temporal variation.
Caption — centres_full_series.pdf (supporting figure). Evolution of the Gaussian-origin offset relative to exposure292 for three representative detector probes, using all1167 usable exposures. The x and y offsets are in native detector millipixels. The vector RMS over the complete81-probe dataset is3.478 millipixels. Constant offsets between centre conventions cancel in this time-dependent comparison. This is sensitivity to the profile-origin definition, not a validated correction to geometric positions.
- Main conclusion: the tested Gaussian convention changes millipixel structure, but does not suppress the dominant first-day motion.
- Remaining requirement: independently measured stellar positions on identical pixel support, with a common explicit centre convention; no accuracy claim follows from the conversion alone.
- Inputs and output hashes:
/astro/armin/koji/syndiff/dev_runs/wcs_paper_package_20261015/figure_outline/centres/manifest.json. - Generator:
FIG_CENTRE_CONVENTIONS.py; activatesyndiff, then run the script. No new model fits or training jobs.
Supporting full-sector origin series
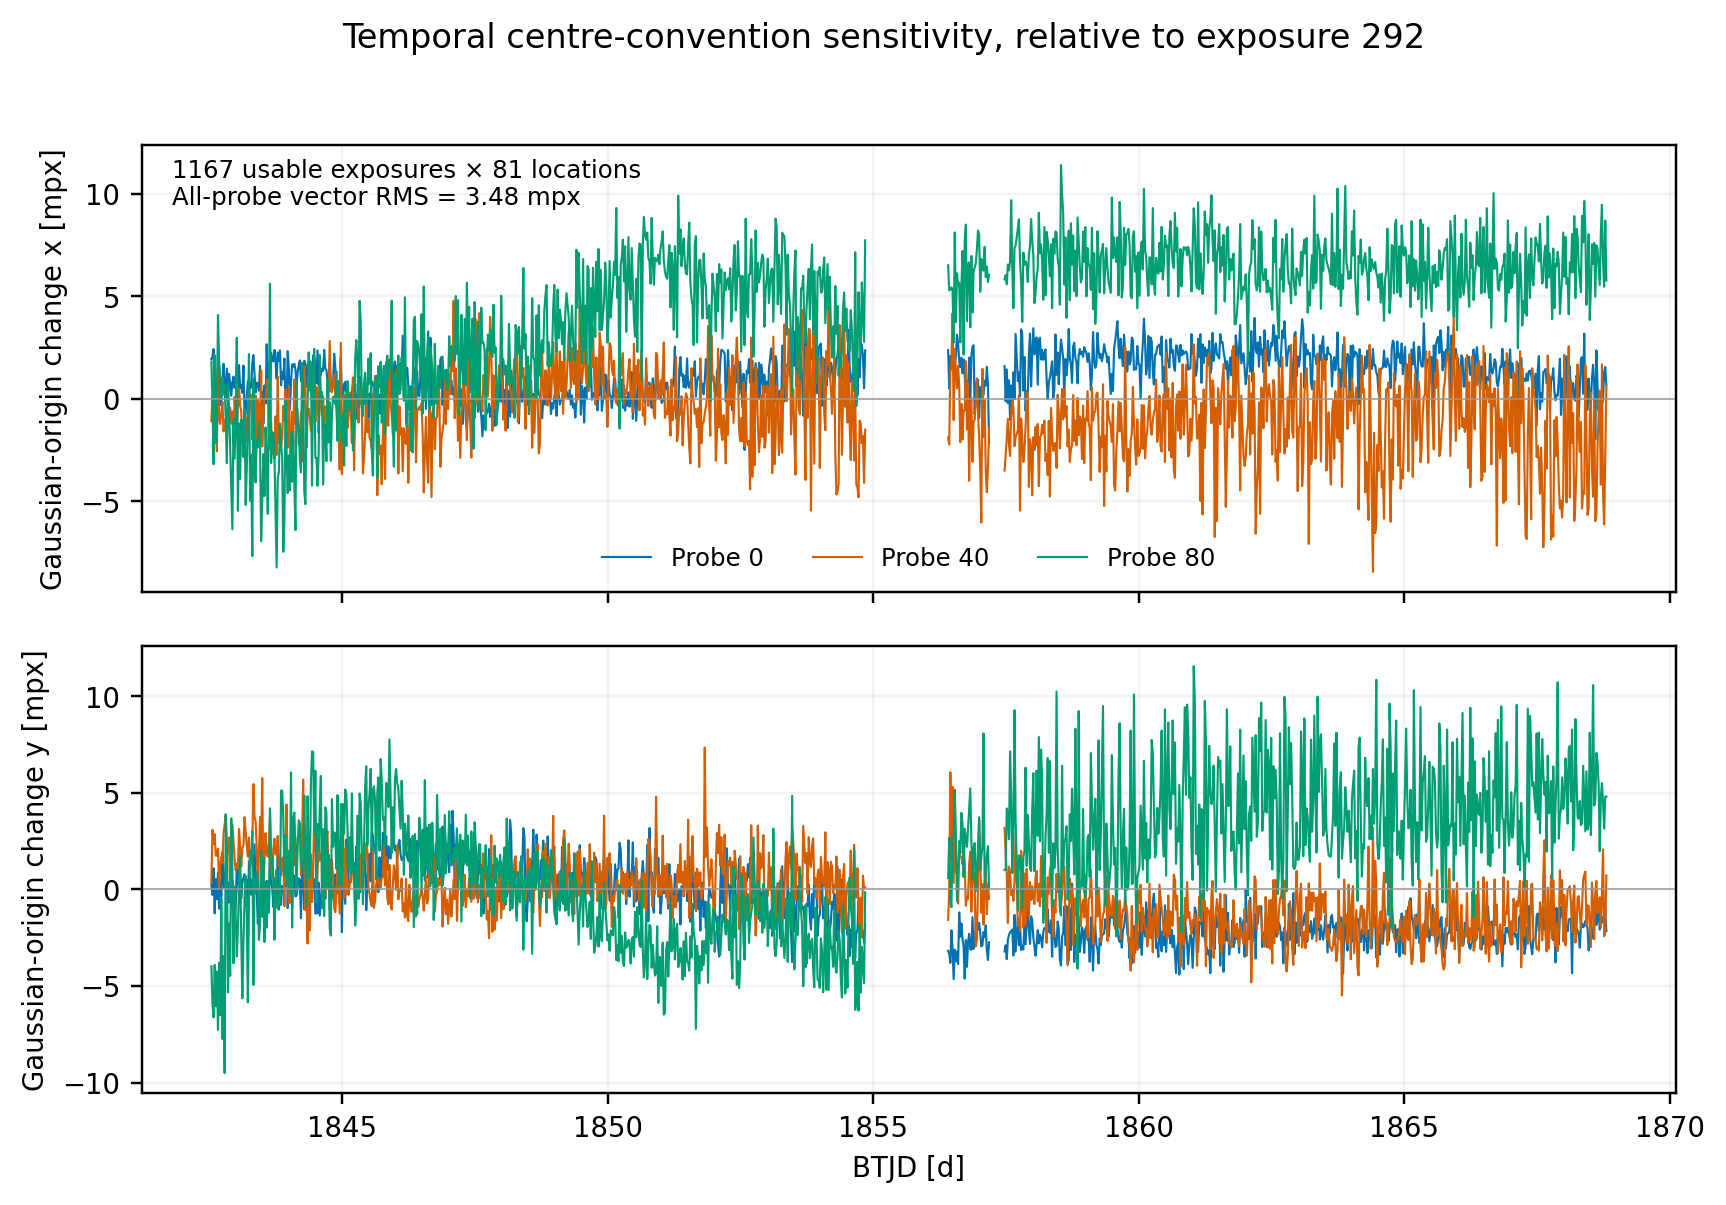
Figure 5. Centroid consistency has a spatial and temporal floor
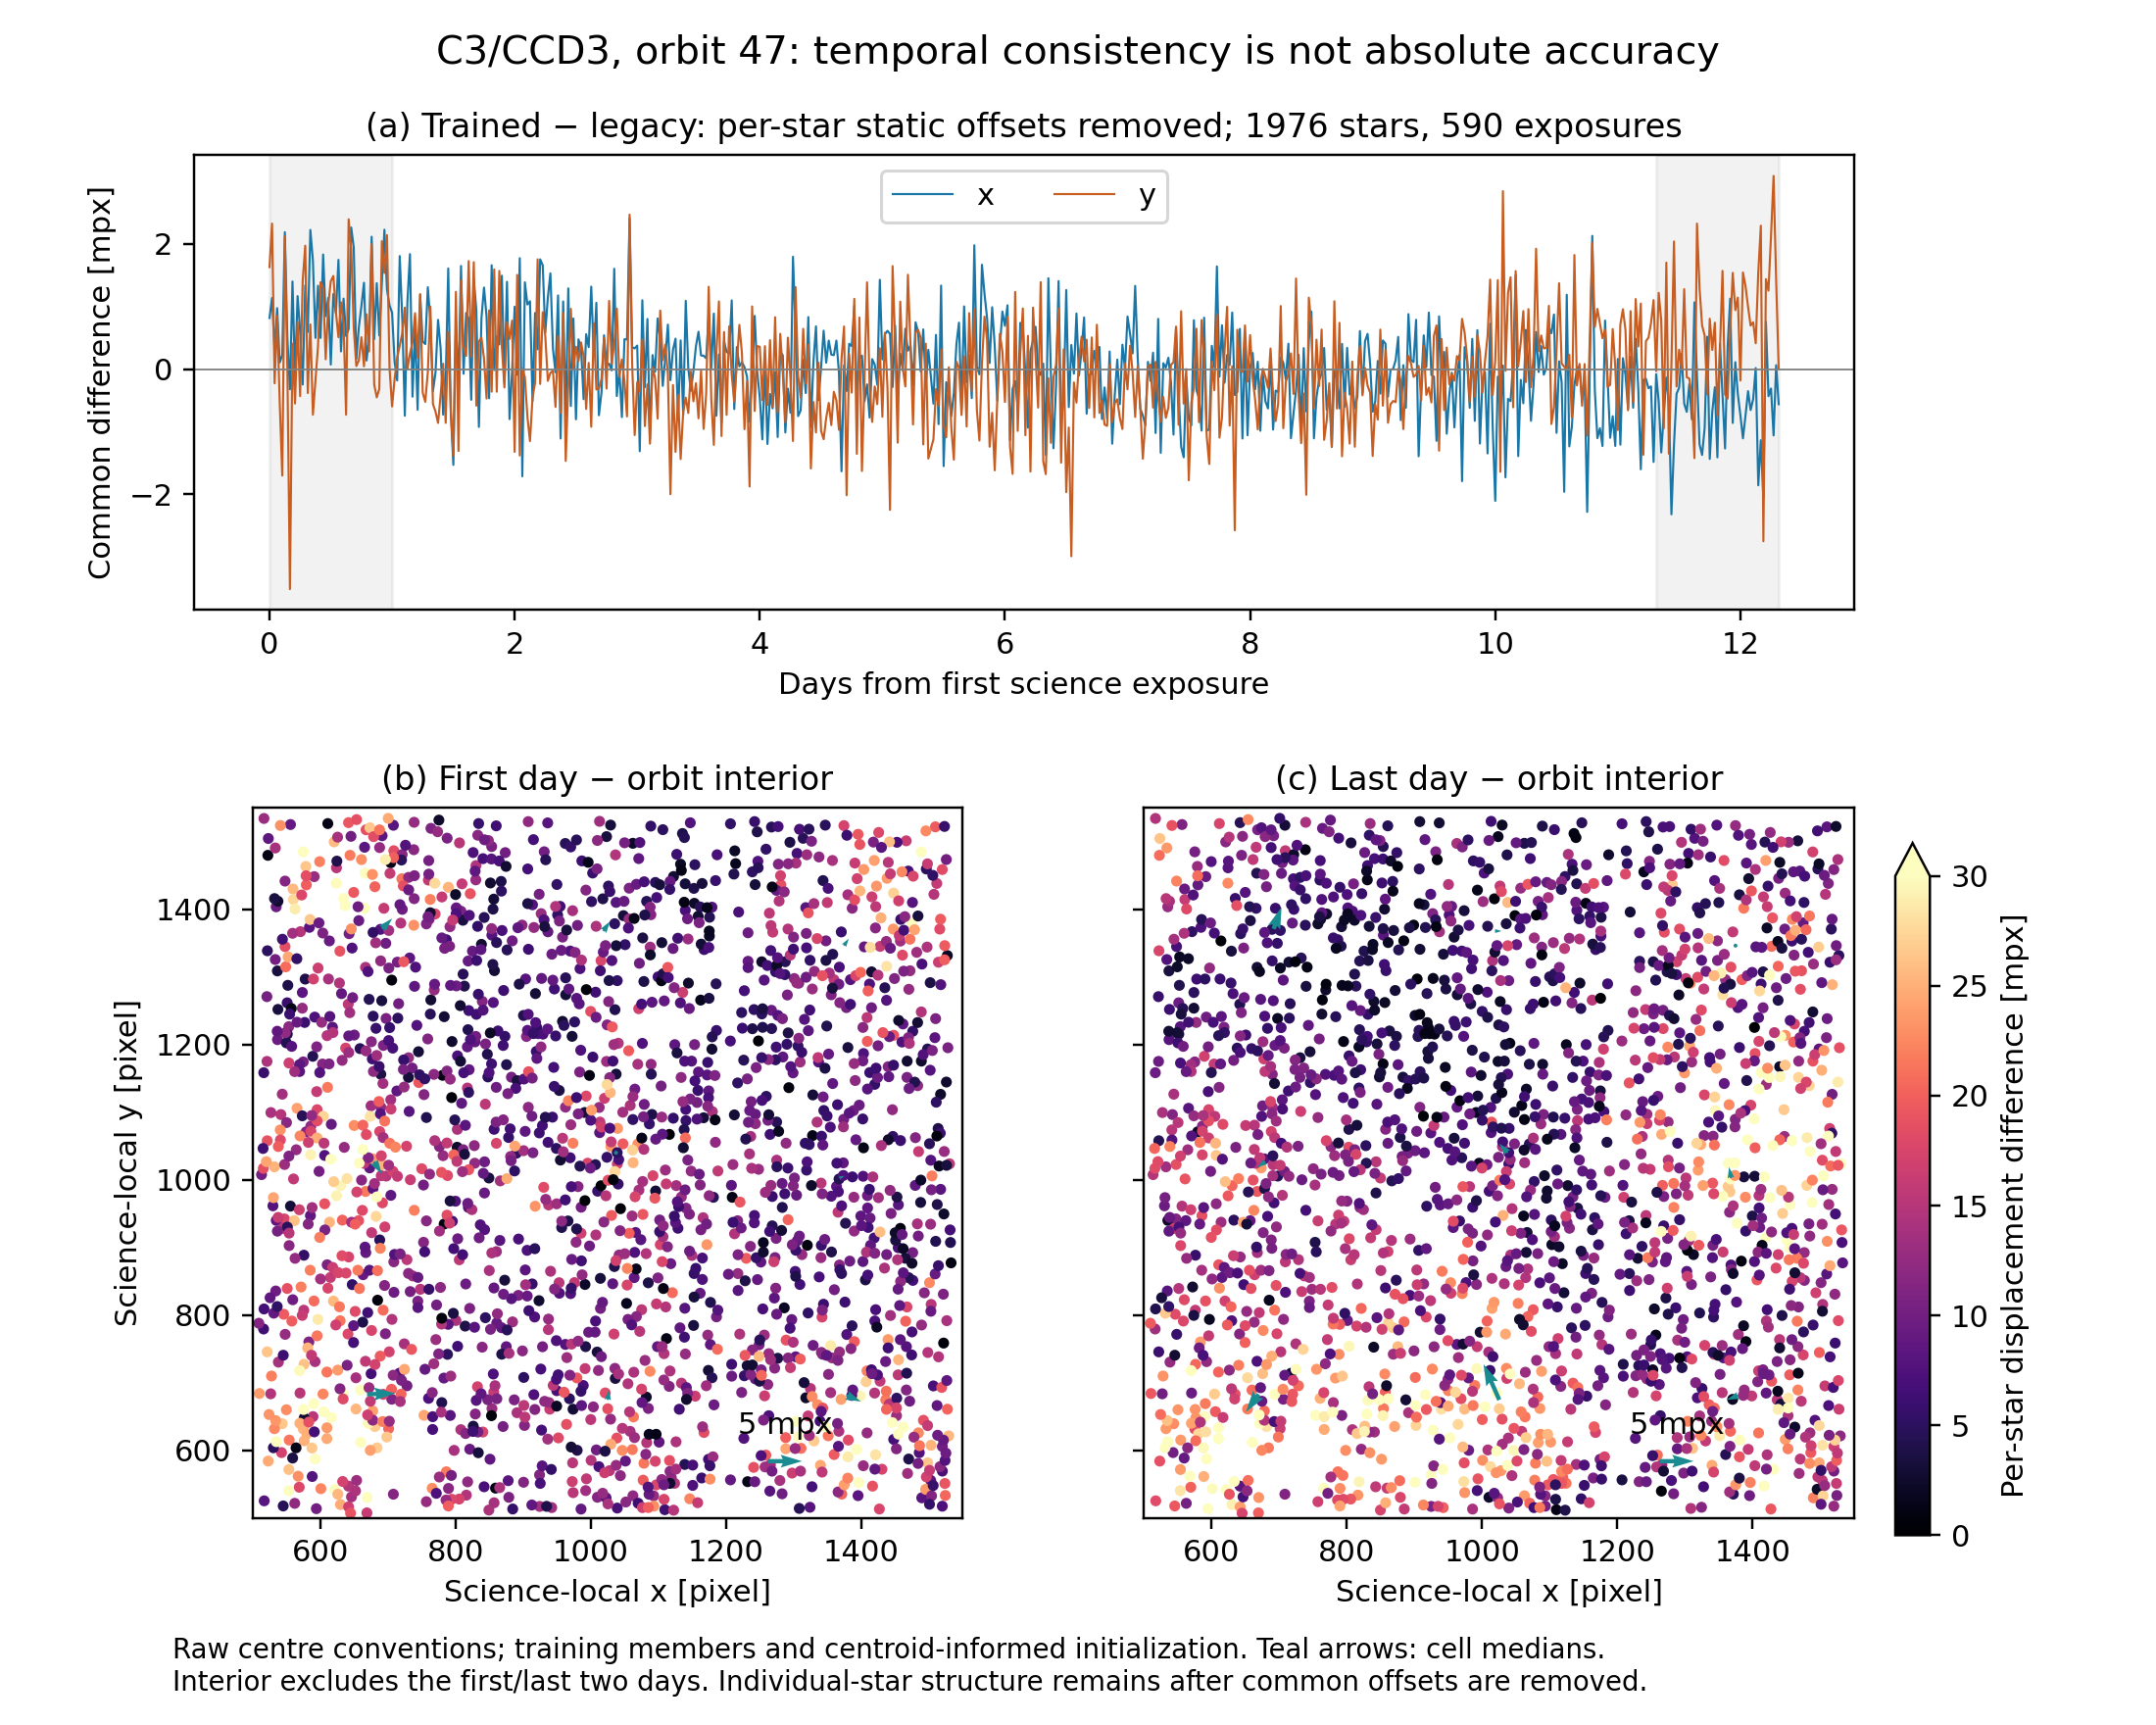
Figure 5 — What do the centroids agree on?
- Caption: Temporal consistency of the legacy and jointly trained C3/CCD3 positions on a fixed cohort of1976 stars across590 exposures in orbit47. (a) Each star’s persistent offset is removed before taking the per-exposure median x/y differences. Gray bands identify the first and last observed days. (b,c) Per-star differences between those endpoint intervals and the orbit interior, with common colour scales; arrows show3×3-cell median vectors. Interior averages exclude the first/last two days.
- Supports: common temporal agreement is much tighter than individual-star agreement; spatially clustered differences remain.
- Does not establish: absolute accuracy, independent held-star validation, whole-CCD coverage, or orbit48 behavior. The trained region is the central1024×1024crop, and the model shares centroid-informed initialization and training images.
- Metric: common temporal vector RMS1.218mpx, cell-median RMS2.388mpx; these are estimator disagreements, not errors against known true positions.
- Underlying image evidence: retain the actual hp_d first/interior/last stellar stamps beside this figure on the webpage. The markers use the original, differing centre conventions.
- Interpretation: the centroids are useful for provisional ensemble trends, but cannot yet certify the smallest claimed WCS residuals.
Underlying observed stellar pixels
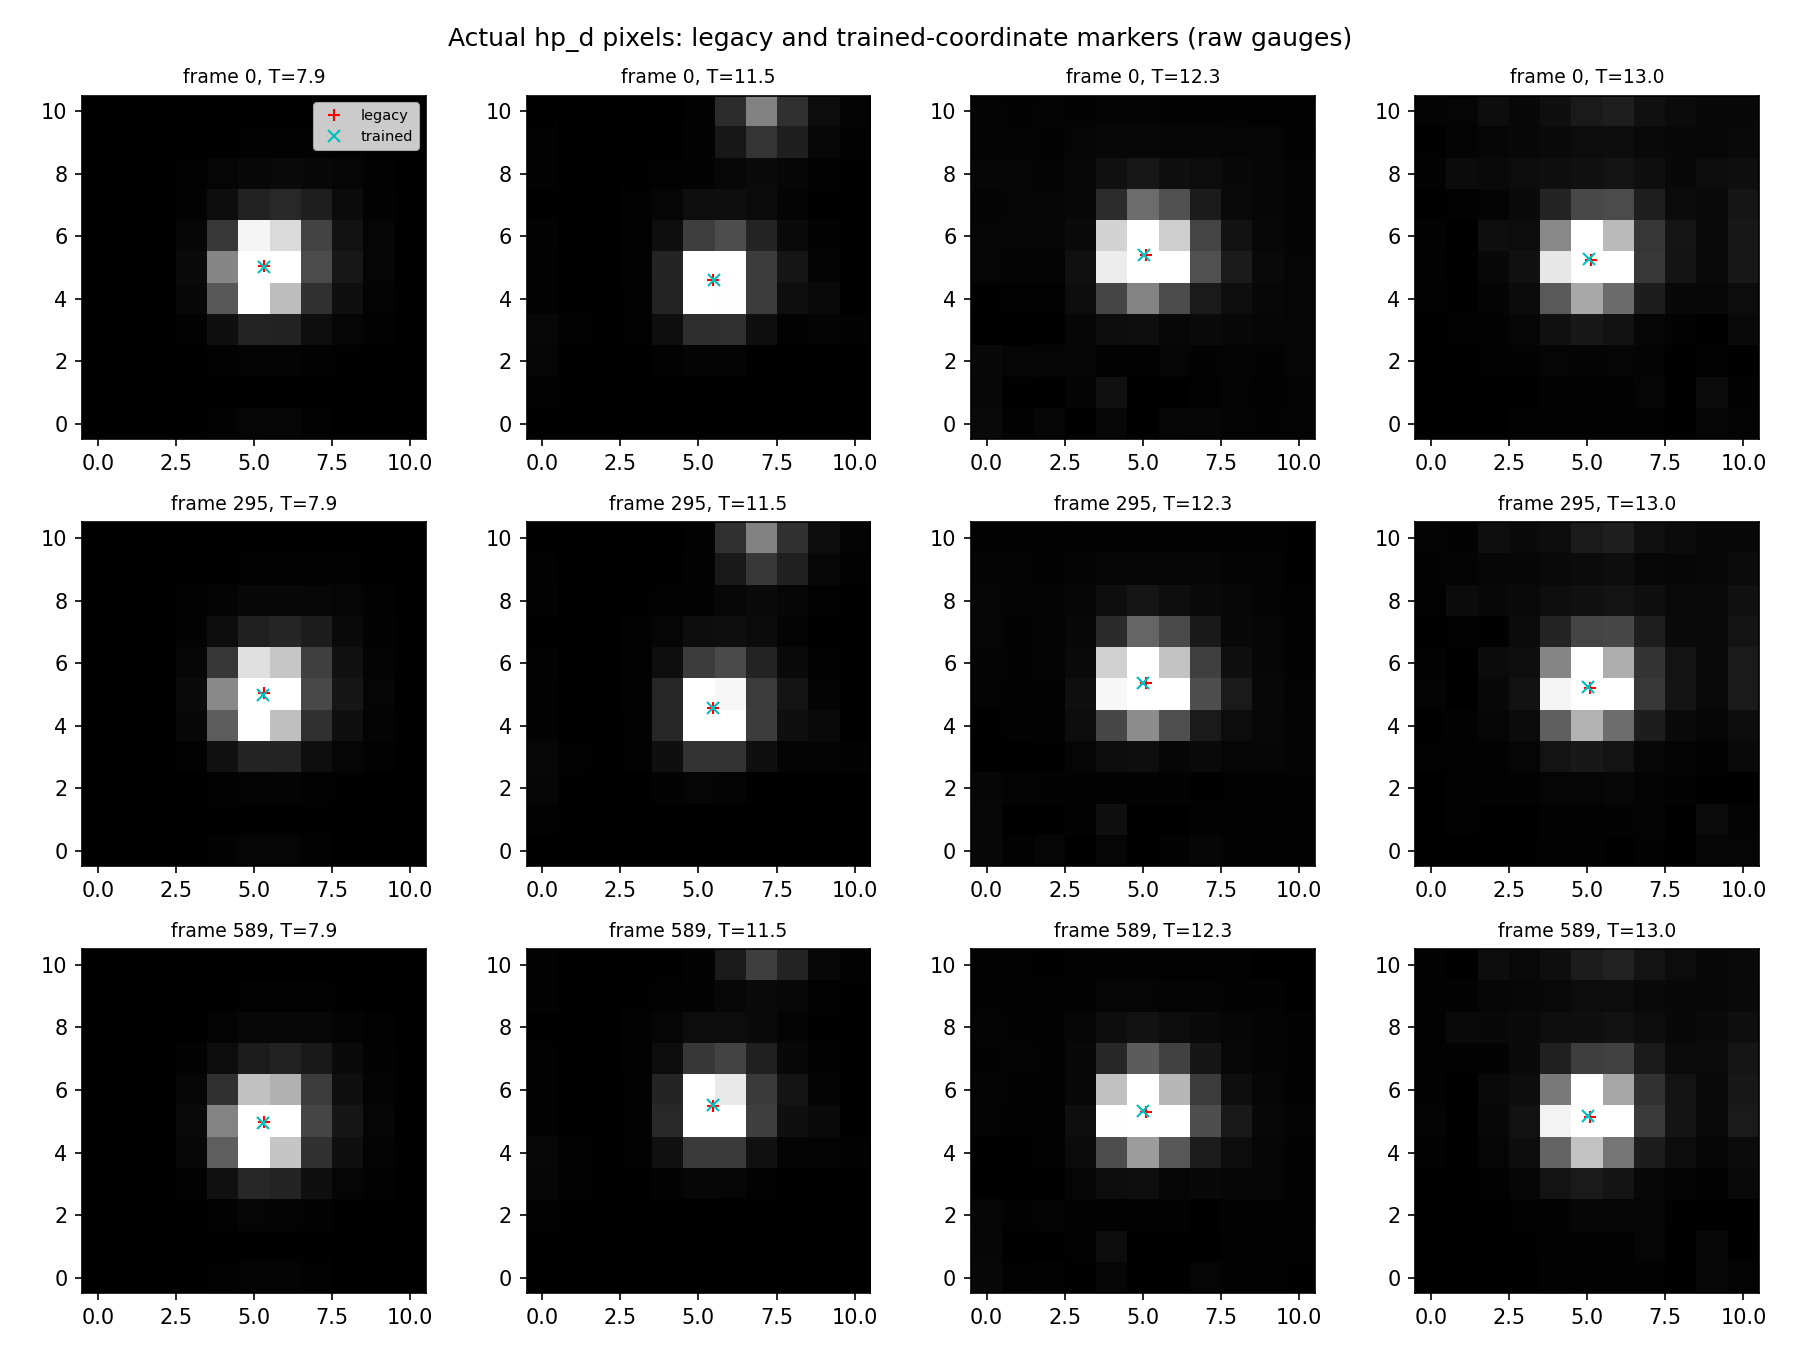
Markers show differing original coordinate conventions; this comparison shares training data and initialization.
Figure 6. The same-image held-source positioning test has started
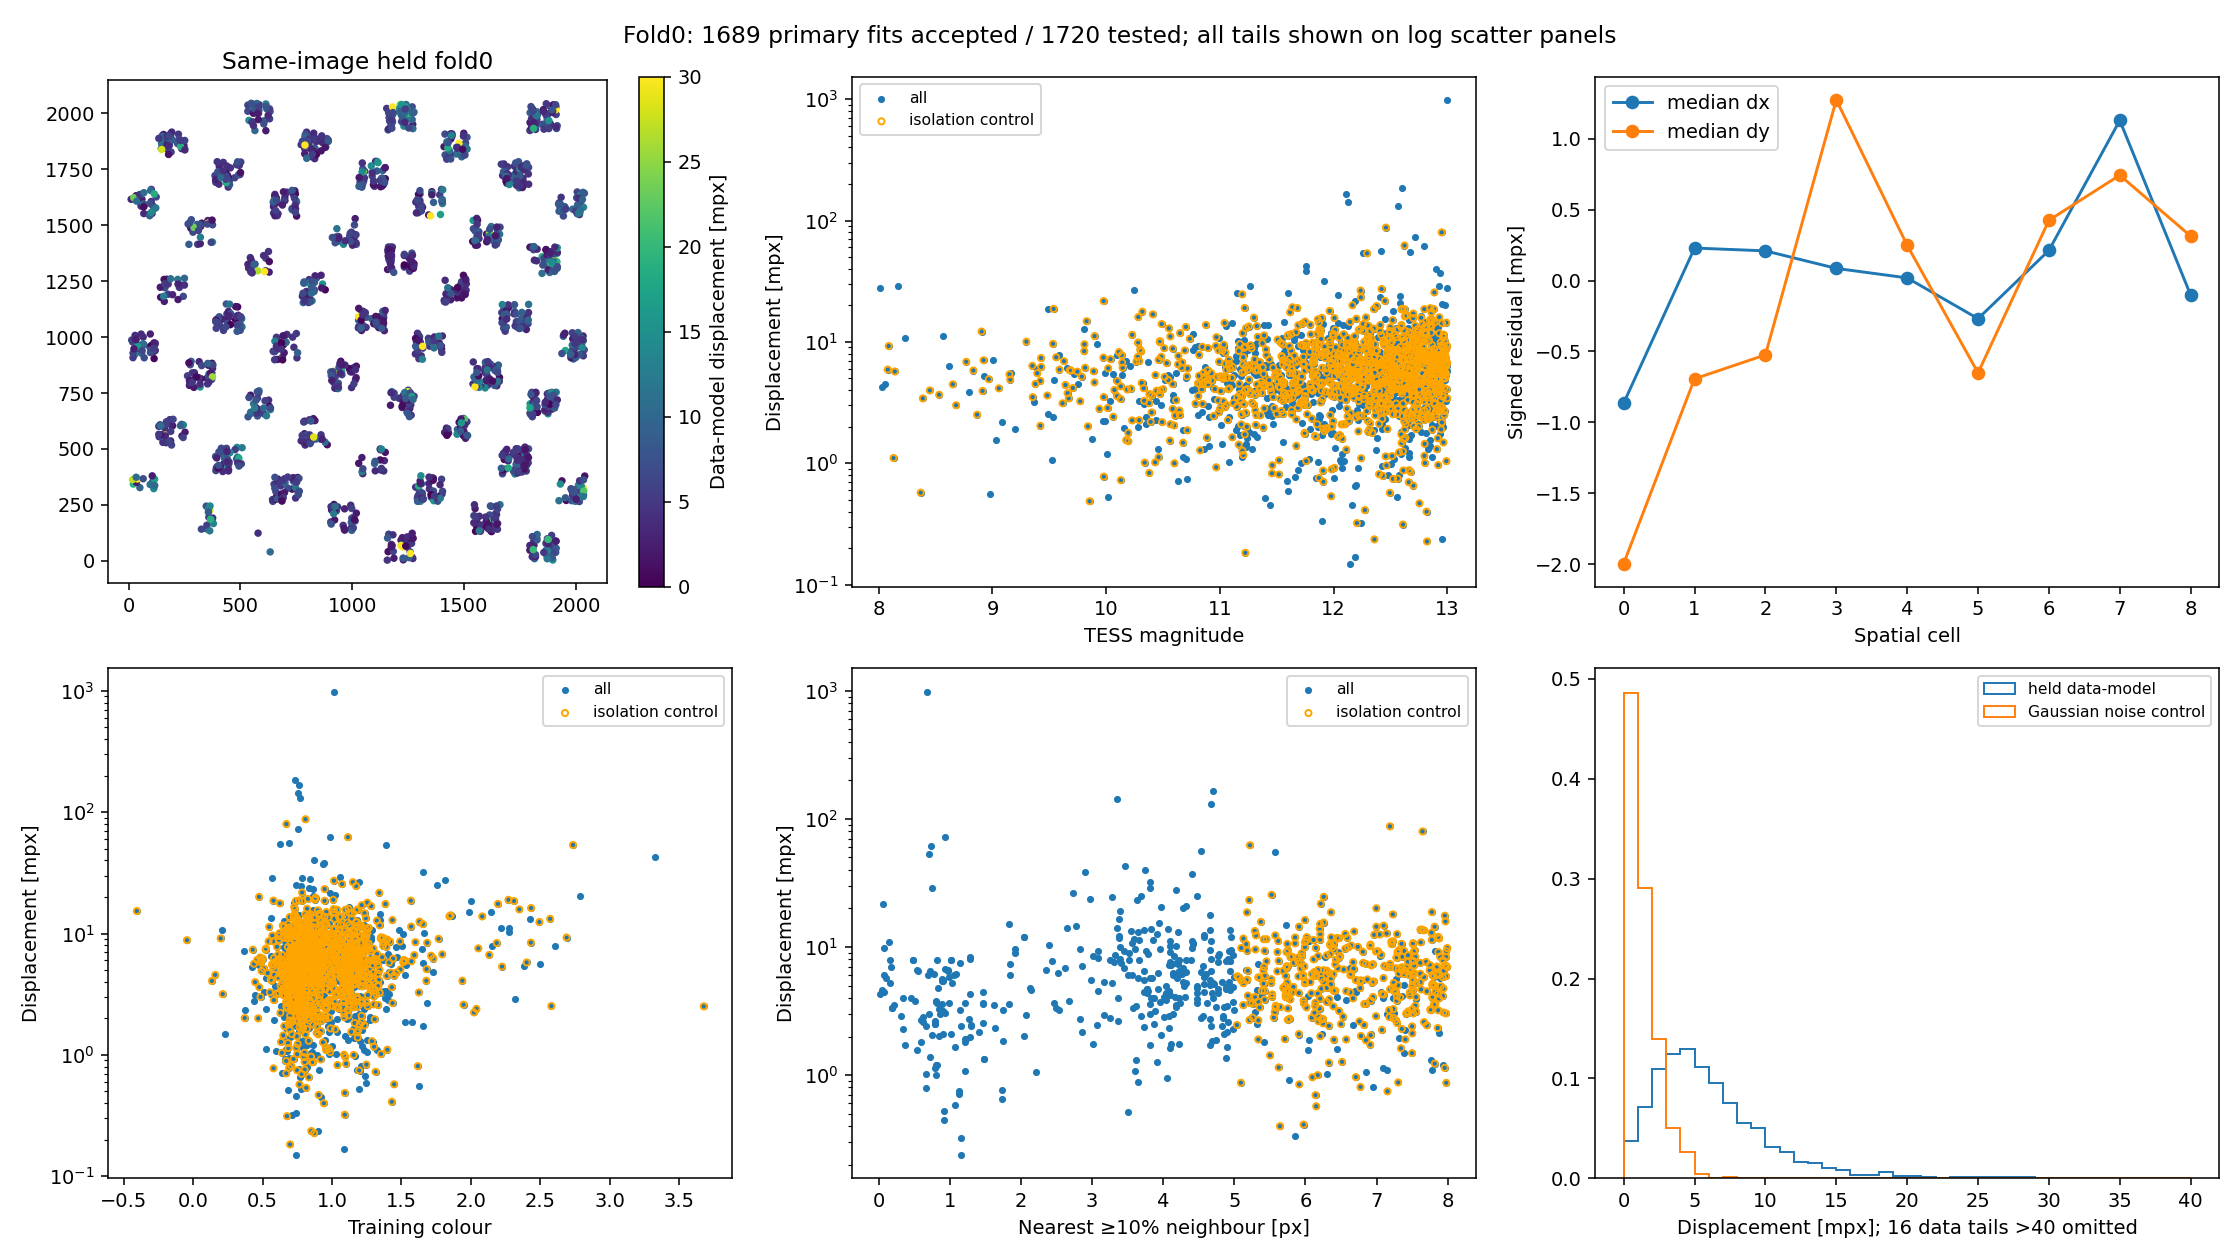
Development validation: one orbit-48 interior exposure, one strict held-source fold. PSF/WCS parameters excluded these sources, but photometric nuisance fluxes were solved on the test scene. This is conditional model–image estimator agreement, not absolute WCS accuracy or a test of orbital endpoints.
- 1720 sources tested; 1689 primary accepted pairs. Fitting-support audit: zero overlaps with training pixels.
- Same native pixels, image generation, masks and noise for Gaussian fits to observed and predicted stamps.
- Median 5.263 mpx; 90th percentile 11.635 mpx; RMS 26.791 mpx. The long tail is retained.
- Isolation control: 1126 pairs, RMS 8.529 mpx. This is a different population, not a claimed improvement on identical coverage.
- 1 mpx =0.001 native detector pixel. No new ePSF training was performed.
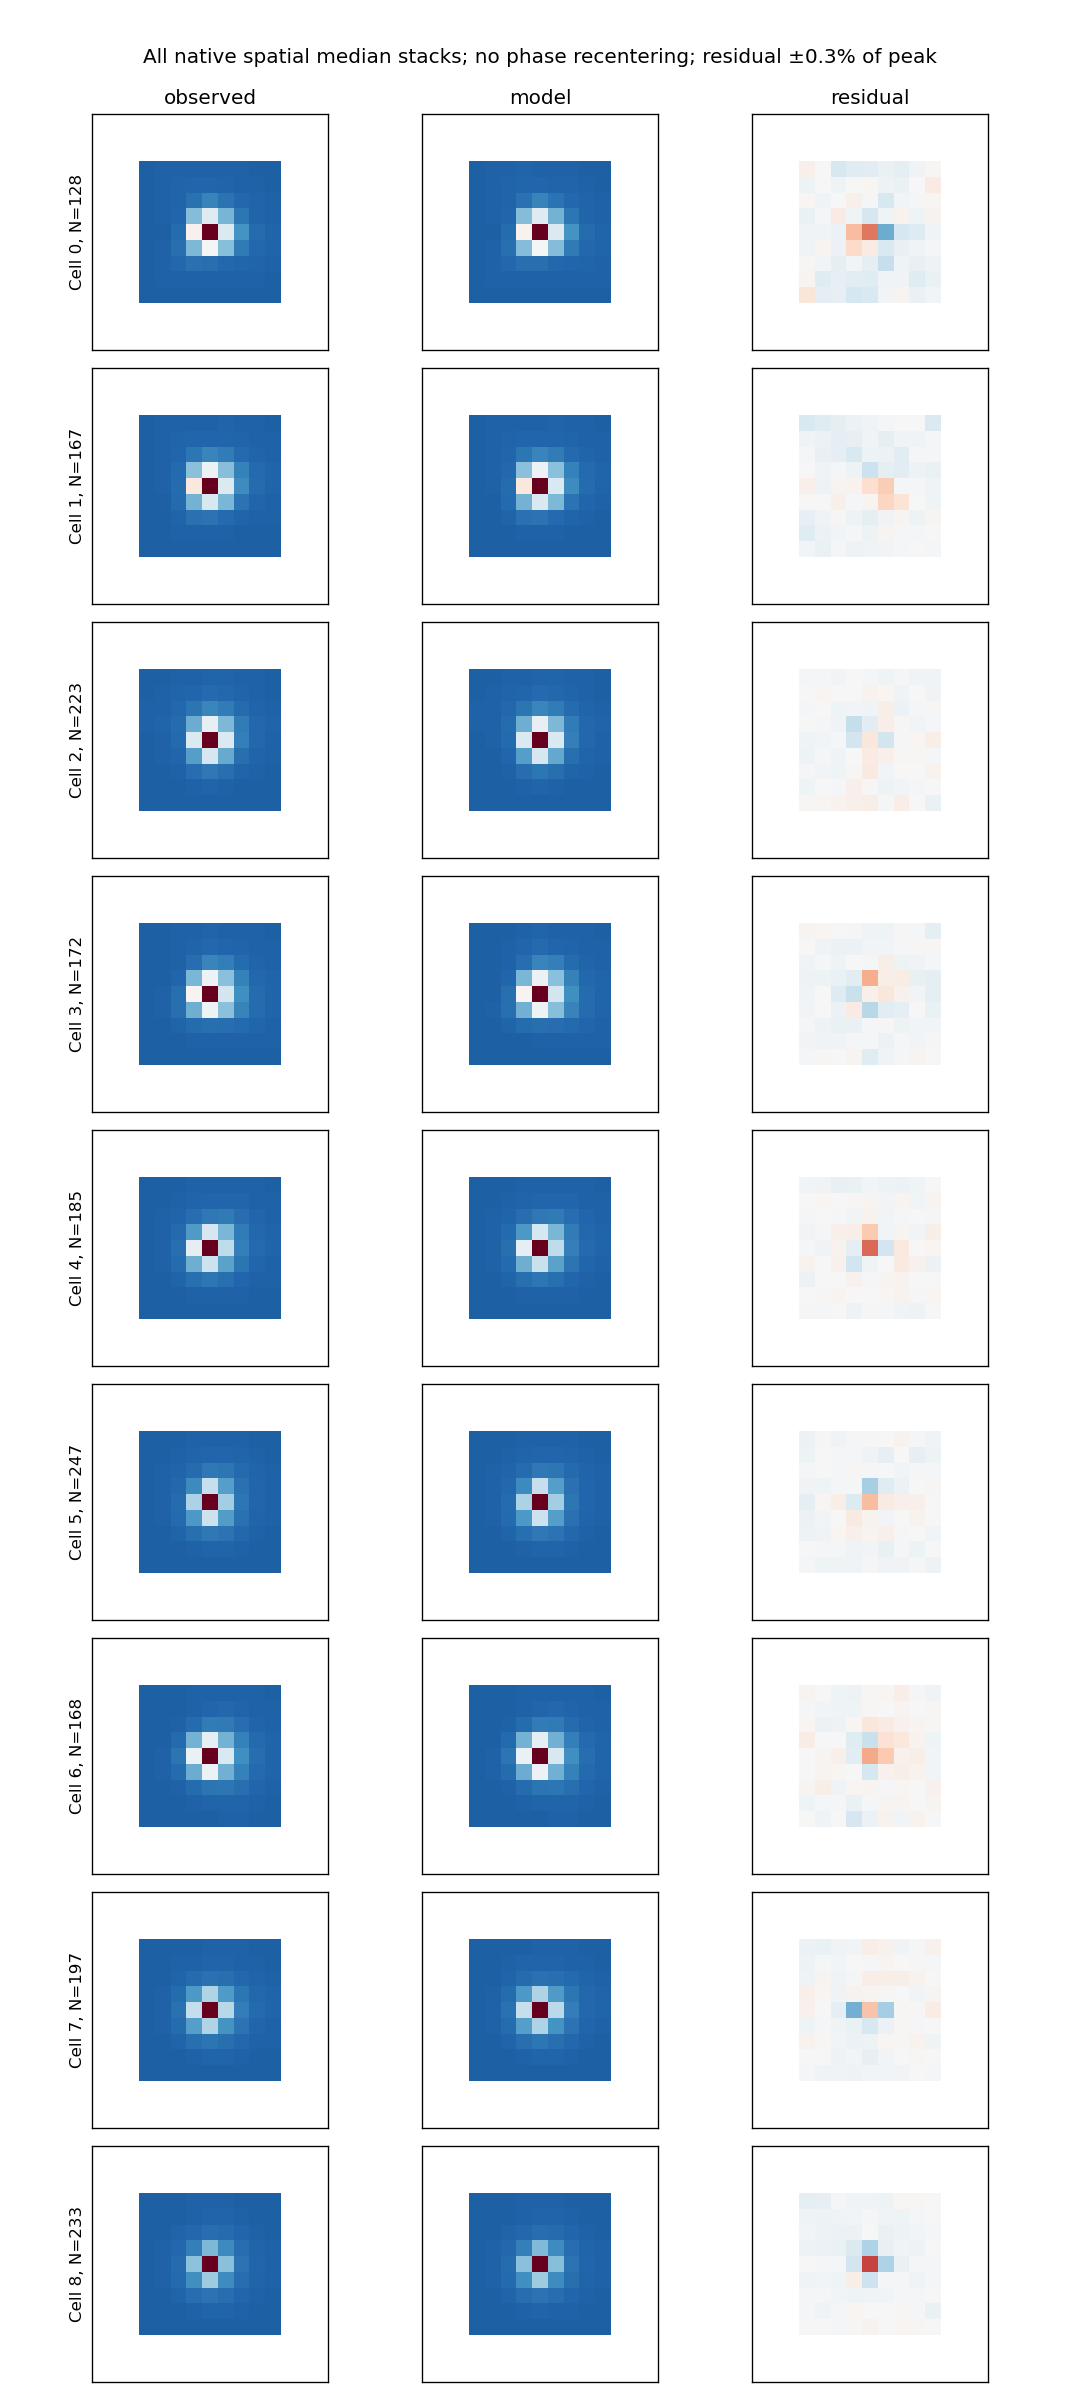
Largest disagreements — retained, not clipped away
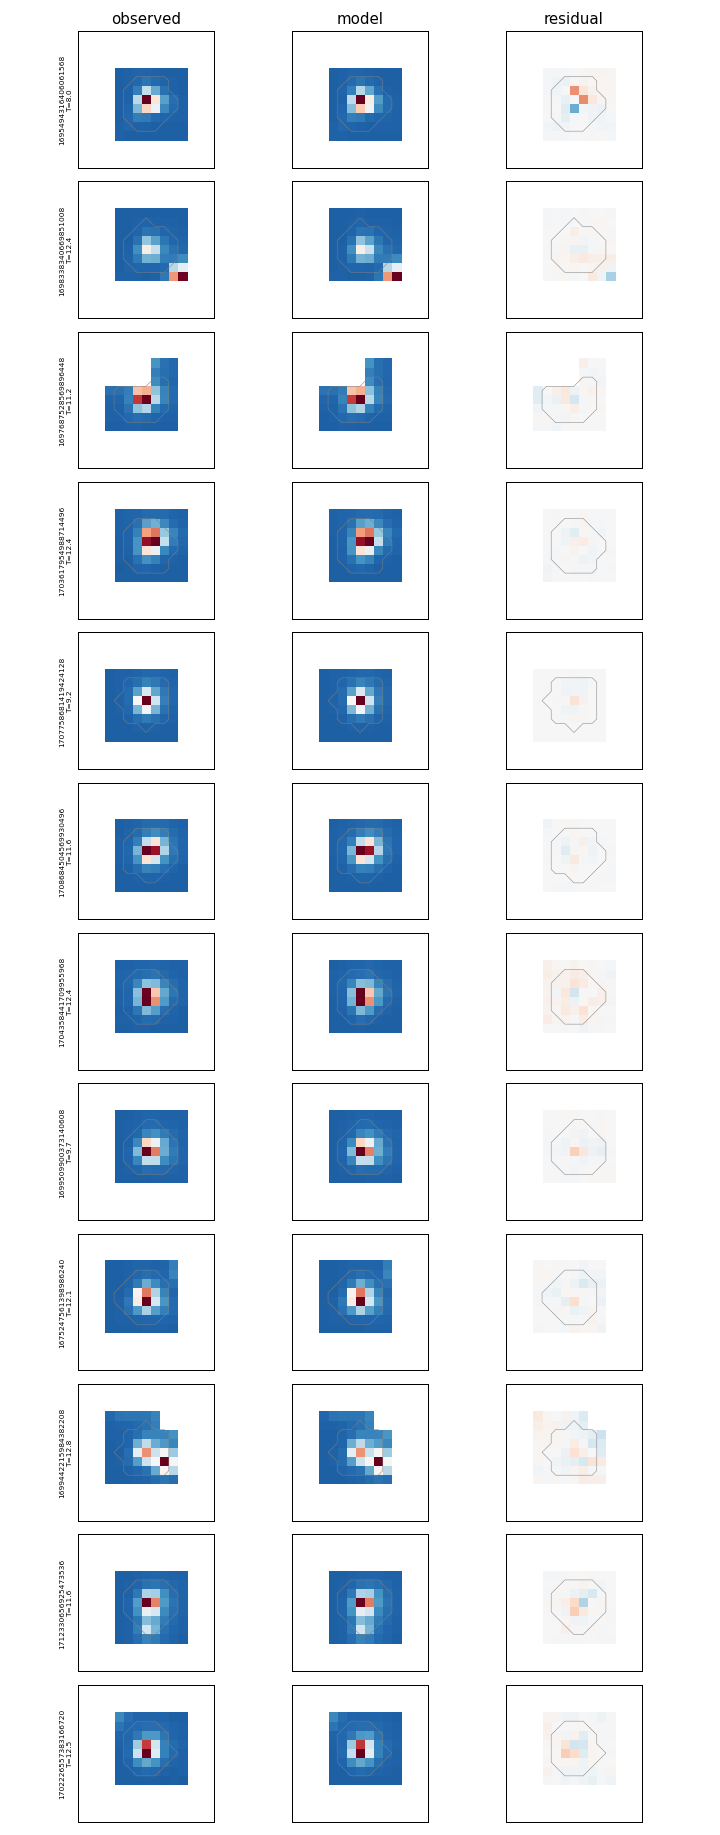
Representative measured-star gallery
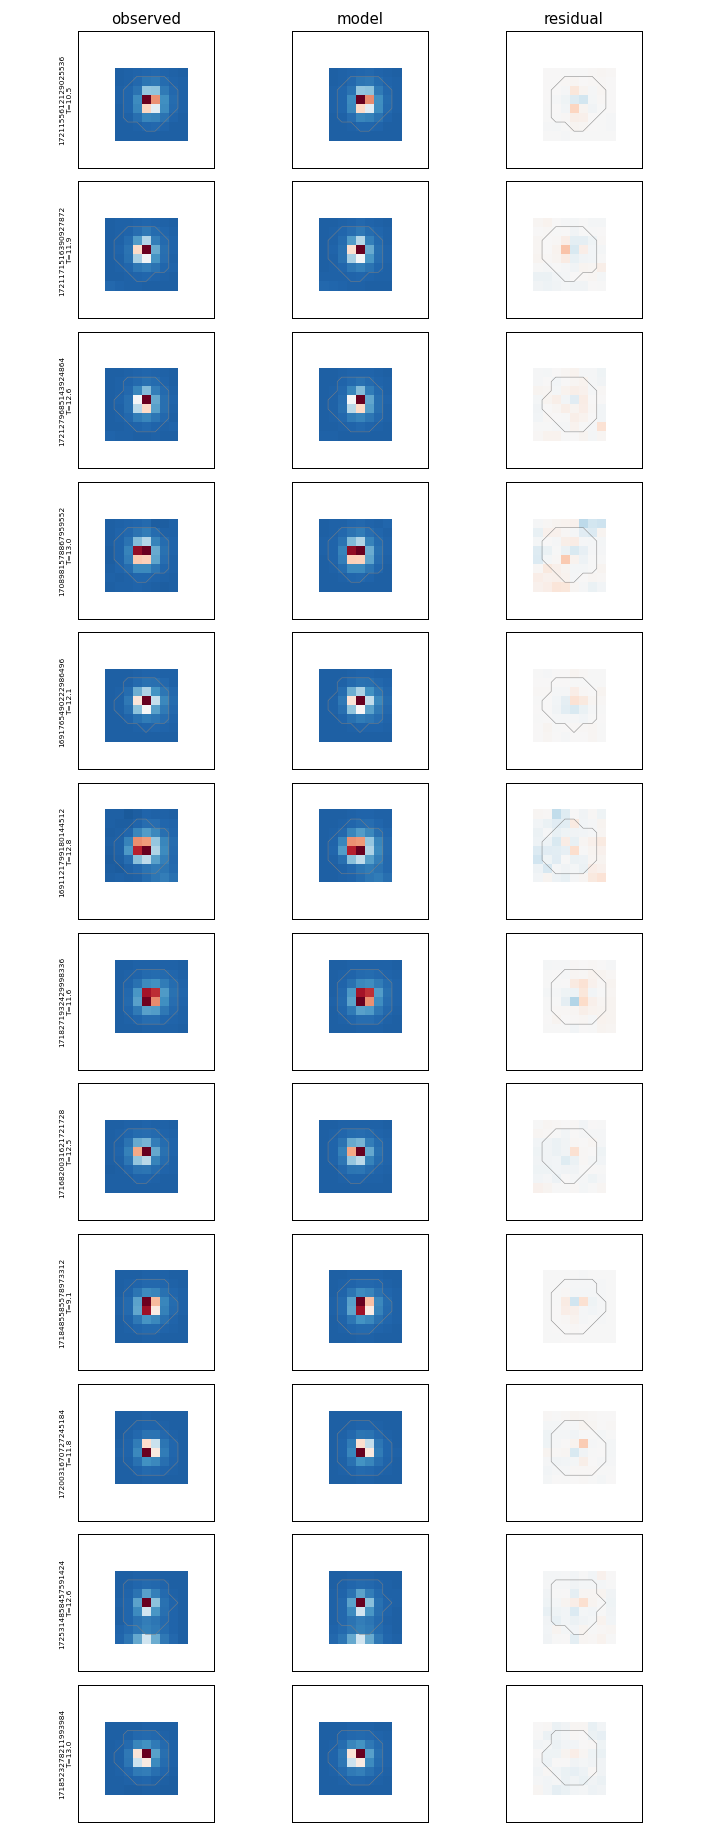
Draft caption
- Native-pixel Gaussian centres of observed and summed-model stamps for strict held sources on identical support. Frozen PSF/WCS, test-scene photometric nuisance fitting; single Sector20 C3/CCD3 exposure.
- Show typical residuals, signed spatial structure, radius/background sensitivity and crowded/partially masked tails. Noise-only Gaussian controls test a narrower model than the real data.
- This closes specific same-image and source/pixel-holdout confounds, while independent centre truth, temporal transfer and all-camera validation remain open.
Counts, controls and failure accounting
- All1720 saved strict-held fold0 sources tested; primary radius3 constant-background1689 accepted,31 bound-limited or nonconverged. Compute126.5seconds before figures, one BLAS/OMP thread. No retraining.
- Direct audit against the frozen fold's
held_pixel_mask.npy: zero fitting-support violations across all1720 native masks, including the effective-origin radius3 support. No mask intersection was needed, no results changed. Reproducible assertions now enforce this in the script.all_fold0/held_support_audit.jsonrecords the independent check. - Native recovery maximum relative discrepancy1.095e-7; exact Gaussian shift controls maximum error9.20e-11px.
| Primary population | Accepted pairs | Median [mpx] | 90th percentile [mpx] | Vector RMS [mpx] |
|---|---|---|---|---|
| All accepted | 1689 | 5.263 | 11.635 | 26.791 |
| Isolation control | 1126 | 5.503 | 11.421 | 8.529 |
| Full aperture support | 1502 | 5.219 | 11.227 | 10.752 |
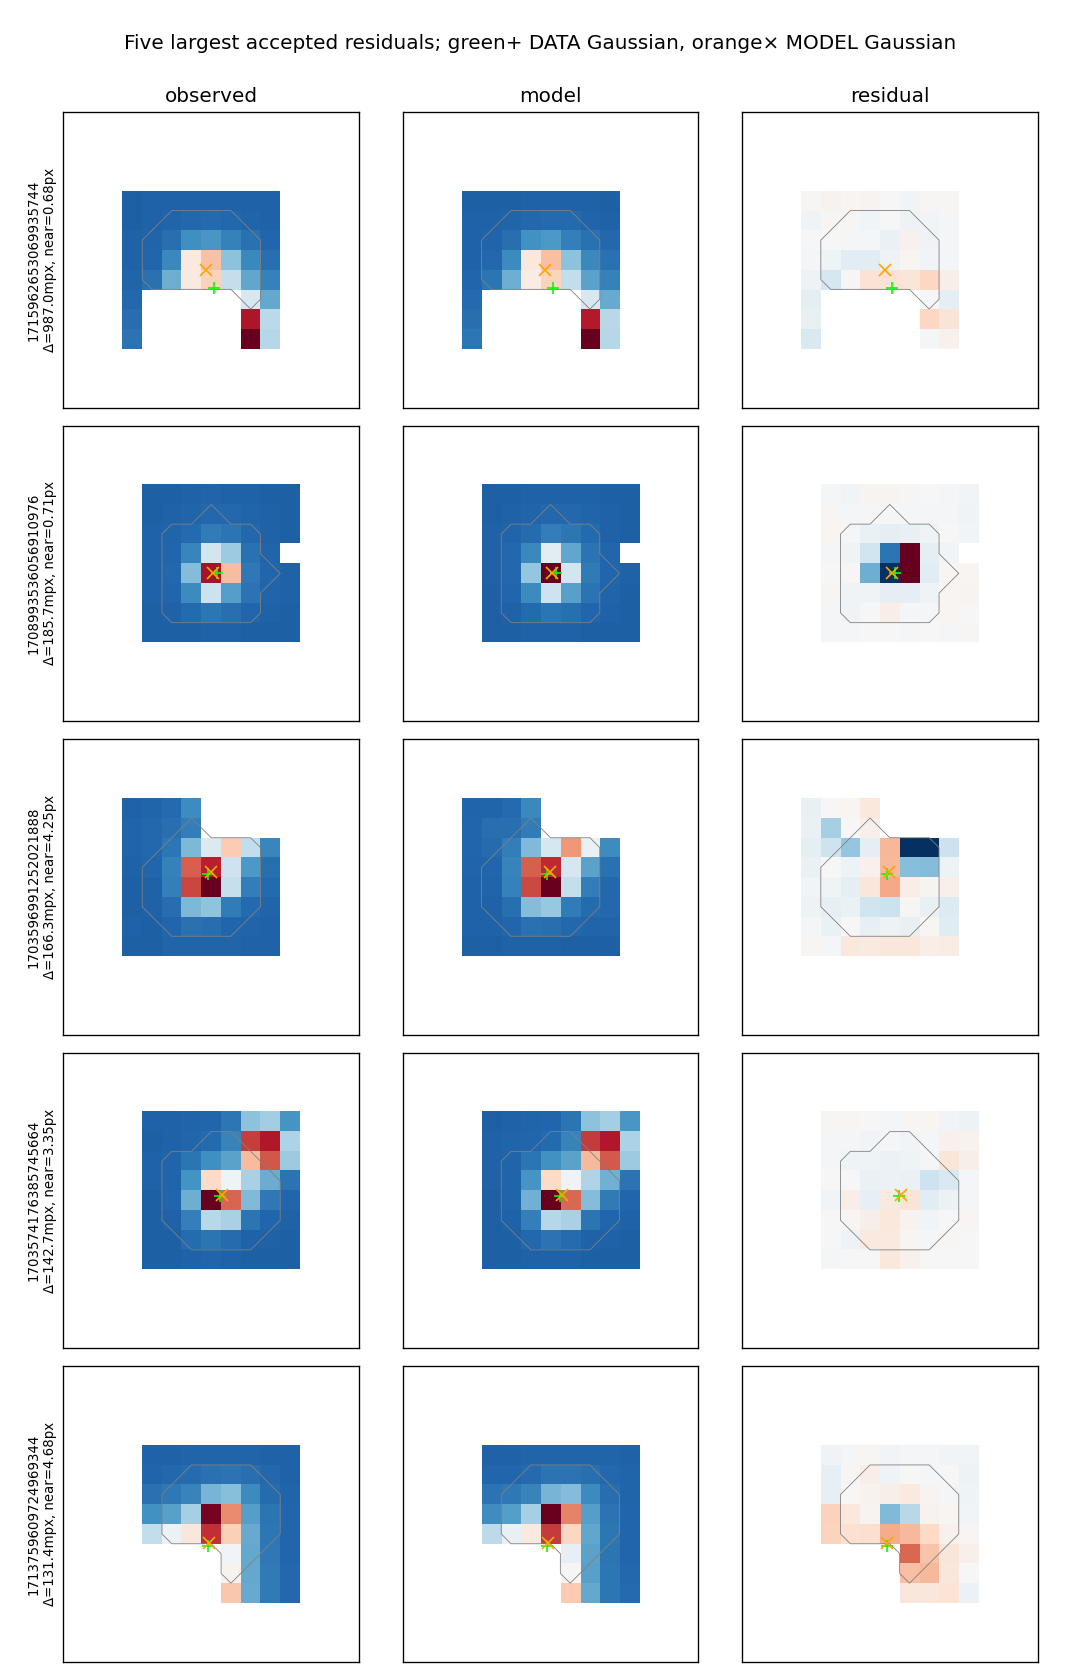
- Long tails matter:16 accepted residuals>40mpx,14>50mpx,5>100mpx. Four of14>50mpx still pass the catalogue-isolation criterion. All five>100mpx fail isolation; three have incomplete aperture support. No sigma clipping or residual-dependent rejection was used.
- Largest accepted displacement987mpx: neighbour separation0.683px and79.3% aperture support; the single-Gaussian approximation is unsuitable in this strongly blended/masked case. The five largest residuals are shown explicitly in
outlier_stamps.png/pdfwith DATA/MODEL Gaussian markers. They remain in the all-accepted RMS. - Common successful-source sensitivity population1295: radius2 constant, radius3 constant, radius3 plane respectively have median5.249/5.182/5.159mpx and RMS8.428/10.843/7.982mpx. This matched population is smaller than the full primary set; do not claim its lower RMS as an improvement on identical1720-source coverage.
- Same1689 accepted-source Gaussian noise proxy: median1.033mpx, RMS1.872mpx. Real-image residuals are broader than this simple synthetic-noise control. This does not uniquely identify WCS error, since real shape, background, blending and model uncertainty were omitted from the proxy.
- Spatial cells have122–243 accepted sources. Their signed coordinate medians range roughly−2.0 to+1.3mpx; these are coherent estimator residuals in one exposure, not independent accuracy estimates or significance detections. Full cell/colour/magnitude counts and signed summaries are in binned_signed.csv.
Subsection outline — bullet points only
Orbital WCS and stellar positioning — working outline
- Updated 2026-10-15; bullet outline only, replacing full manuscript text as the active presentation.
- Working title: Orbital evolution of the TESS focal-plane mapping: physical contributions and limits to stellar positioning.
- Main question: which observed changes are predicted by known physics, which are conditionally described by telemetry, and what positional accuracy is independently demonstrated?
- Terminology: measured displacement ≠ prediction error ≠ absolute position error; empirical correction ≠ established physical cause.
- Figure numbers below retain the existing six-figure plan; supplementary panels can be linked beneath each figure on the webpage.
1. Motivation and scope
1.1 Why orbital image motion needs explanation
- Science-camera guide-star centroids feed spacecraft pointing control; apparent guide fields change with observer velocity.
- Optical/distortion evolution and attitude changes both affect the same stellar positions.
- Existing literature establishes aberration and guiding mechanisms; novelty must come from observed decomposition and independent positional validation.
- Pointing knowledge, closed-loop stability, long-exposure motion and WCS accuracy are different observables.
1.2 What this study claims
- Sector 20 header-WCS characterization across four cameras and sixteen CCDs.
- Deeper centroid/profile tests on C3/CCD3 with explicitly narrower image and temporal coverage.
- Candidate conditional physical/thermal correction, with startup and endpoint failures retained.
- Accurate positions remain a measured validation objective; no blanket all-CCD precision claim from a one-frame pilot.
2. Data and measurement definitions
2.1 Input identity and reference frames
- Freeze cadence, exposure-time convention, velocity reference, catalogue epoch/proper motion and image generation.
- Distinguish full-FFI, crop-local and PSF-profile coordinates; preserve source IDs.
- Record Moon-contaminated/flagged intervals and actual camera availability.
- Historical mixed catalogue epochs: retain as a diagnosed limitation; use a corrected new generation for accuracy tests.
2.2 What a stellar position means
- Separate fitted PSF origin, Gaussian-defined profile centre and catalogue-to-detector WCS.
- Include explicit chromatic displacement; reference colour is not necessarily zero shift for centred quadratic colour terms.
- Define fixed Gaussian support, weighting and background treatment before comparing models.
- Distinguish native-pixel Gaussian fits from Gaussian fits to dense effective-profile samples.
2.3 Validation populations
- Label header probes, fitted stars, held-source stars, held pixels and held time blocks separately.
- Hold source/neighbour regions out of initialization and model fitting; retain exact existing
held_fixedcontracts where applicable. - Keep same-source comparisons on fixed pixel support and one image generation.
- Report spatial/colour/brightness/phase coverage and correlated uncertainty; do not convert ensemble scatter into absolute accuracy.
3. Physical and empirical description of orbital motion
3.1 Observer velocity and common attitude
- Compute aberration using Earth plus spacecraft velocity; identify sign and reference conventions explicitly.
- Show measured and predicted spatial vector fields before reducing them to RMS.
- Fit or measure the common attitude and label it as supplied information.
- Figure 1: full focal-plane motion, physical velocity contribution and remaining field.
3.2 Guiding response and what is identifiable
- Use literature to motivate aberrated guide-field tracking and guide-camera selection effects.
- Compare common rotation with camera-relative spatial modes.
- Do not identify fitted effective guide weights with actual onboard weights.
- Resolve commanded-attitude/quaternion references before treating telemetry as independent truth.
- Supplement to Figure 1: guiding timeline and control-loop schematic, labelled literature versus flight-data inference.
3.3 Thermal association
- Separate scale, shear and higher-order changes from global pointing.
- Compare time-only and temperature-informed models on the same support.
- Show sensor histories alongside the measured spatial mode.
- Distinguish conditional temperature slope from a material expansion coefficient.
- Figure 2: thermal histories, withheld distortion-error curves and matching spatial prediction-error maps.
3.4 Beginning and end of orbit
- Test whole endpoint intervals with an explicit training buffer.
- Distinguish large accumulated displacement from poor prediction.
- Treat startup thermal history, changing gradients, guiding and measurement bias as competing explanations.
- Retain the separate orbit-48 startup analysis for cameras 2–4.
- Figure 3: separate pointing predictions and startup limits; Figure 2 contains the distortion errors.
4. Measurement-convention controls
4.1 Saved ePSF origin conversion
- Apply a coordinate conversion to saved profiles; preserve predicted pixels rather than retraining.
- Show actual profiles and Gaussian residuals with the inferred spatial correction.
- Test support sensitivity and pathological profiles explicitly.
- Figure 4: original versus Gaussian-origin endpoint motion and its profile evidence.
4.2 Temporal estimator consistency
- Compare legacy and trained positions on fixed stars across the historical temporal coverage.
- Separate static differences, frame translations, cell structure and individual-star scatter.
- Flag shared initialization, training membership, crop coverage and historical catalogue epoch inconsistency.
- Figure 5: temporal consistency tracks plus per-star fields and image stamps; not absolute accuracy.
5. Toward independently accurate positions
5.1 Same-image pilot
- Show only the verified pilot's actual source count, image generation, heldout status and spatial footprint.
- Compare explicit common-centre estimators on identical images and pixels.
- Show data/model/residual stamps, signed position vectors and uncertainty.
- State whether results test estimator consistency, injection recovery or independent predictive accuracy.
- Figure 6, development: same-image positional pilot; unmeasured endpoint/all-camera extensions visibly marked.
5.2 Accuracy completion test
- Extend the validated procedure to reserved startup/interior/end frames in both orbits.
- Compare a simple affine baseline, current mapping and physical/thermal correction on identical reserved observations.
- Derive any permitted registration on training stars only; keep absolute and translation-removed scores separate.
- Fix acceptance tolerance before final testing; report coherent mode bounds, tails and measurement/catalogue uncertainty.
- Match claim coverage to tested CCDs; one CCD per camera does not certify sixteen CCDs.
6. Explanation, remaining ambiguity and paper boundary
6.1 What is explained
- Known velocity-aberration physics supplies a testable spatial prediction.
- Measured attitude removes common motion but is not itself a predictive physical explanation.
- Temperature adds conditional predictive information; Gaussian recentering does not remove the tested bulk startup evolution.
- Summarize component status using EXPLANATION_LEDGER.md.
6.2 What would discriminate remaining causes
- Matched-temperature warming/cooling and component-gradient contrasts.
- Independent camera-contrast/attitude test with verified quaternion conventions.
- Frozen-model test on a preselected second thermal/guiding regime.
- Common-image held-source positioning with corrected catalogue epochs.
6.3 Scope and conclusion bullets
- Paper 1 retains single-image de-crowding/chromatic ePSF fitting; cite rather than duplicate that novelty.
- This paper owns orbital mapping evolution and independently tested positional correction.
- Paper 2 retains temporal photometry, detrending and astrophysical signal preservation.
- Claim only the calibrated domain and supported physical attribution; unresolved startup terms remain a documented result.
What is explained, modeled, or still unresolved?
Explanation ledger — measured motion, prediction and physical cause
- Updated 2026-10-15; evidence classification, including the new one-exposure same-image held-source pilot.
- Measured: an observed image or coordinate-product signal exists; identify which.
- Predicted: a specified model predicts observations excluded from the relevant fit; record supplied attitude or other nuisance information.
- Cause established: independent evidence distinguishes the mechanism from alternatives; established theory alone does not prove a complete flight-data attribution.
| Component | Measured in current work | Predicted? | Cause established? | Next discriminating evidence | Figure |
|---|---|---|---|---|---|
| Differential velocity aberration | All-camera header displacement fields | Physical Earth + spacecraft velocity calculation reproduces leading structure after declared attitude treatment | Mechanism established in physics and TESS literature; completeness of this decomposition remains conditional | Independent stellar spatial modes and frozen velocity/time conventions | 1 |
| Common attitude / pointing | Header-derived common rotation; candidate quaternion comparisons | Measured attitude supplied to distortion fits; empirical guide/velocity models tested separately | No unique recovery of onboard guide weights or commanded attitude | Quaternion reference closure and a camera-contrast prediction independent of fitted common field | 1, 3 |
| Guide-camera membership effects | Mission configuration evidence and differing orbital conditions | Plausible models, not a complete independently validated controller reconstruction | General mechanism established; specific residual attribution open | Configuration/time alignment plus predicted relative-camera signature | 1 supplement |
| Temperature-associated spatial distortion | Residual modes and telemetry histories | Conditional withheld-time improvements over time-only baseline | Association supported; individual mechanical origin not isolated | Matched-temperature history/gradient test and reserved different thermal regime | 2, 3 |
| Startup residuals | Coherent beginning-of-orbit evolution in coordinate fields | Existing thermal/pointing predictors leave harder startup errors | Open: thermal history, guiding and estimator bias remain alternatives | Common-image endpoint positions, spatial mode signatures and independent attitude constraints | 3 |
| Orbit-ending drift | Accumulated residual mapping changes and smooth telemetry evolution | Existing conditional models predict endings better than startup | Thermal contribution plausible; full causal budget unclosed | Same independent endpoint checks; distinguish amplitude from predictive error | 2, 3 |
| Saved ePSF origin evolution | Actual C3/CCD3 saved profile centres | Deterministic coordinate conversion; numerical inverse checked | Mathematical convention effect established for the saved model | Broader real-image same-centre checks; no retraining needed to repeat the conversion | 4 |
| Native pixel-phase/profile bias | Small observed-image and sampled-profile controls | Saved profiles predict part of estimator differences on limited support | Sampling mechanism supported conditionally; residual image biases unresolved | Independent profile-family injections and fixed-position/changing-shape controls | 4 supplement, 6 |
| Chromatic position displacement | Modern single-image fit has explicit colour shifts; historical gauges differ | Model-dependent, single-image conditional evidence | No universal colour-independent centre or causal optical decomposition | Common-colour reference and same-image held-source residuals by colour | 5 supplement, 6 |
| Catalogue epoch/preparation error | Mixed historical epochs identified in frozen temporal bundle | Known propagation can predict coordinate shifts; historical causal preparation path not proven | Input inconsistency established, complete impact attribution pending | New corrected evaluation generation preserving source IDs and old record | 5, validation appendix |
| Legacy–trained temporal disagreement | Fixed-source historical temporal comparison | Consistency comparison, not out-of-training prediction | Cannot assign discrepancy to one estimator as truth | Independent initialization and common-image/source-heldout evaluation | 5 |
| Same-image held-source agreement | One interior C3/CCD3 exposure; native observed/model stamps and strict held-pixel support audited | Frozen PSF/WCS; photometric nuisance fluxes fitted on test data | Conditional estimator agreement, not an absolute truth test | Repeat on reserved orbital endpoints, other detectors and independent profiles | 6 |
| Absolute stellar position accuracy | Not certified by present comparisons | No blanket all-camera accuracy result | Open | Propagated catalogue/colour budget plus independent image estimator and reserved sources | 6, pending extension |
| Jitter within exposure | Literature establishes relevance; current mean-WCS analysis does not recover its full history | Not fully tested here | Possible profile/centroid contribution, not an established explanation of every slow mode | Exposure-aligned jitter/profile diagnostics if a residual signature specifically demands them | Appendix / future test |
| Light-curve consequences | Not established by current positional comparisons | Shared-profile sensitivity tests only, where available | No light-curve precision or signal-preservation claim | Paper 2's independently validated temporal photometry | Outside core paper |
What not to combine into one “fraction explained”
- Header-WCS regression error, C3/CCD3 centroid-WCS motion, ensemble estimator disagreement and single-star errors have different denominators and populations.
- Measured-attitude subtraction is information supplied from the observations; its removed variance is not telemetry-only prediction skill.
- Gaussian-origin conversion is a deterministic change of coordinates; its amplitude is not independent physical motion removed.
- Static source offsets removed by temporal centering cannot contribute to an absolute-accuracy claim.
- A pilot at one exposure cannot supply an orbit-start/end error budget or full-CCD coverage absent actual tests there.
- A lower thermal regression residual does not uniquely apportion variance to heat when temperature and time covary.
Reviewer-facing completion logic
- Relative correction claim: common image generation and origin, corrected catalogue epochs, source/pixel-independent initialization and fitting, reserved observations, and calibrated uncertainty below a predeclared tolerance over the claimed domain.
- Physical explanation claim: mechanism predicts a distinct spatial/temporal signature; alternatives tested; reserved thermal/guiding regime verifies the prediction or sets a stated boundary.
- All-camera / all-CCD claim: coverage ledger distinguishes header characterization from direct stellar validation; no extrapolation from the current central temporal crop or single-frame pilot.
- Permitted bounded conclusion now: known aberration and measured attitude account for leading field evolution, telemetry improves a conditional empirical model, and the tested saved-profile origin conversion does not remove bulk startup motion; complete startup attribution and independently certified positions remain open.
Next tests needed for a physical WCS paper
- Repeat the validated native-pixel comparison on reserved first/interior/last exposures in both orbits, using a consistent propagated catalogue and centre definition.
- Measure coherent spatial residual modes, with neighbours/background and source/pixel holdout controlled; compare against affine and time-only baselines.
- Test thermal gradients and warming/cooling histories against distinct spatial predictions; verify quaternion/commanded-attitude conventions before attributing common motion.
- Expand independent stellar validation to the cameras/CCDs claimed, then test a frozen different regime or restrict the conclusion to Sector20.
Conclusion: the leading velocity contribution is physically grounded, but supplied attitude, conditional thermal prediction and centroid conventions are different kinds of explanation. Startup attribution and independently certified orbital positioning remain open.
Onboard-pointing literature review · Nguyen et al. (2018) · Reference bibliography · Caption notes