1. Both starts and endings remain explicit
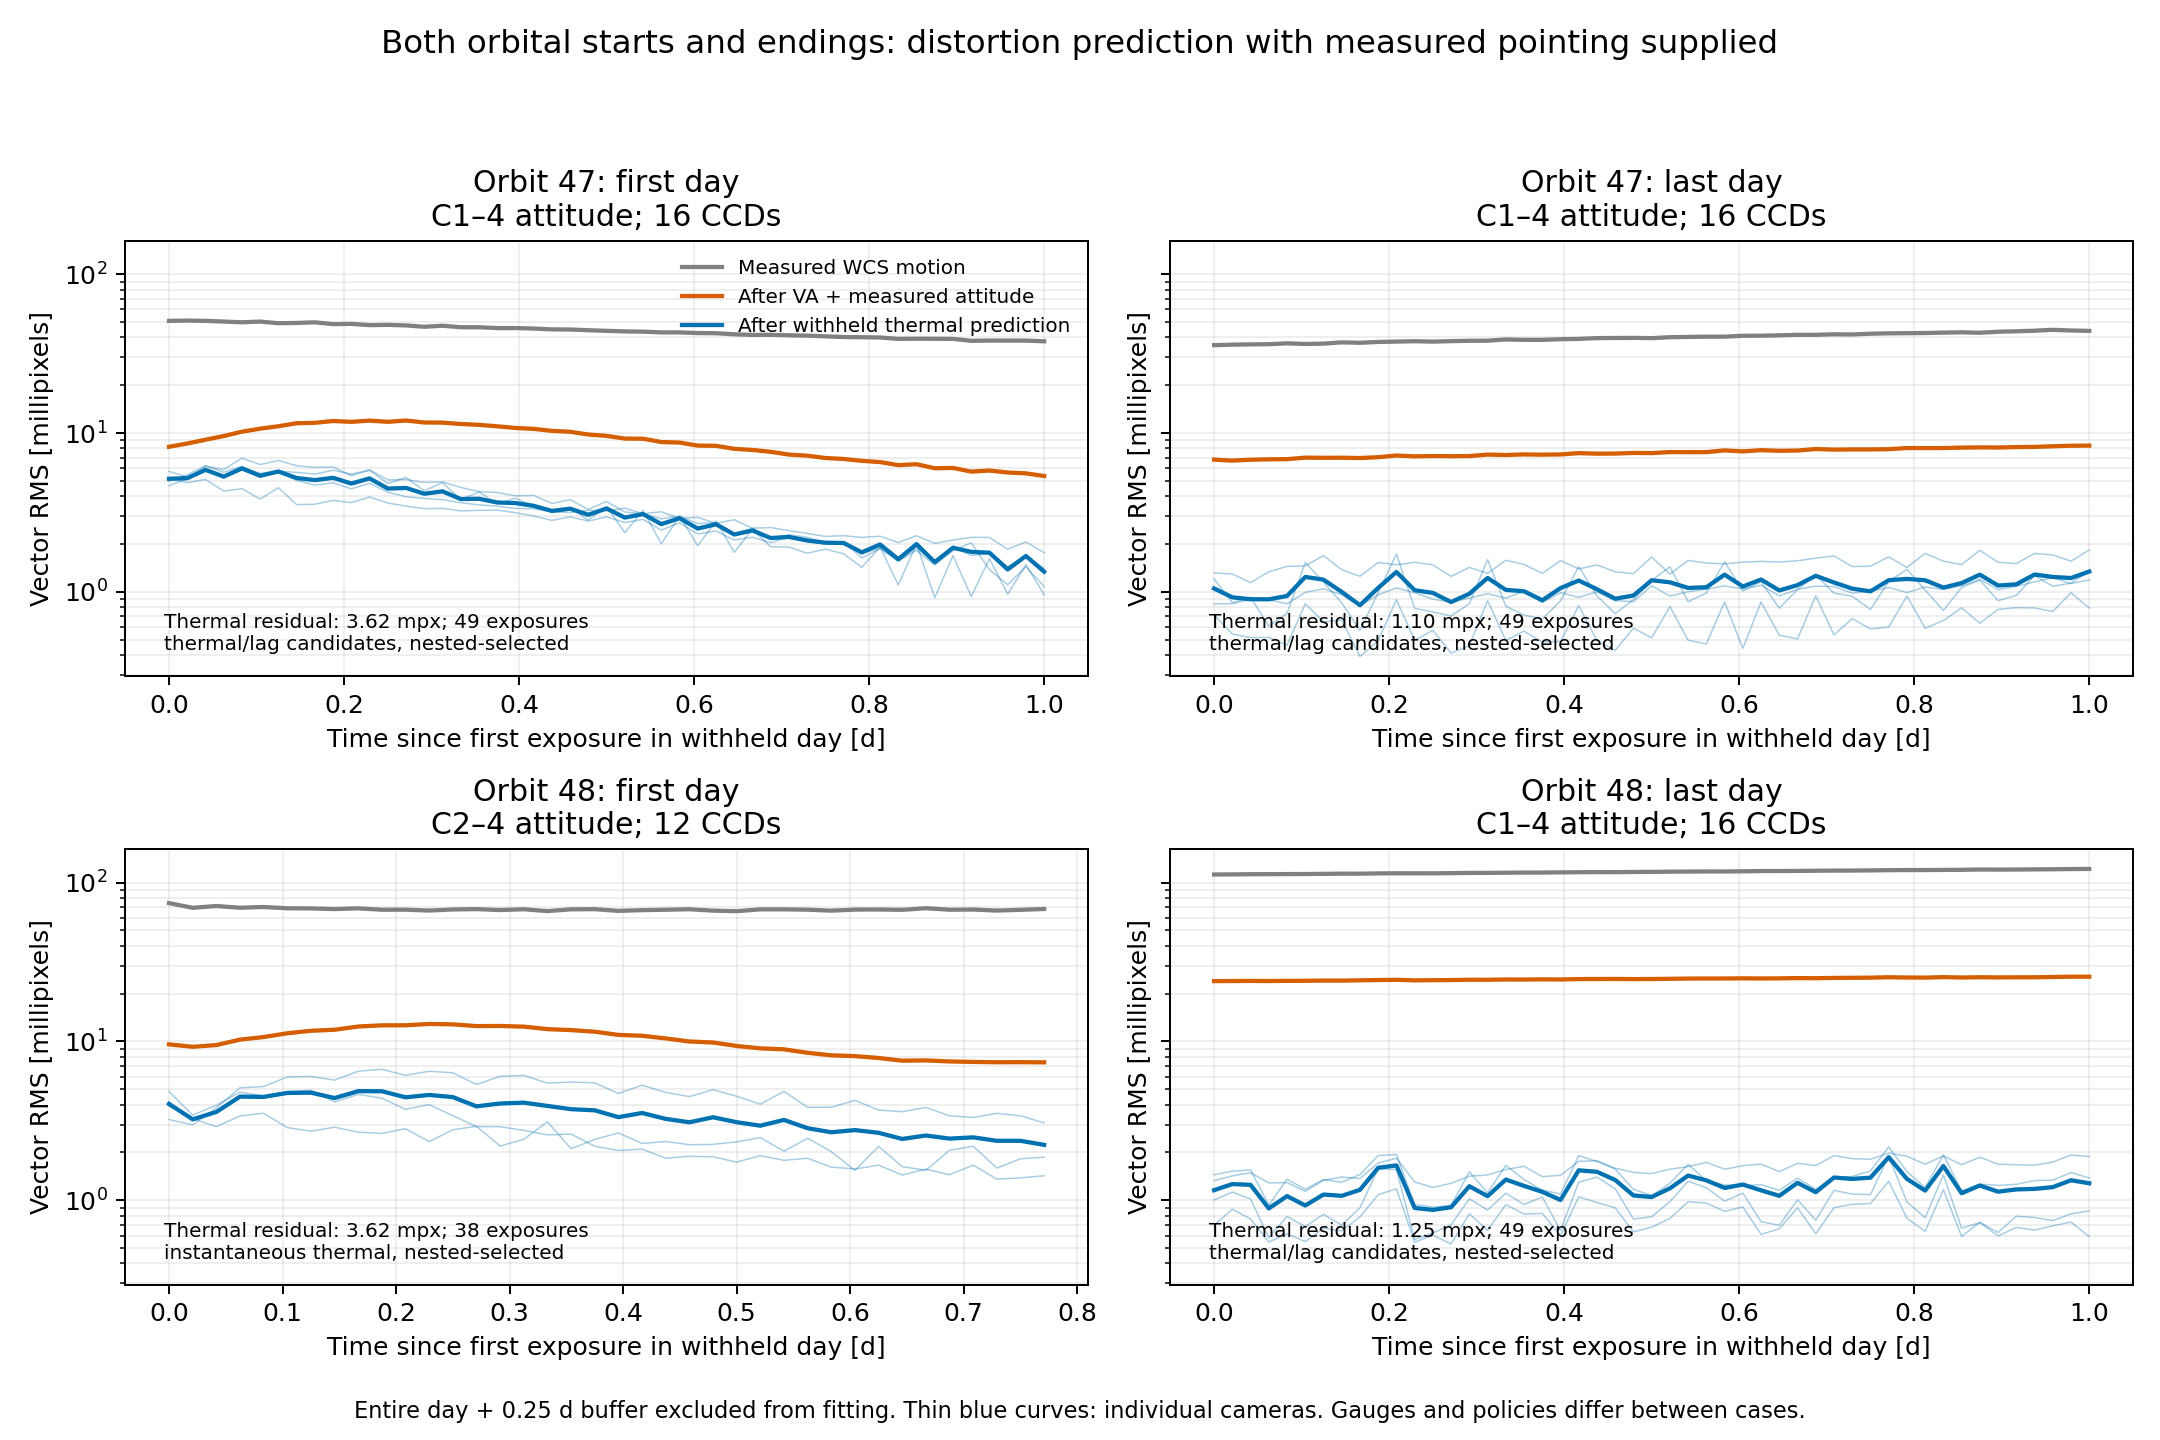
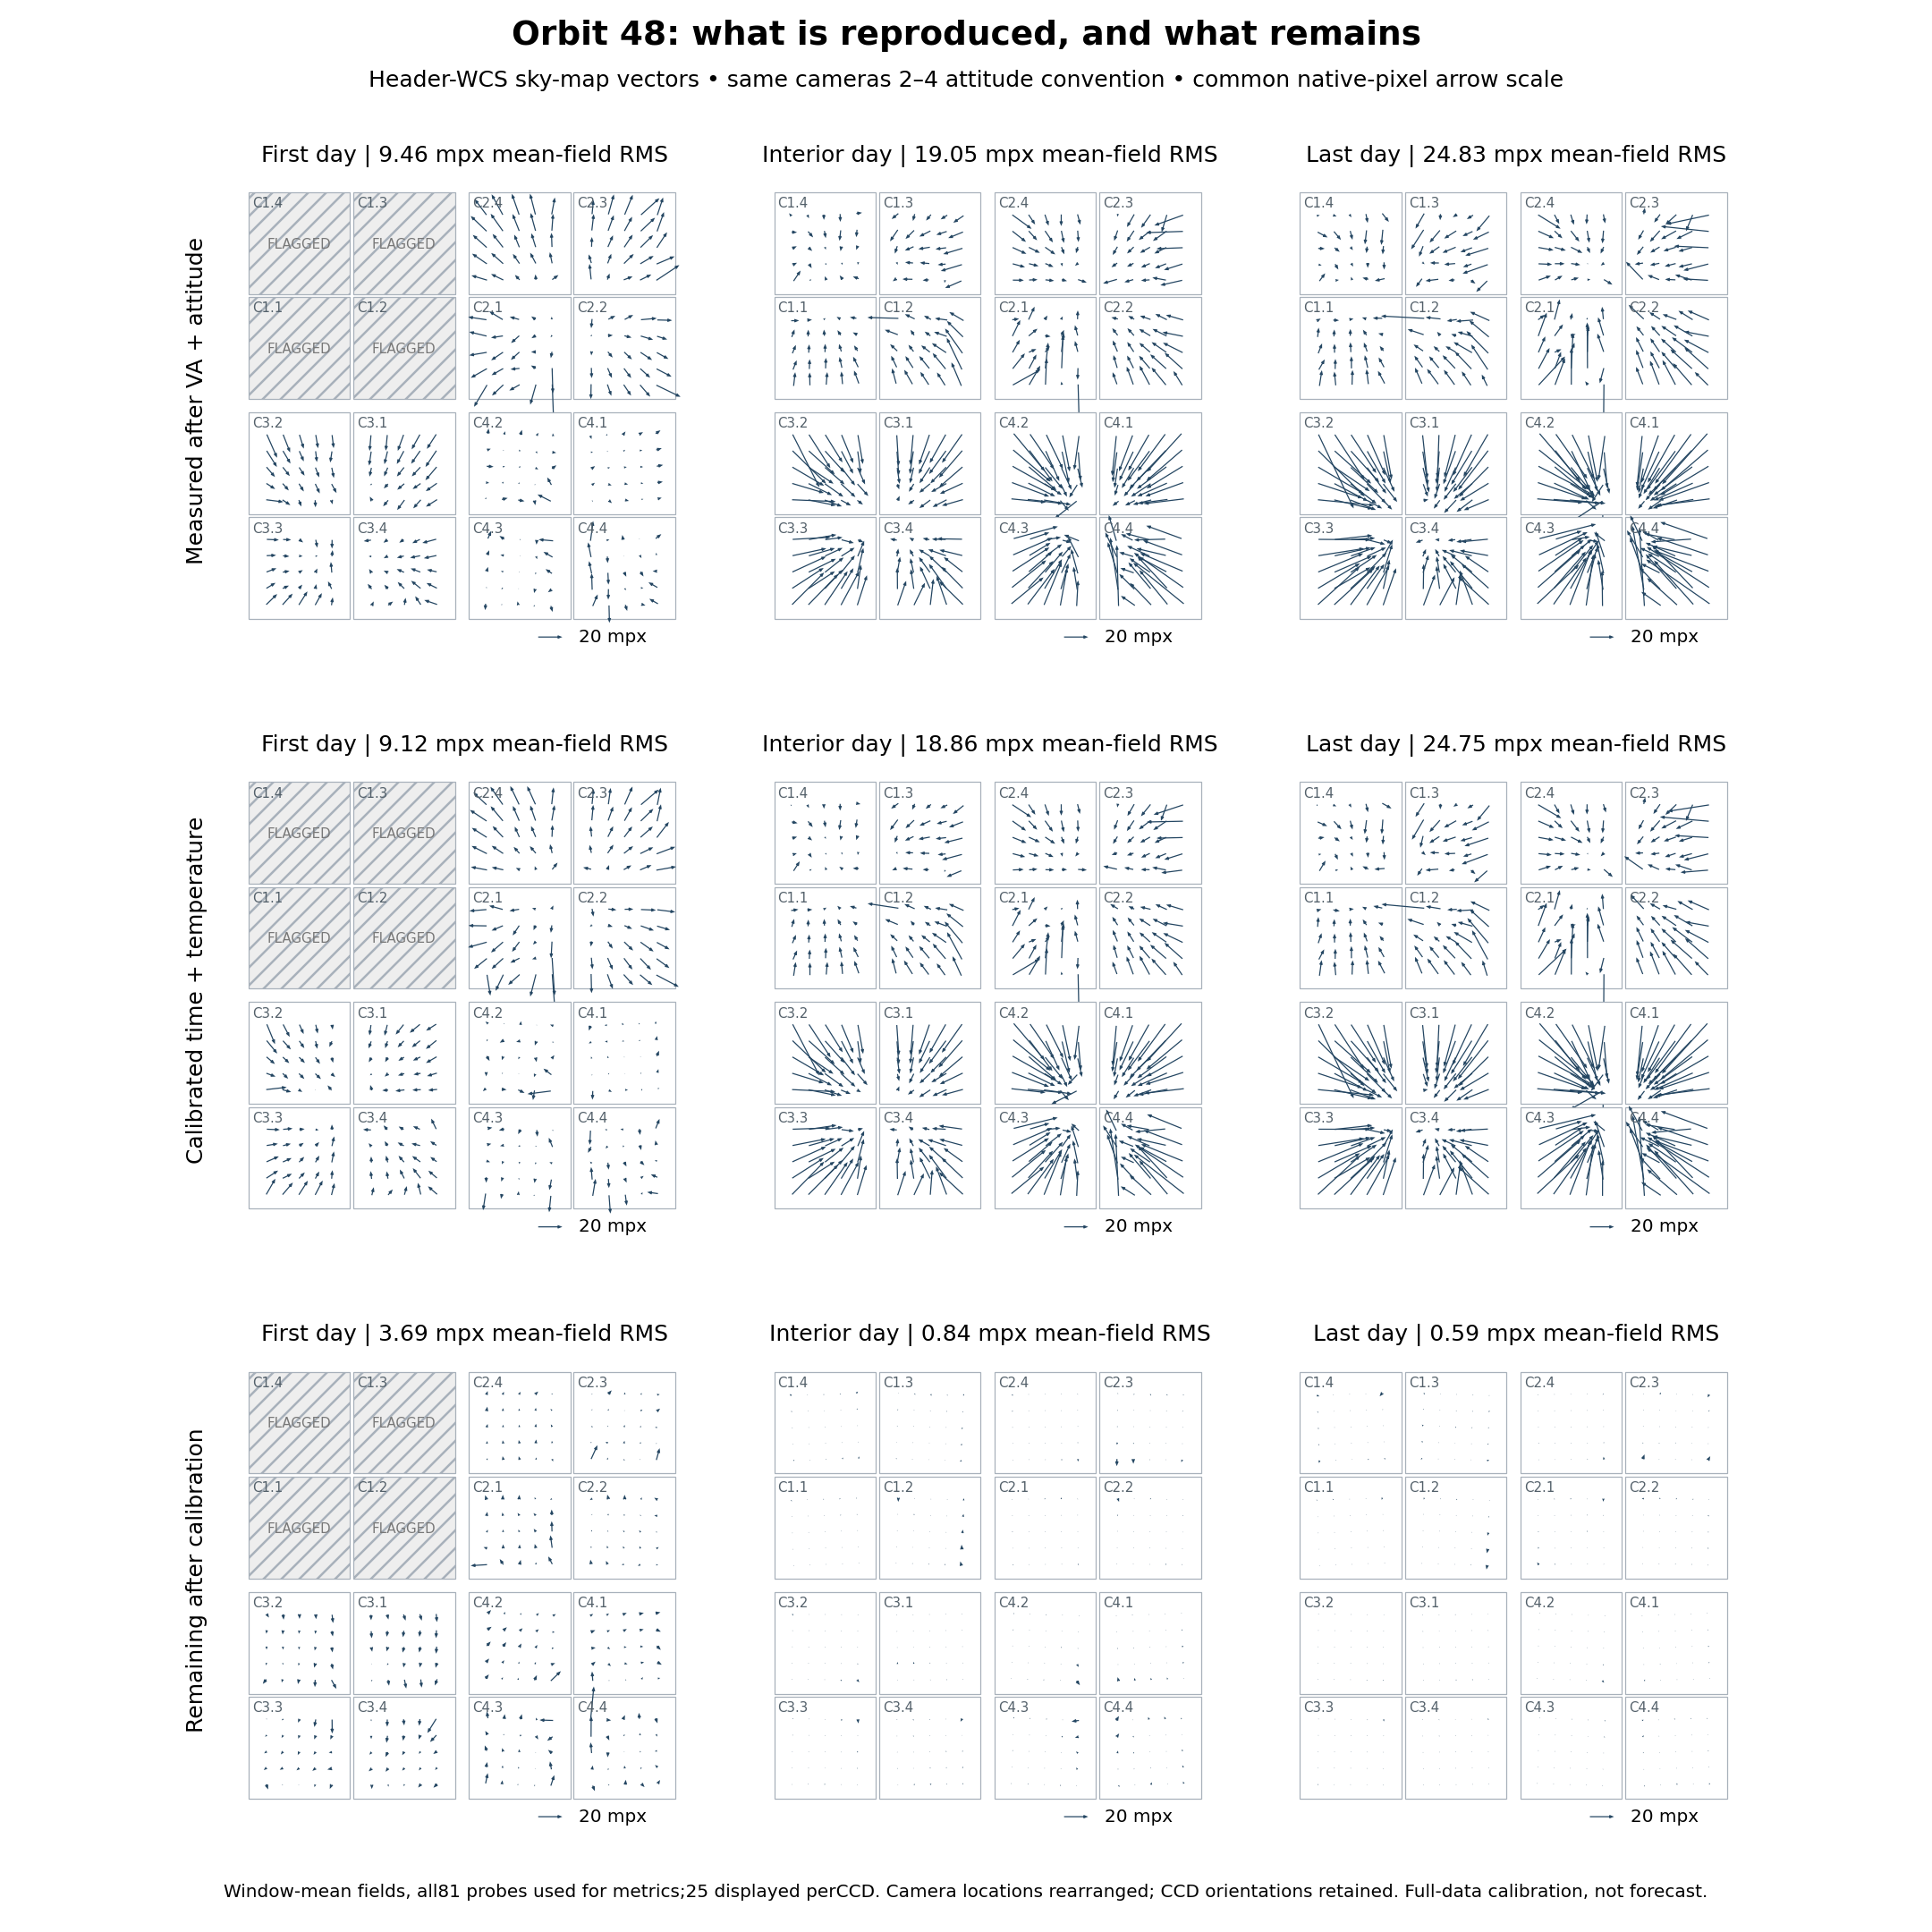
Three panels use the archived nested-selected thermal/lag policy and all-camera attitude. Orbit48 startup uses its separately archived instantaneous model and cameras2–4 attitude. Camera1 is flagged there. These are different policies/supports, not one homogeneous benchmark. All scores are 2D vector RMS; 1mpx=0.001 native detector pixel.
| Window | Exposures | CCDs | After VA + measured attitude [mpx] | Thermal prediction error [mpx] |
|---|---|---|---|---|
| o47_first | 49 | 16 | 9.203 | 3.625 |
| o47_last | 49 | 16 | 7.553 | 1.099 |
| o48_first | 38 | 12 | 10.294 | 3.624 |
| o48_last | 49 | 16 | 24.781 | 1.246 |
Interpretation: coherent startup errors remain in both orbits. Small ending errors do not prove a complete physical or autonomous pointing model.
2. Does scale track temperature?
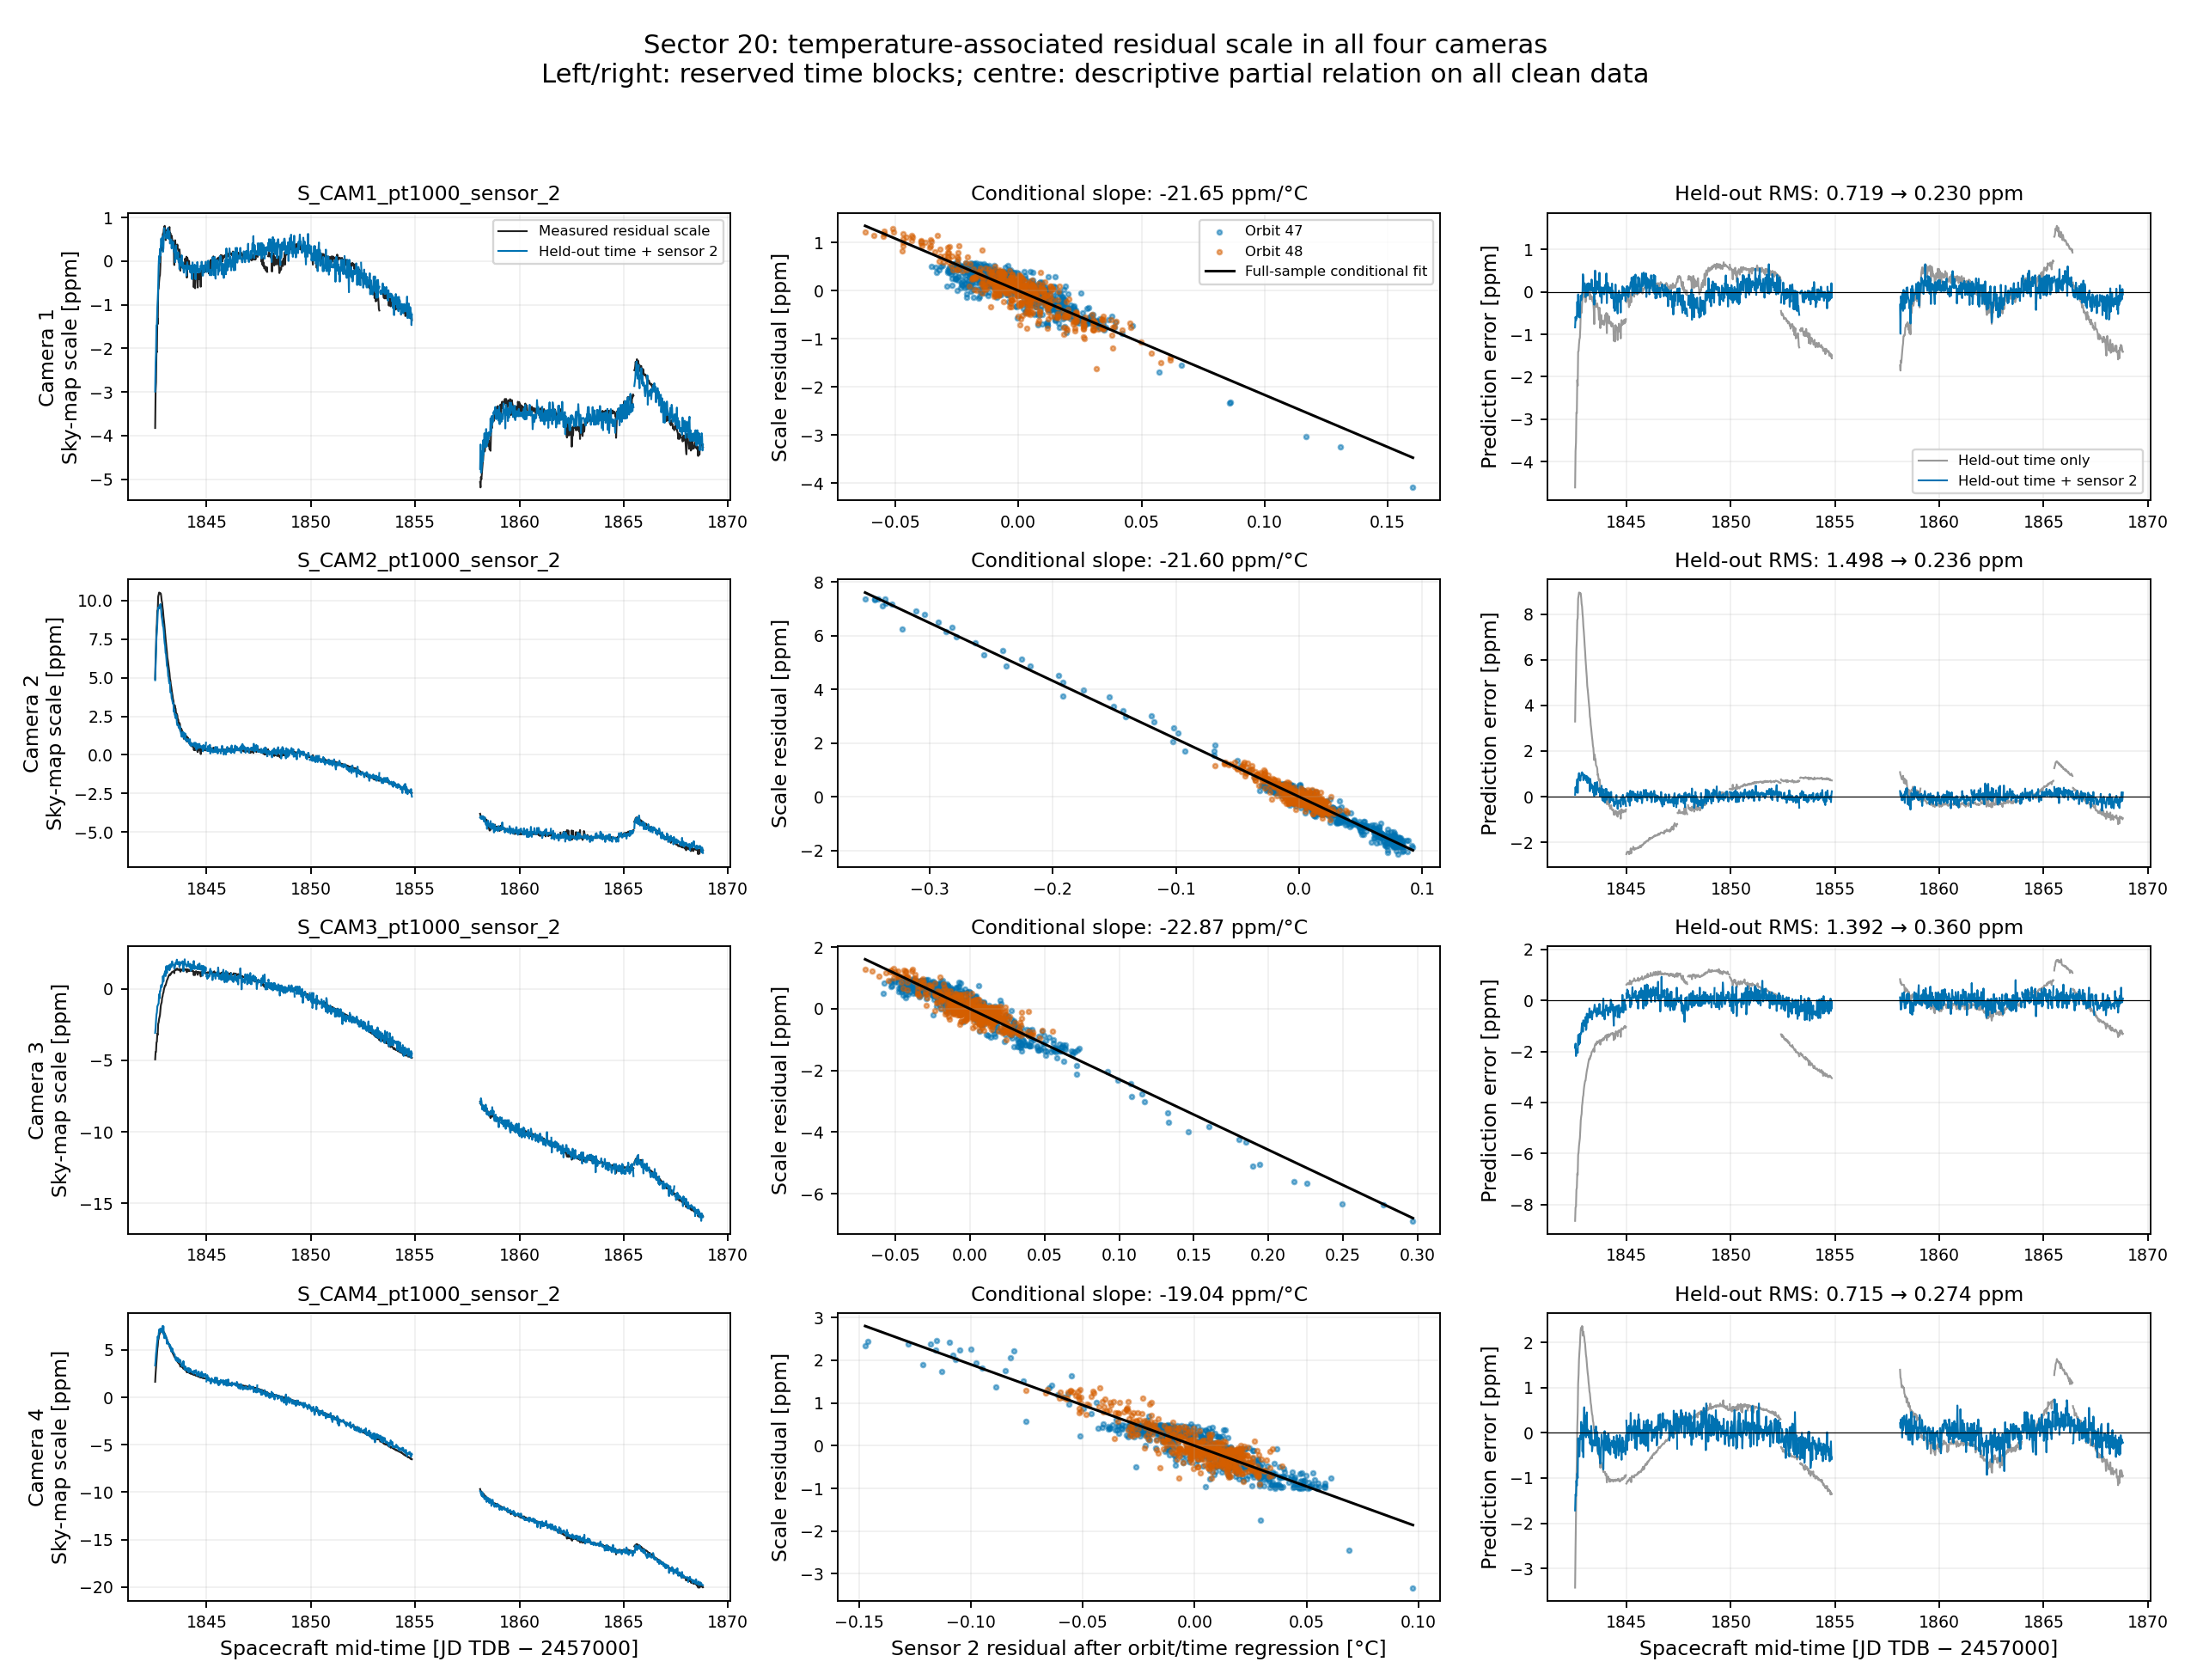
- Sensor2 supplies predictive information beyond orbit-specific linear time in all four cameras. Conditional slopes are −19.04 to −22.87ppm/°C in this sky-map convention.
- These are effective mapping coefficients, not material expansion coefficients. Inverse plate-scale definitions reverse the sign.
- Ten sequential blocks with a0.25day buffer reproduce the archived analysis on1100 clean exposures. It is a scalar scale test, distinct from full-field endpoint prediction.
- Numeric sensor IDs avoid overstating component identity. The source descriptions and physical interpretation are below.
Underlying measured, calibrated and remaining spatial fields
3. Do temperatures at different camera parts explain more?
- We tested nine fixed feature families: time only; mean sensors2–5; extra sensor differences; all components; their contrasts; contrasts with rates; and contrasts with a12h causal history state.
- Test days plus0.25day buffers are excluded; ridge selection uses six training-only inner folds. These previously examined endpoints are exploratory comparisons, not untouched final validation.
- “Barrel” in these plots means mean PT1000 sensors2–5; “gradient” means sensor2−sensor5, a temperature difference without a physical distance normalization.
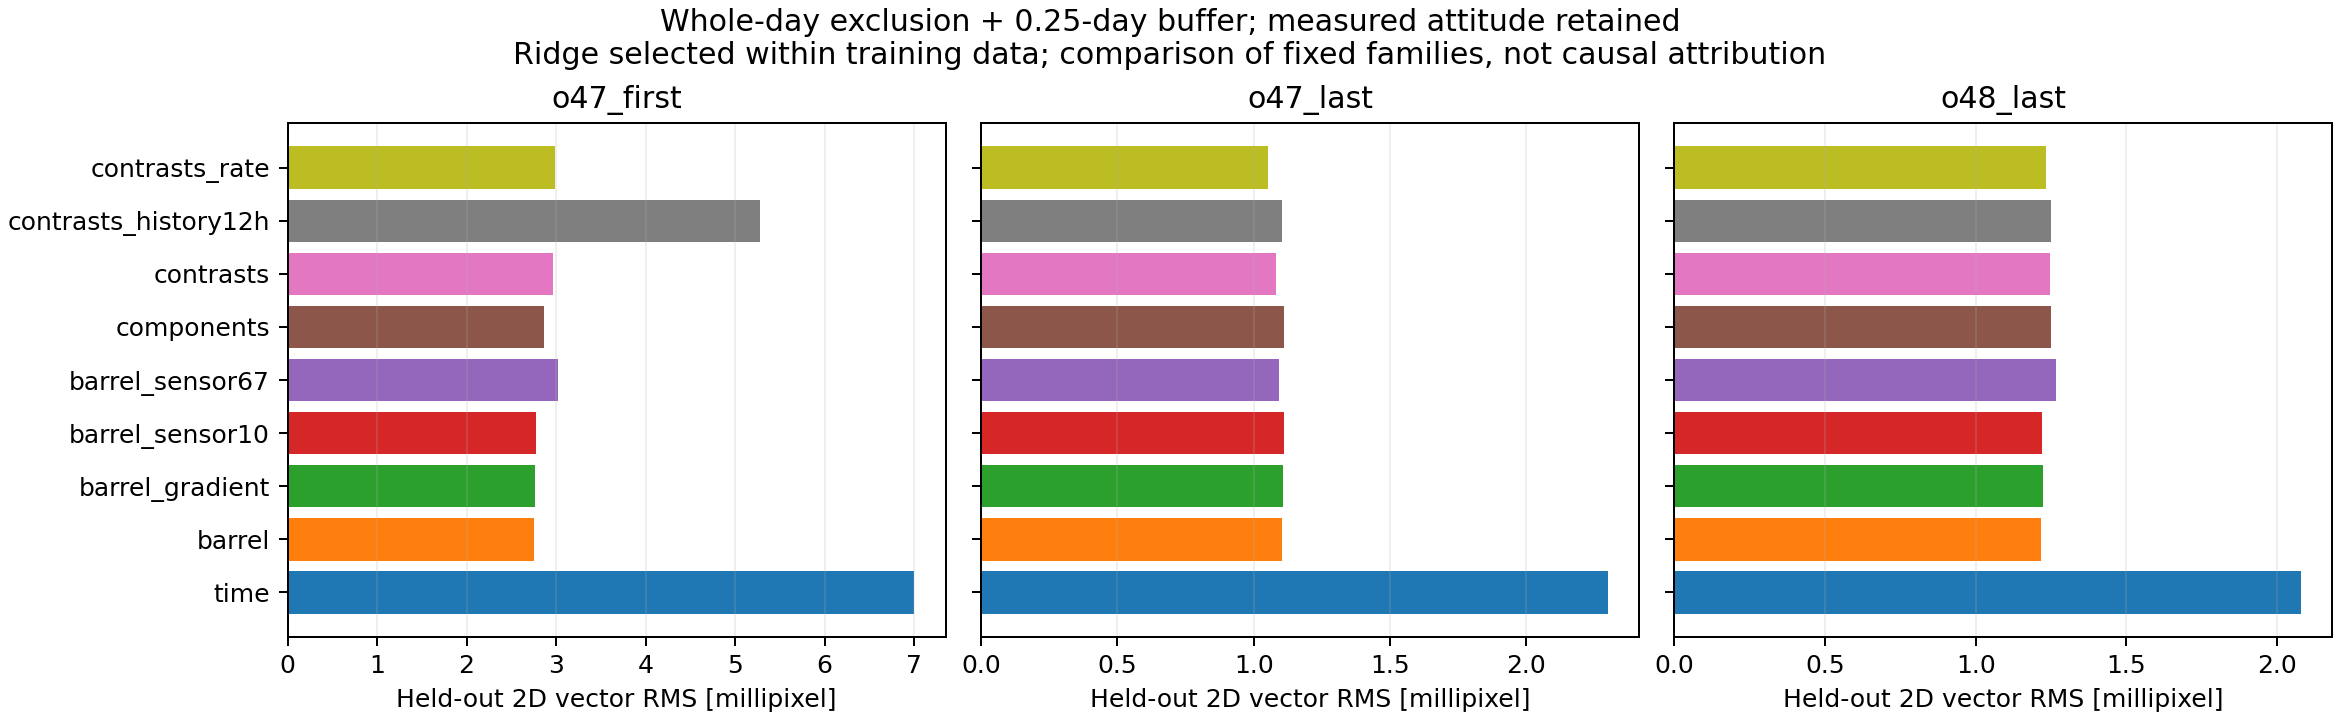
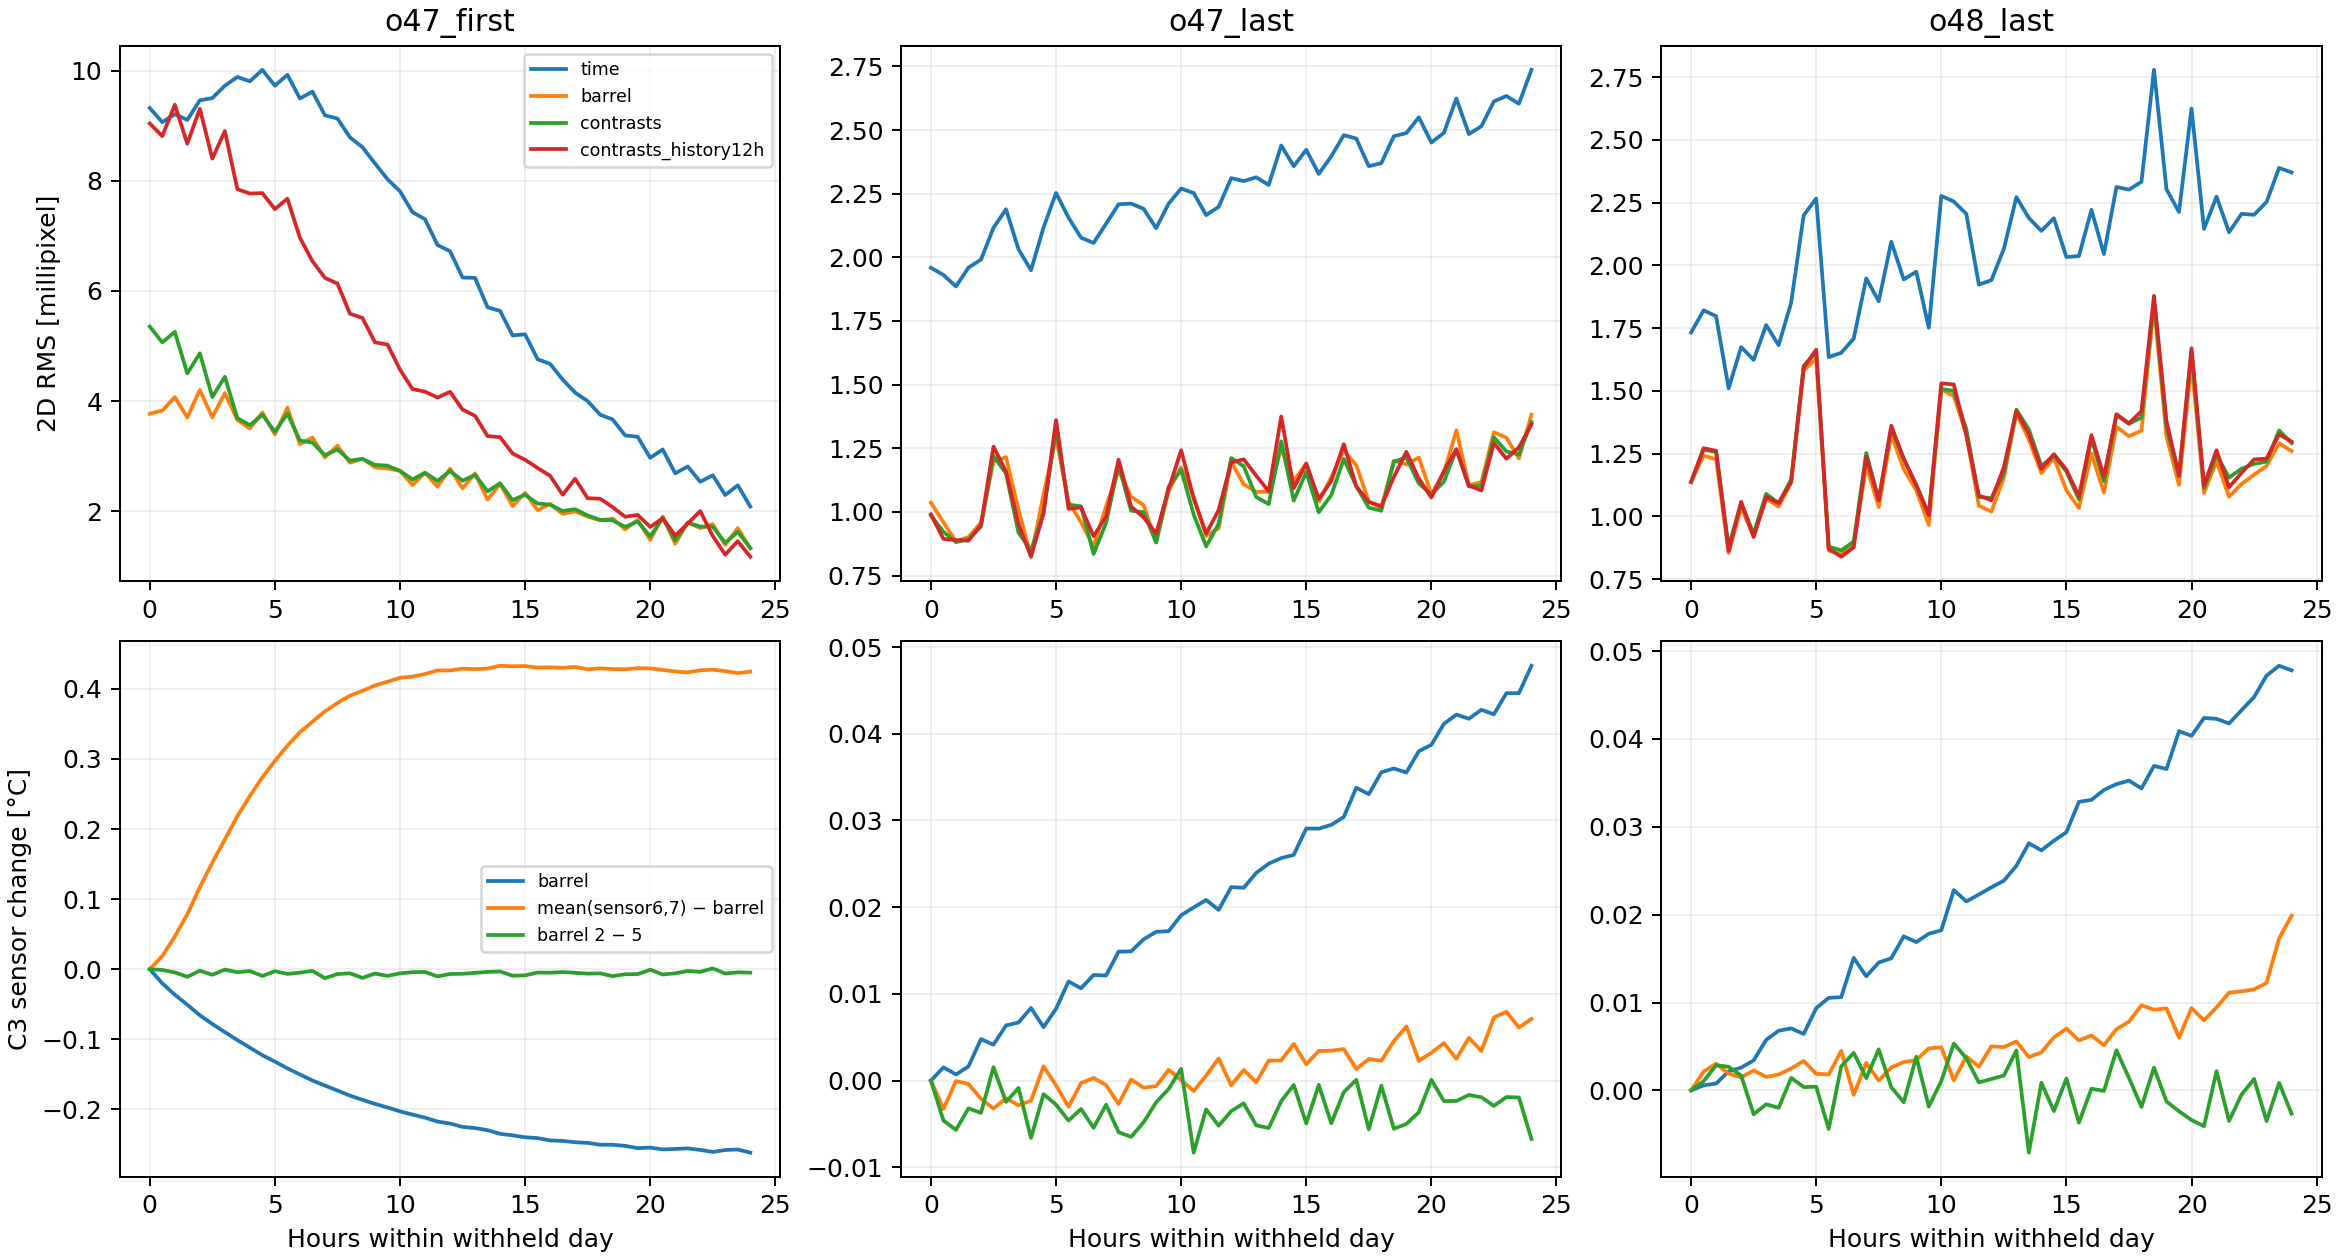
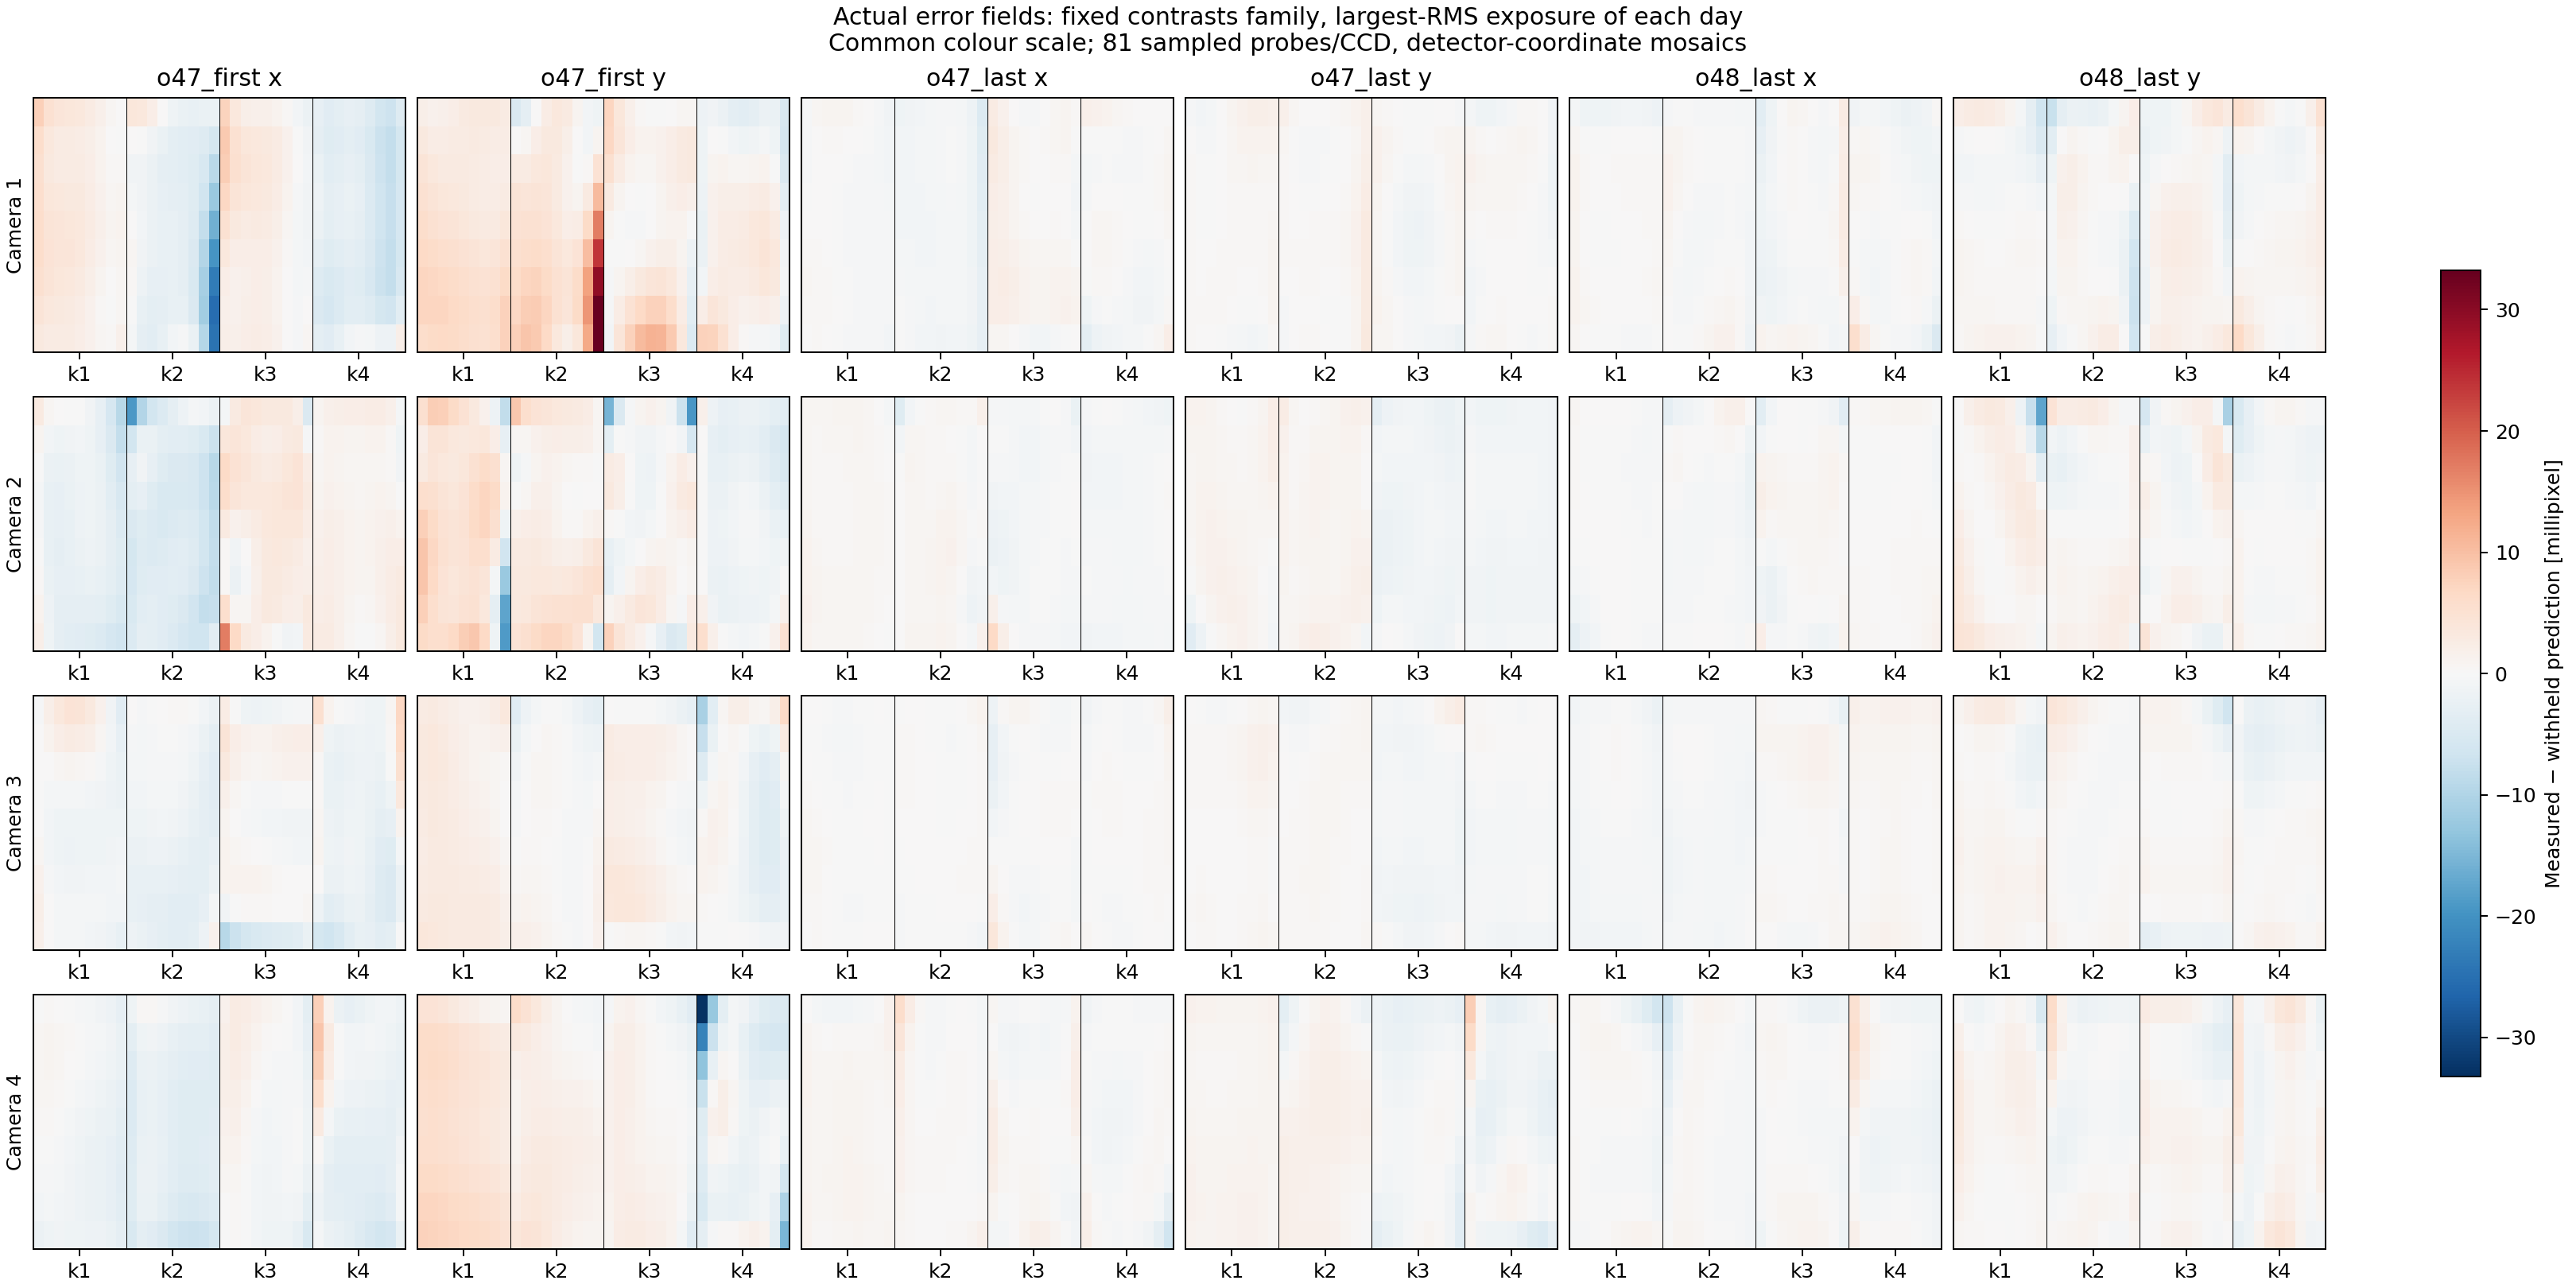
Actual signed errors and all-family image comparison
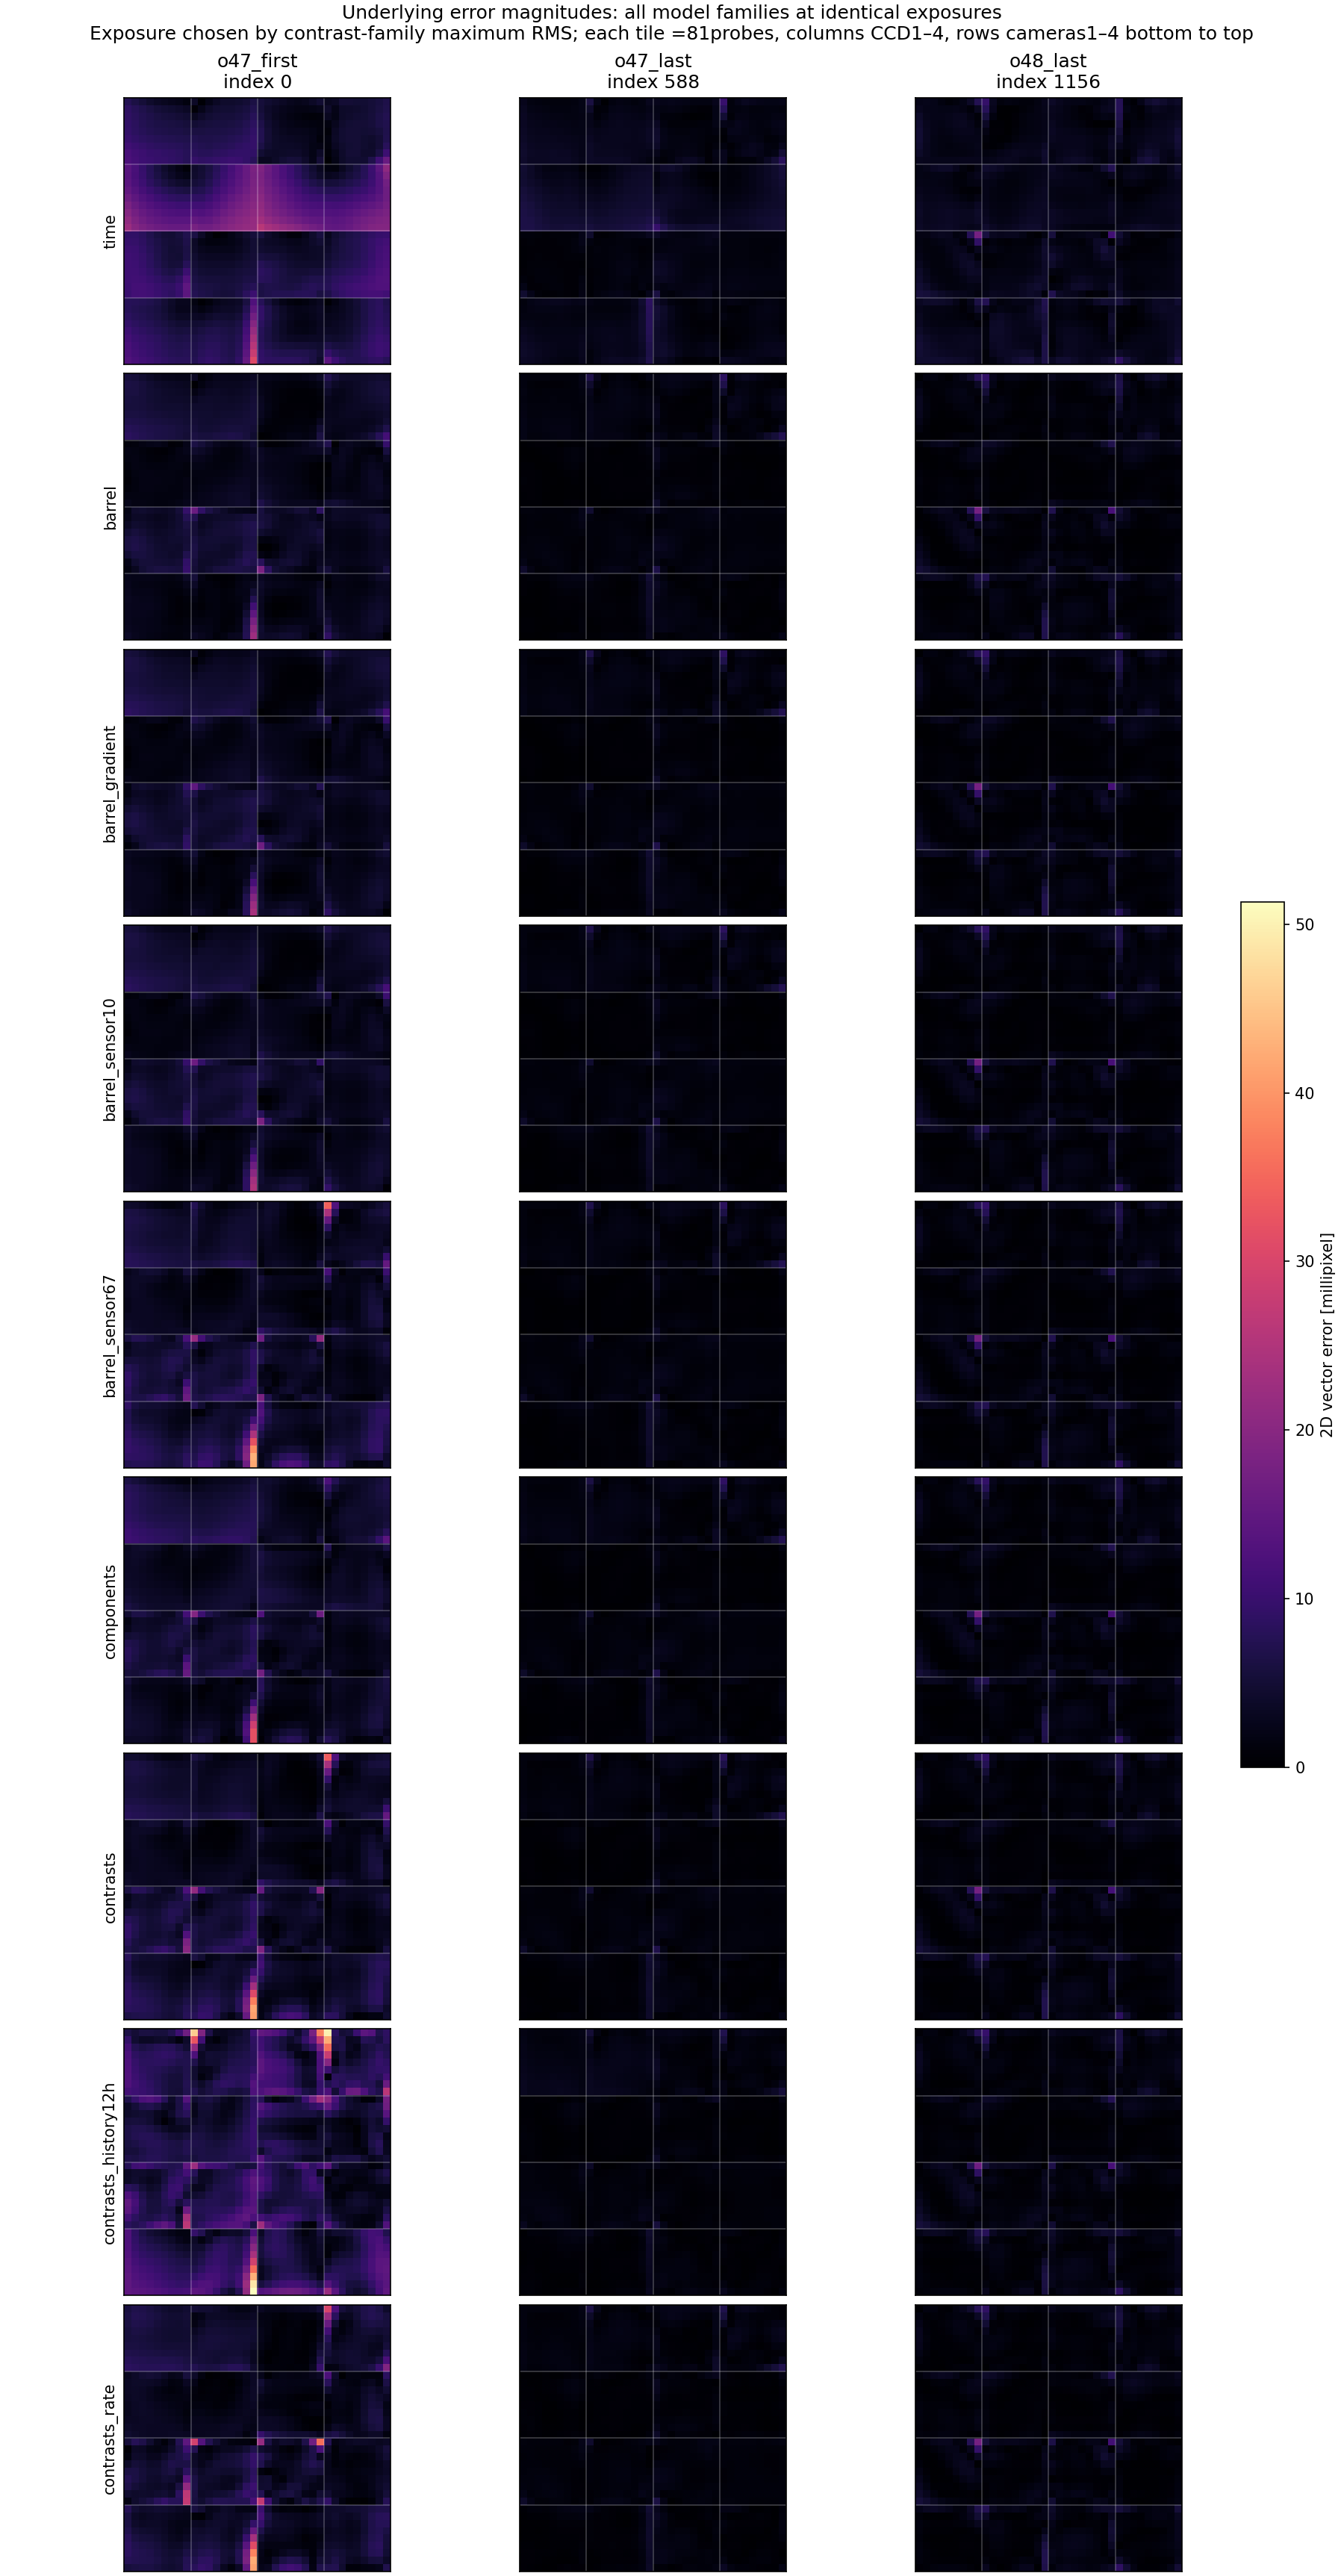
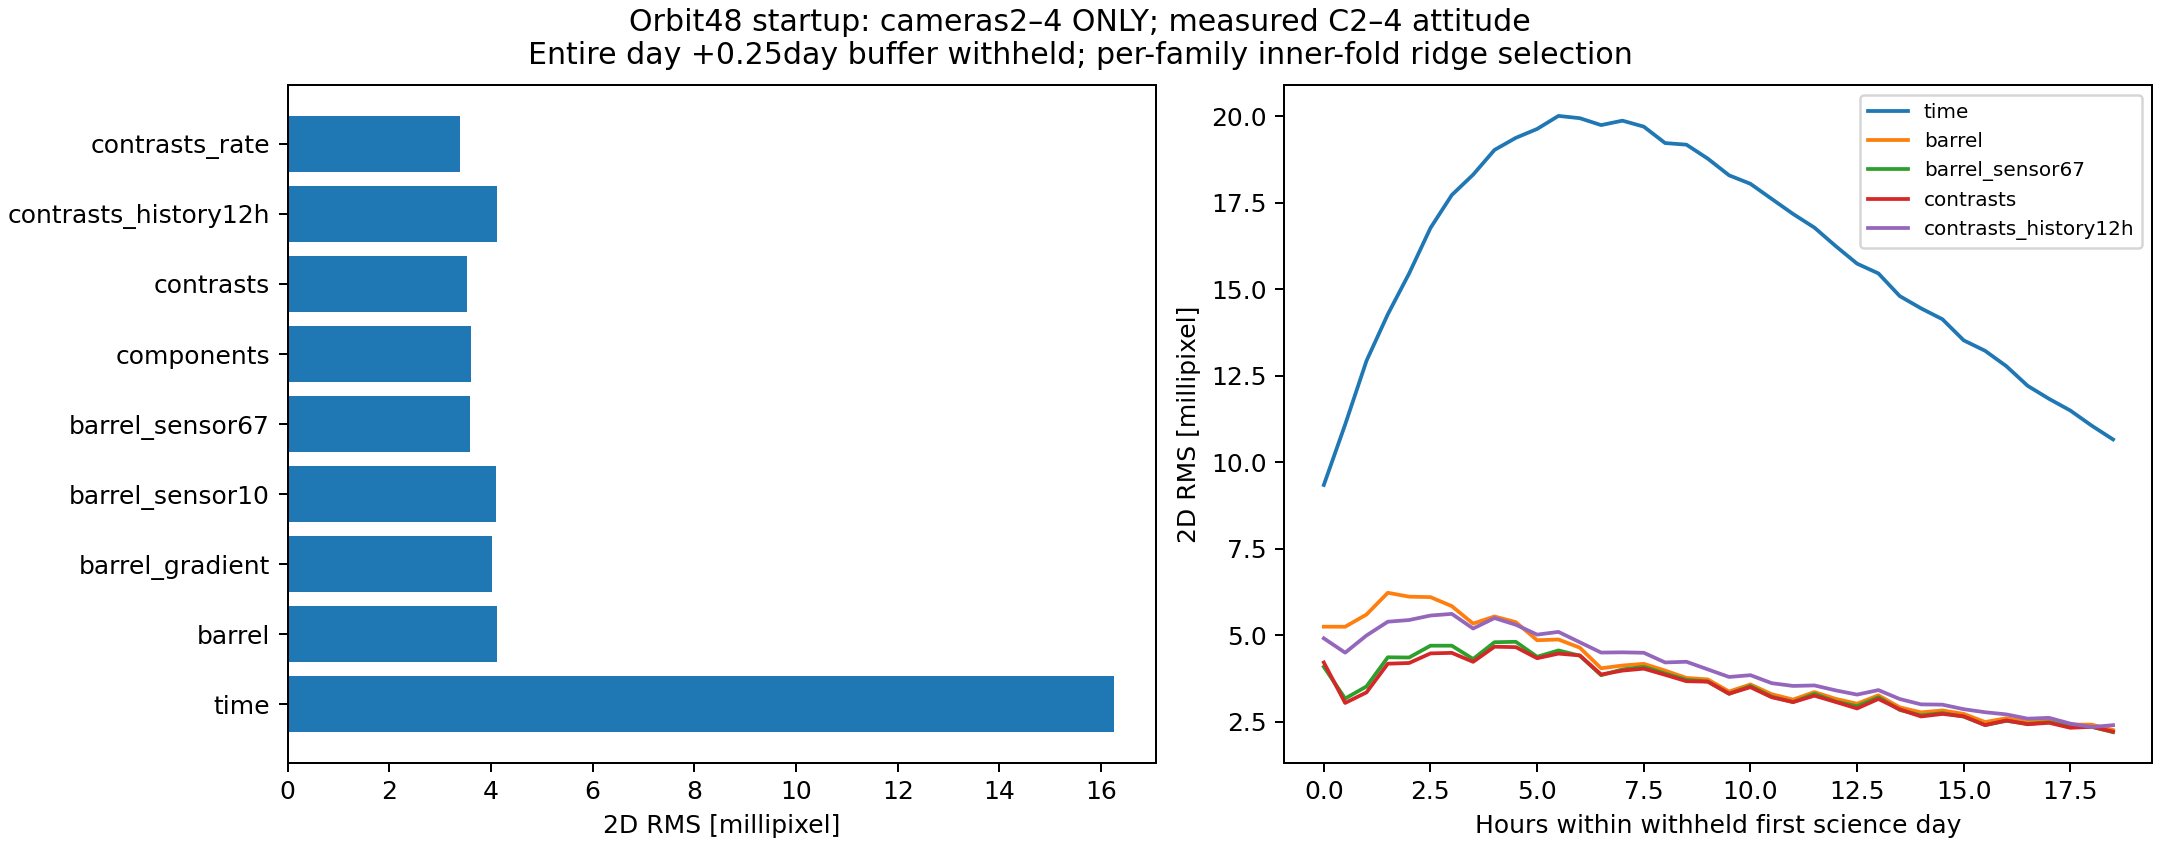
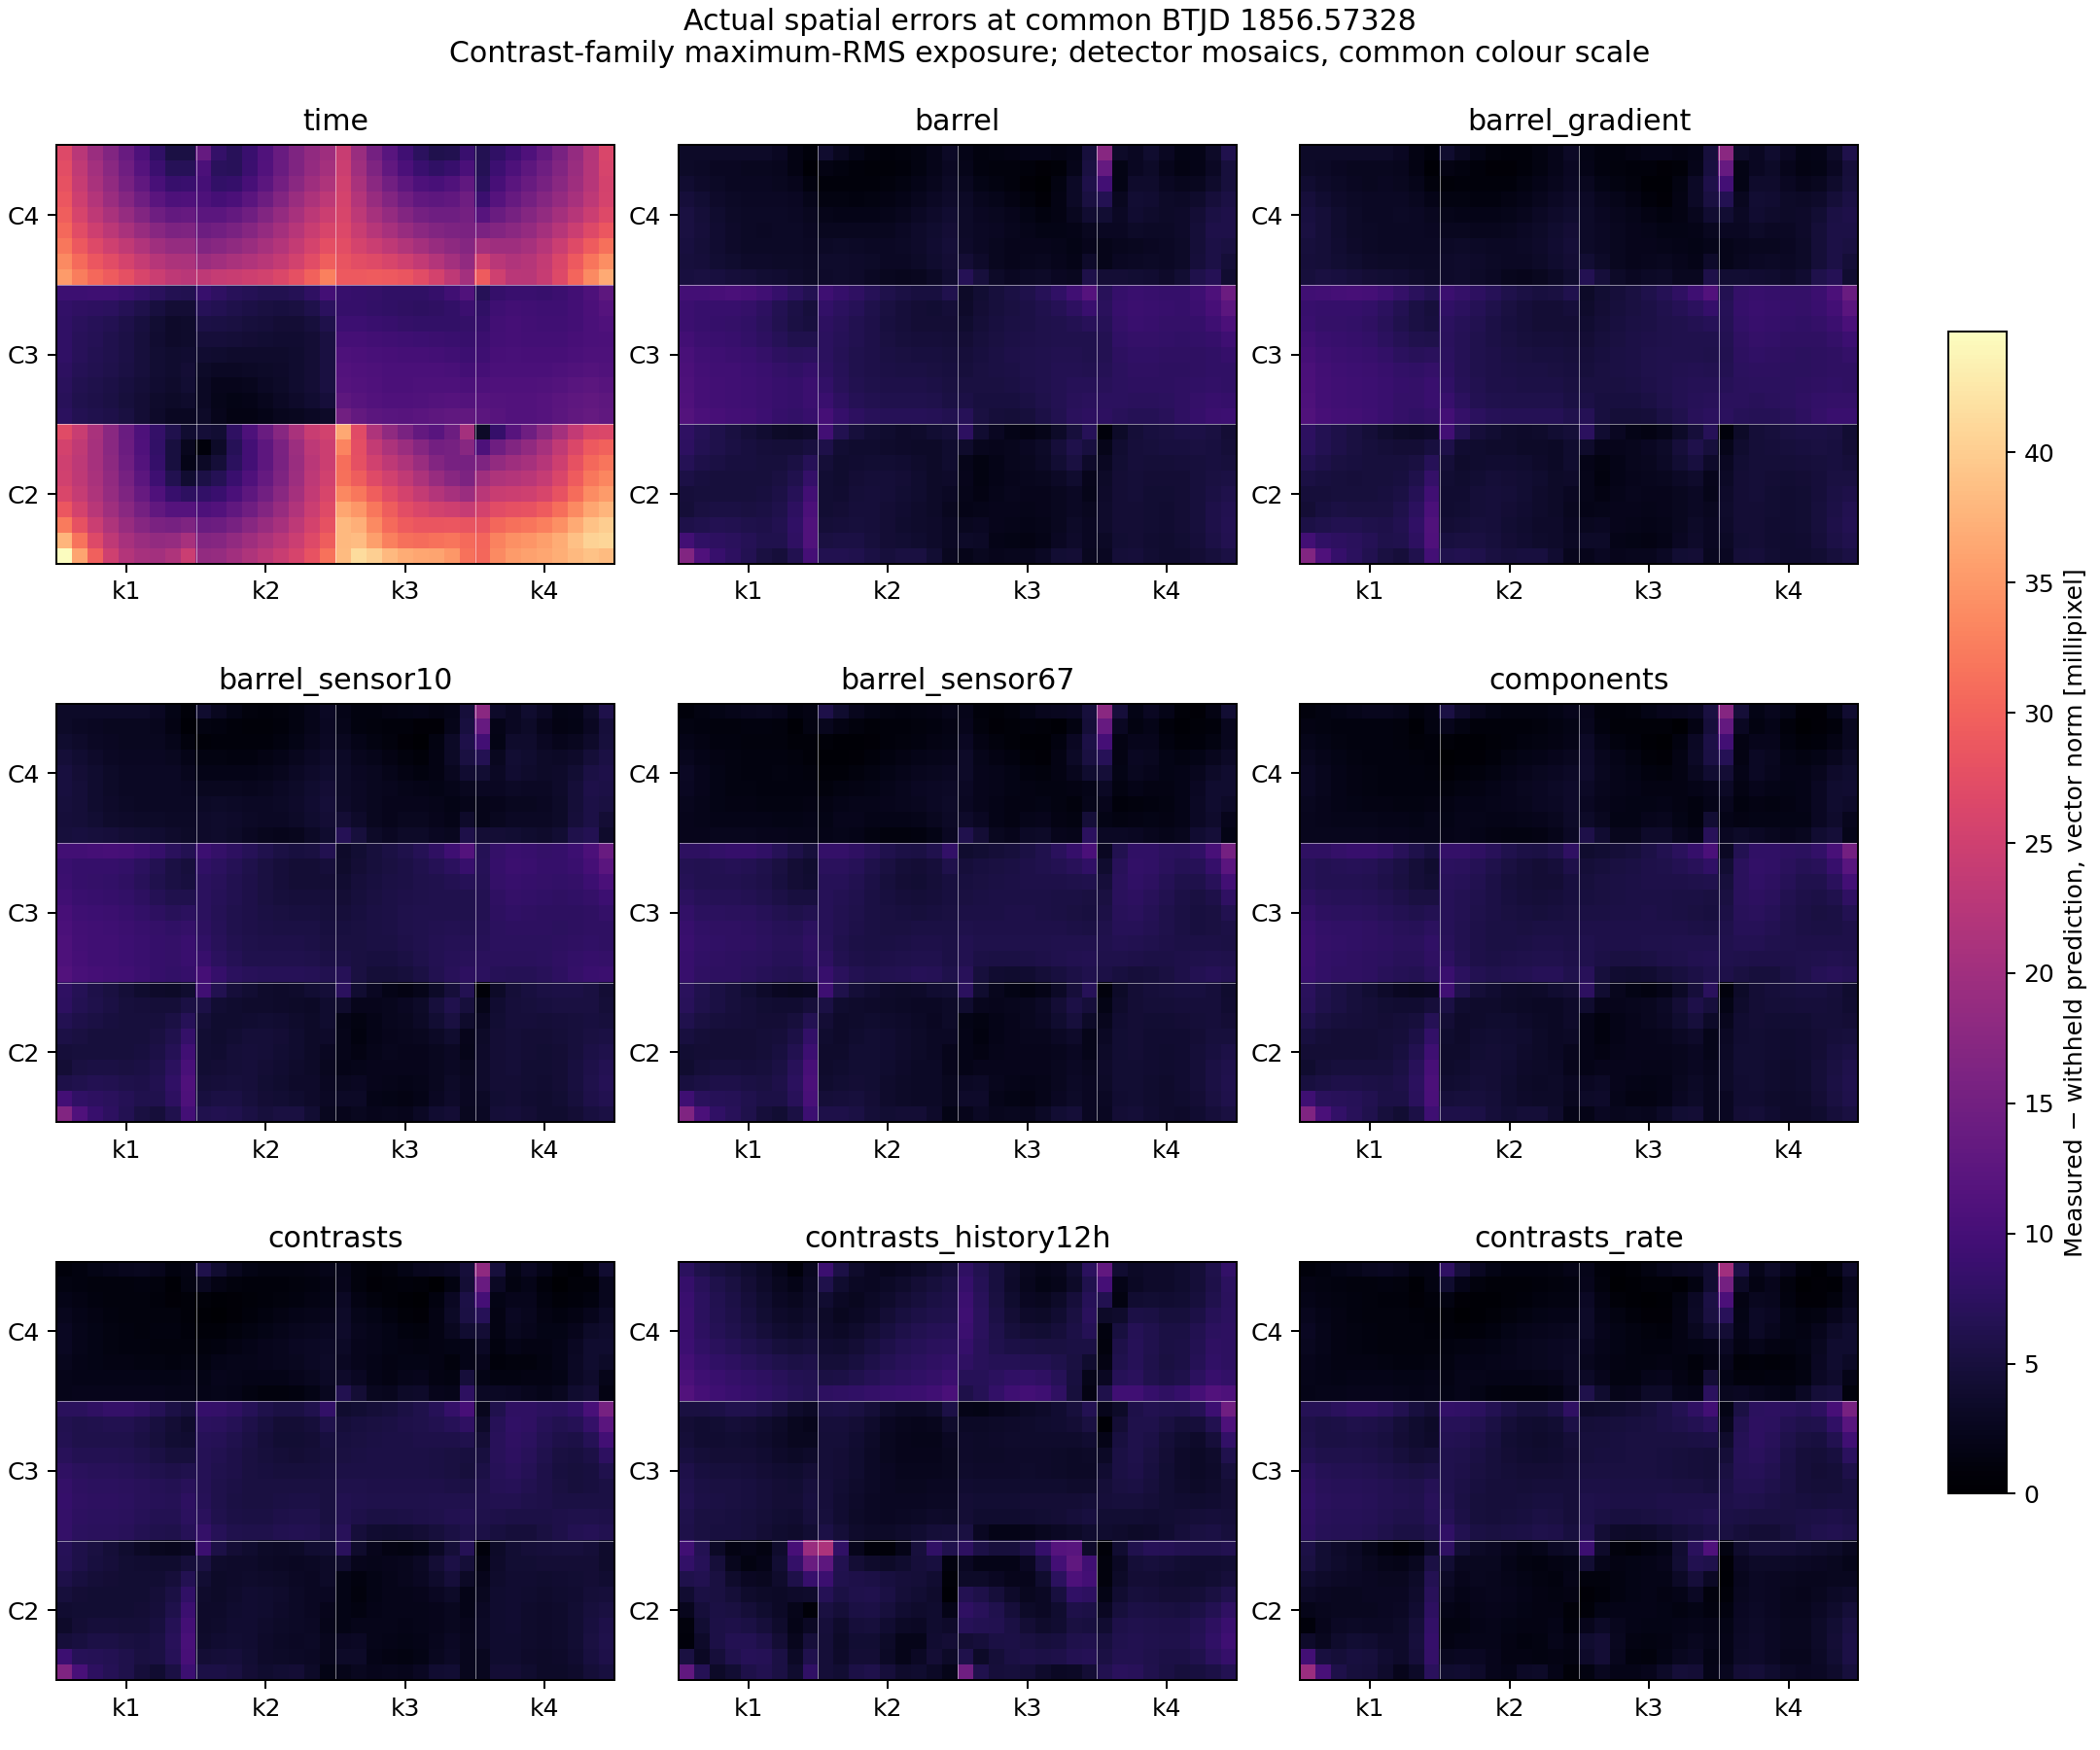
| Family | O47 first [mpx] | O47 last [mpx] | O48 first C2–4 [mpx] | O48 last [mpx] |
|---|---|---|---|---|
| time | 7.001 | 2.298 | 16.259 | 2.081 |
| barrel | 2.757 | 1.105 | 4.127 | 1.217 |
| barrel_gradient | 2.765 | 1.109 | 4.026 | 1.223 |
| barrel_sensor10 | 2.781 | 1.110 | 4.092 | 1.219 |
| barrel_sensor67 | 3.023 | 1.092 | 3.589 | 1.267 |
| contrasts | 2.965 | 1.083 | 3.532 | 1.248 |
| contrasts_history12h | 5.283 | 1.102 | 4.127 | 1.250 |
| contrasts_rate | 2.984 | 1.053 | 3.386 | 1.234 |
- Additional sensor6/7 contrasts and rates help orbit48 startup, but the same additions do not close orbit47 startup. The fixed12h model does not improve the aggregate startup results.
- This is evidence against these predictors being universally sufficient, not against thermal physics. Correlated sensors cannot identify a unique mechanical cause.
- Feature selection after inspecting this table requires new validation. No “best row” is promoted as an unbiased final score.
4. What shape remains?
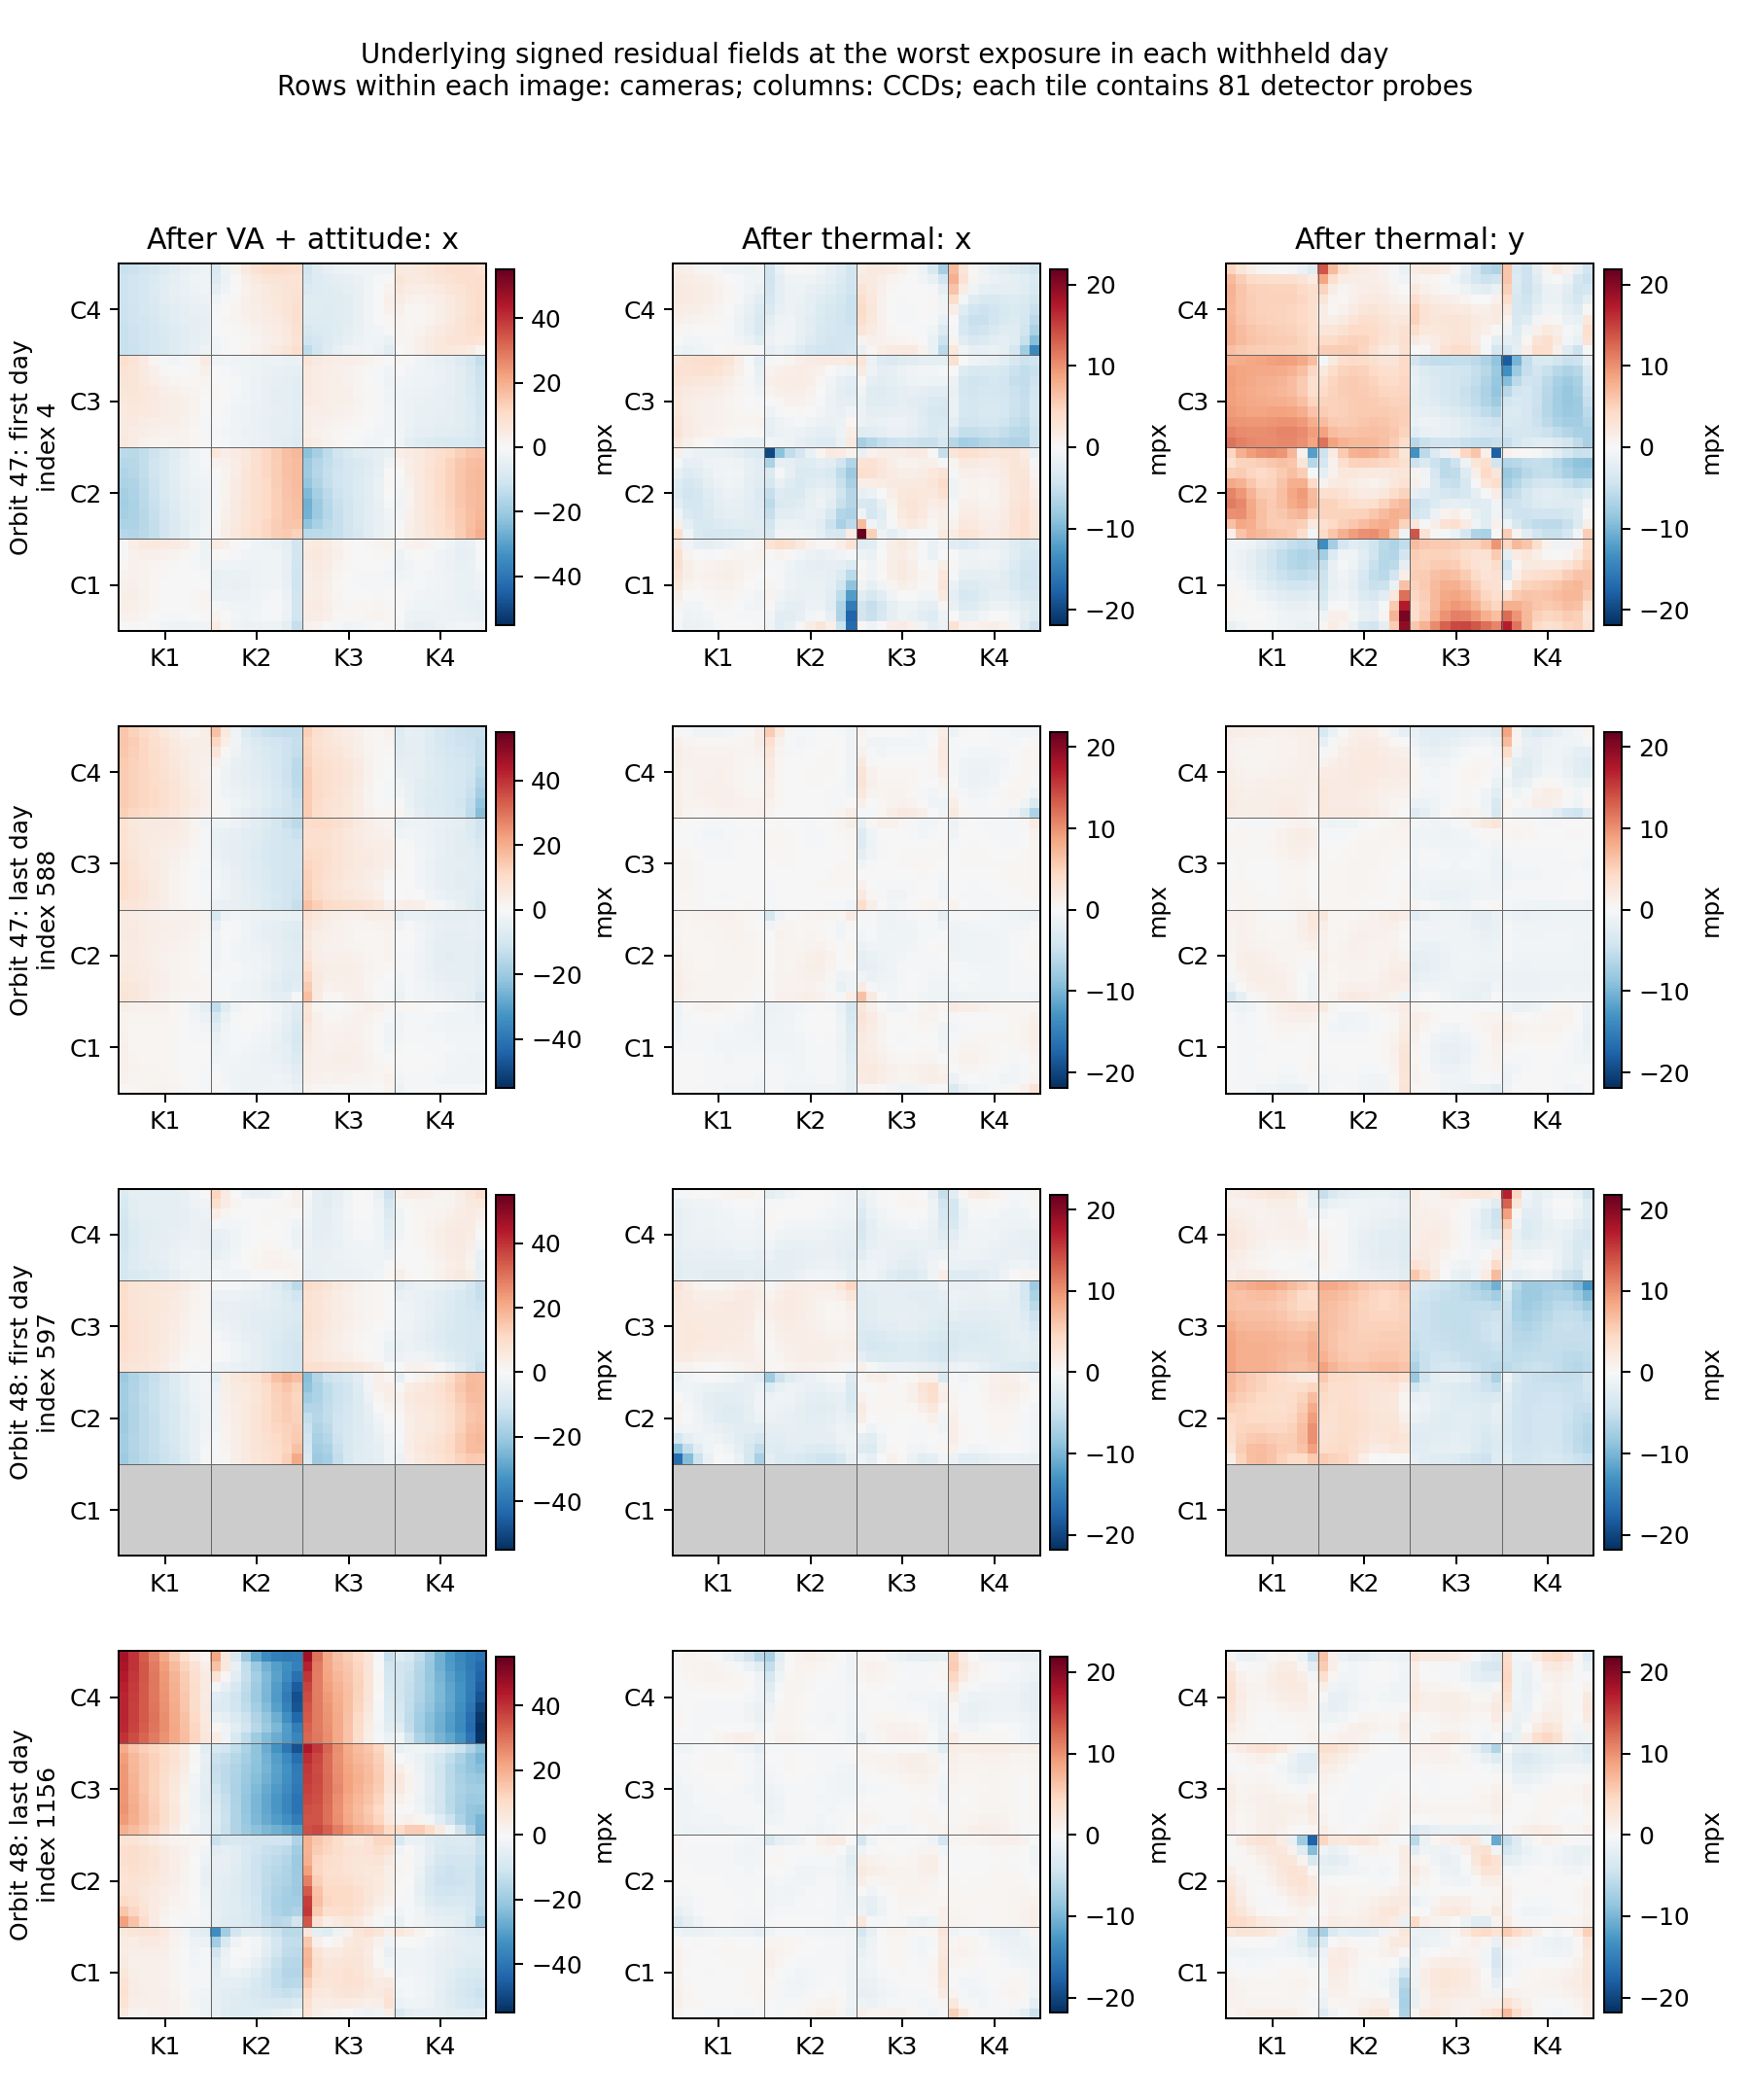
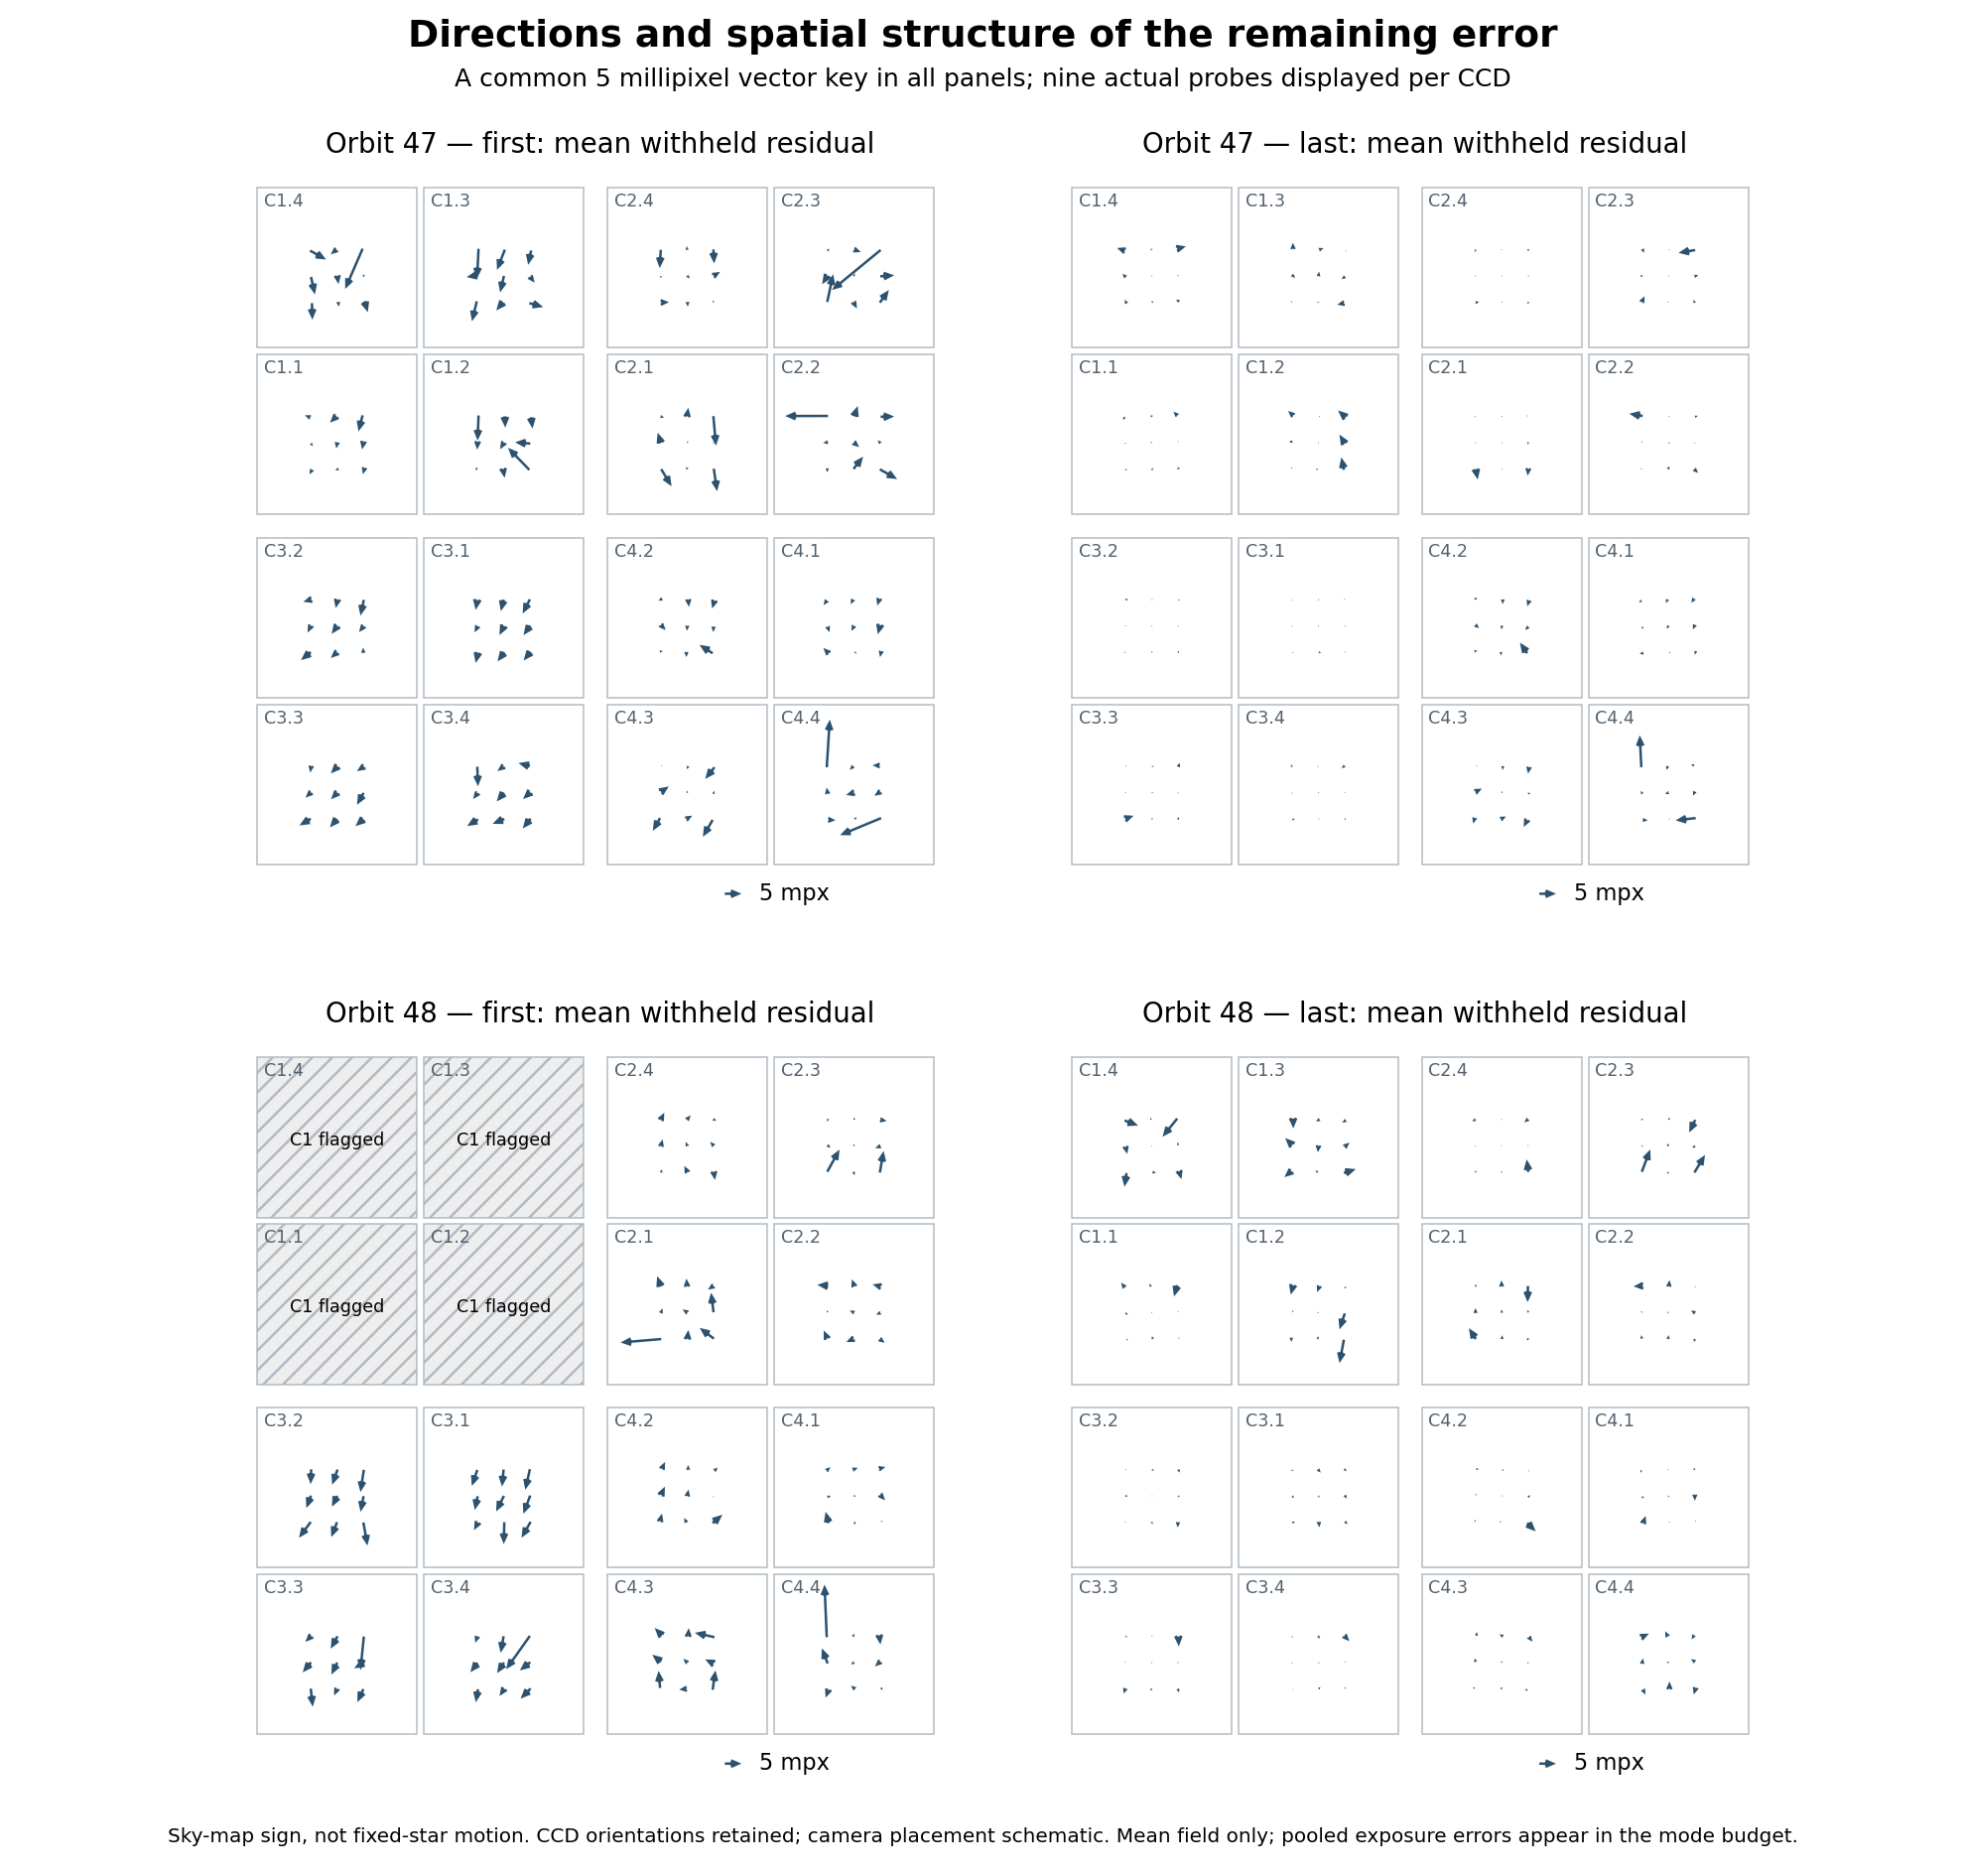
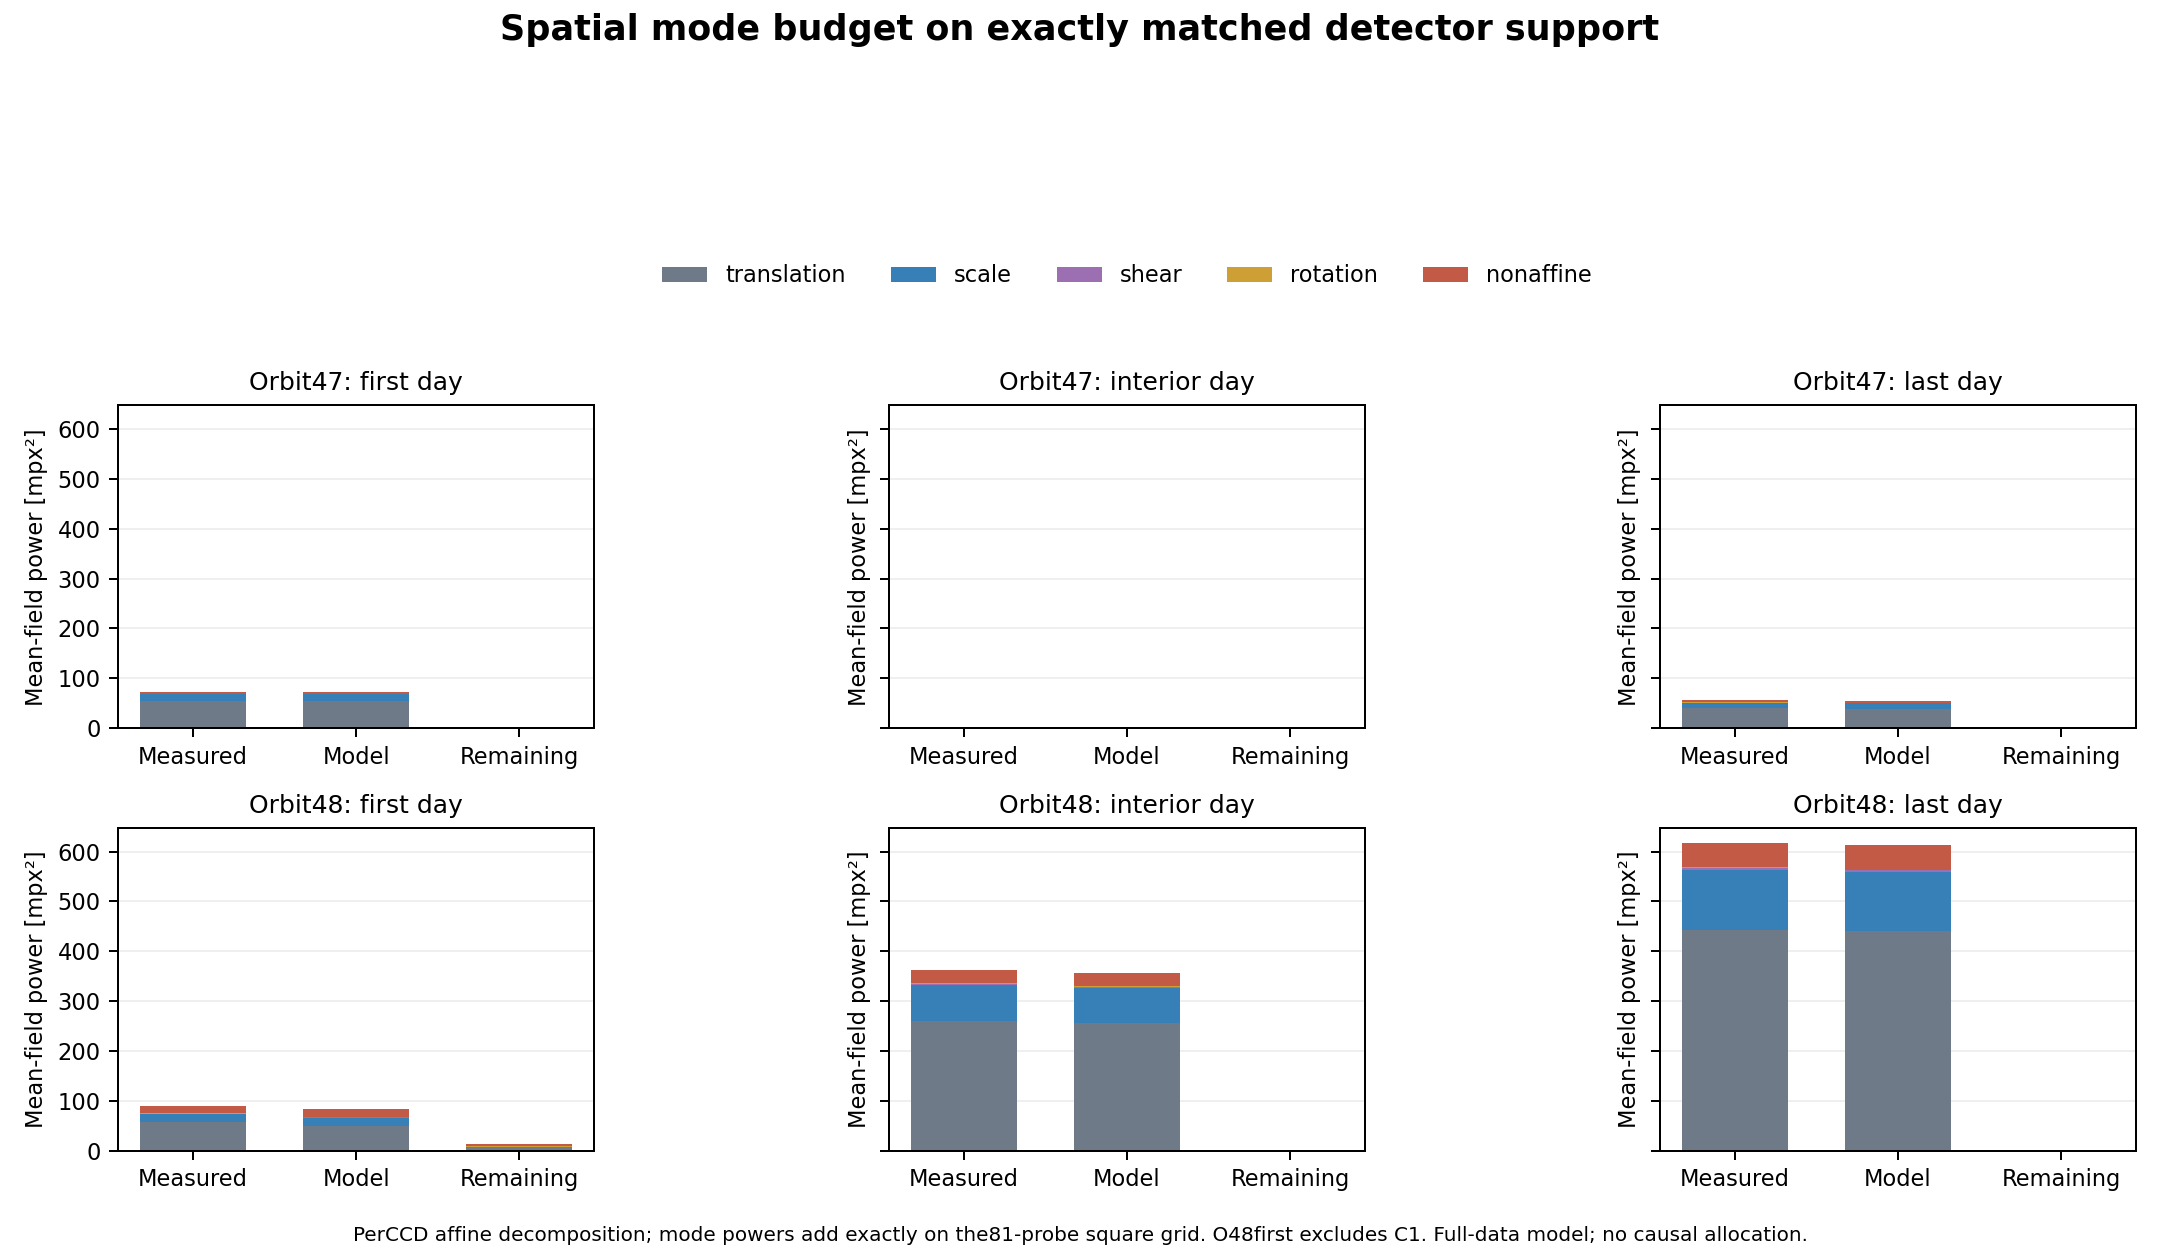
The signed maps show broad offsets/gradients and localized edge structure. Per-CCD translation, isotropic scale, shear, rotation and non-affine terms describe that shape; they do not identify its mechanical cause. A per-CCD translation is not automatically spacecraft pointing. Camera-wide radial expansion can also contribute to those offsets; a local-mode budget alone cannot exclude it.
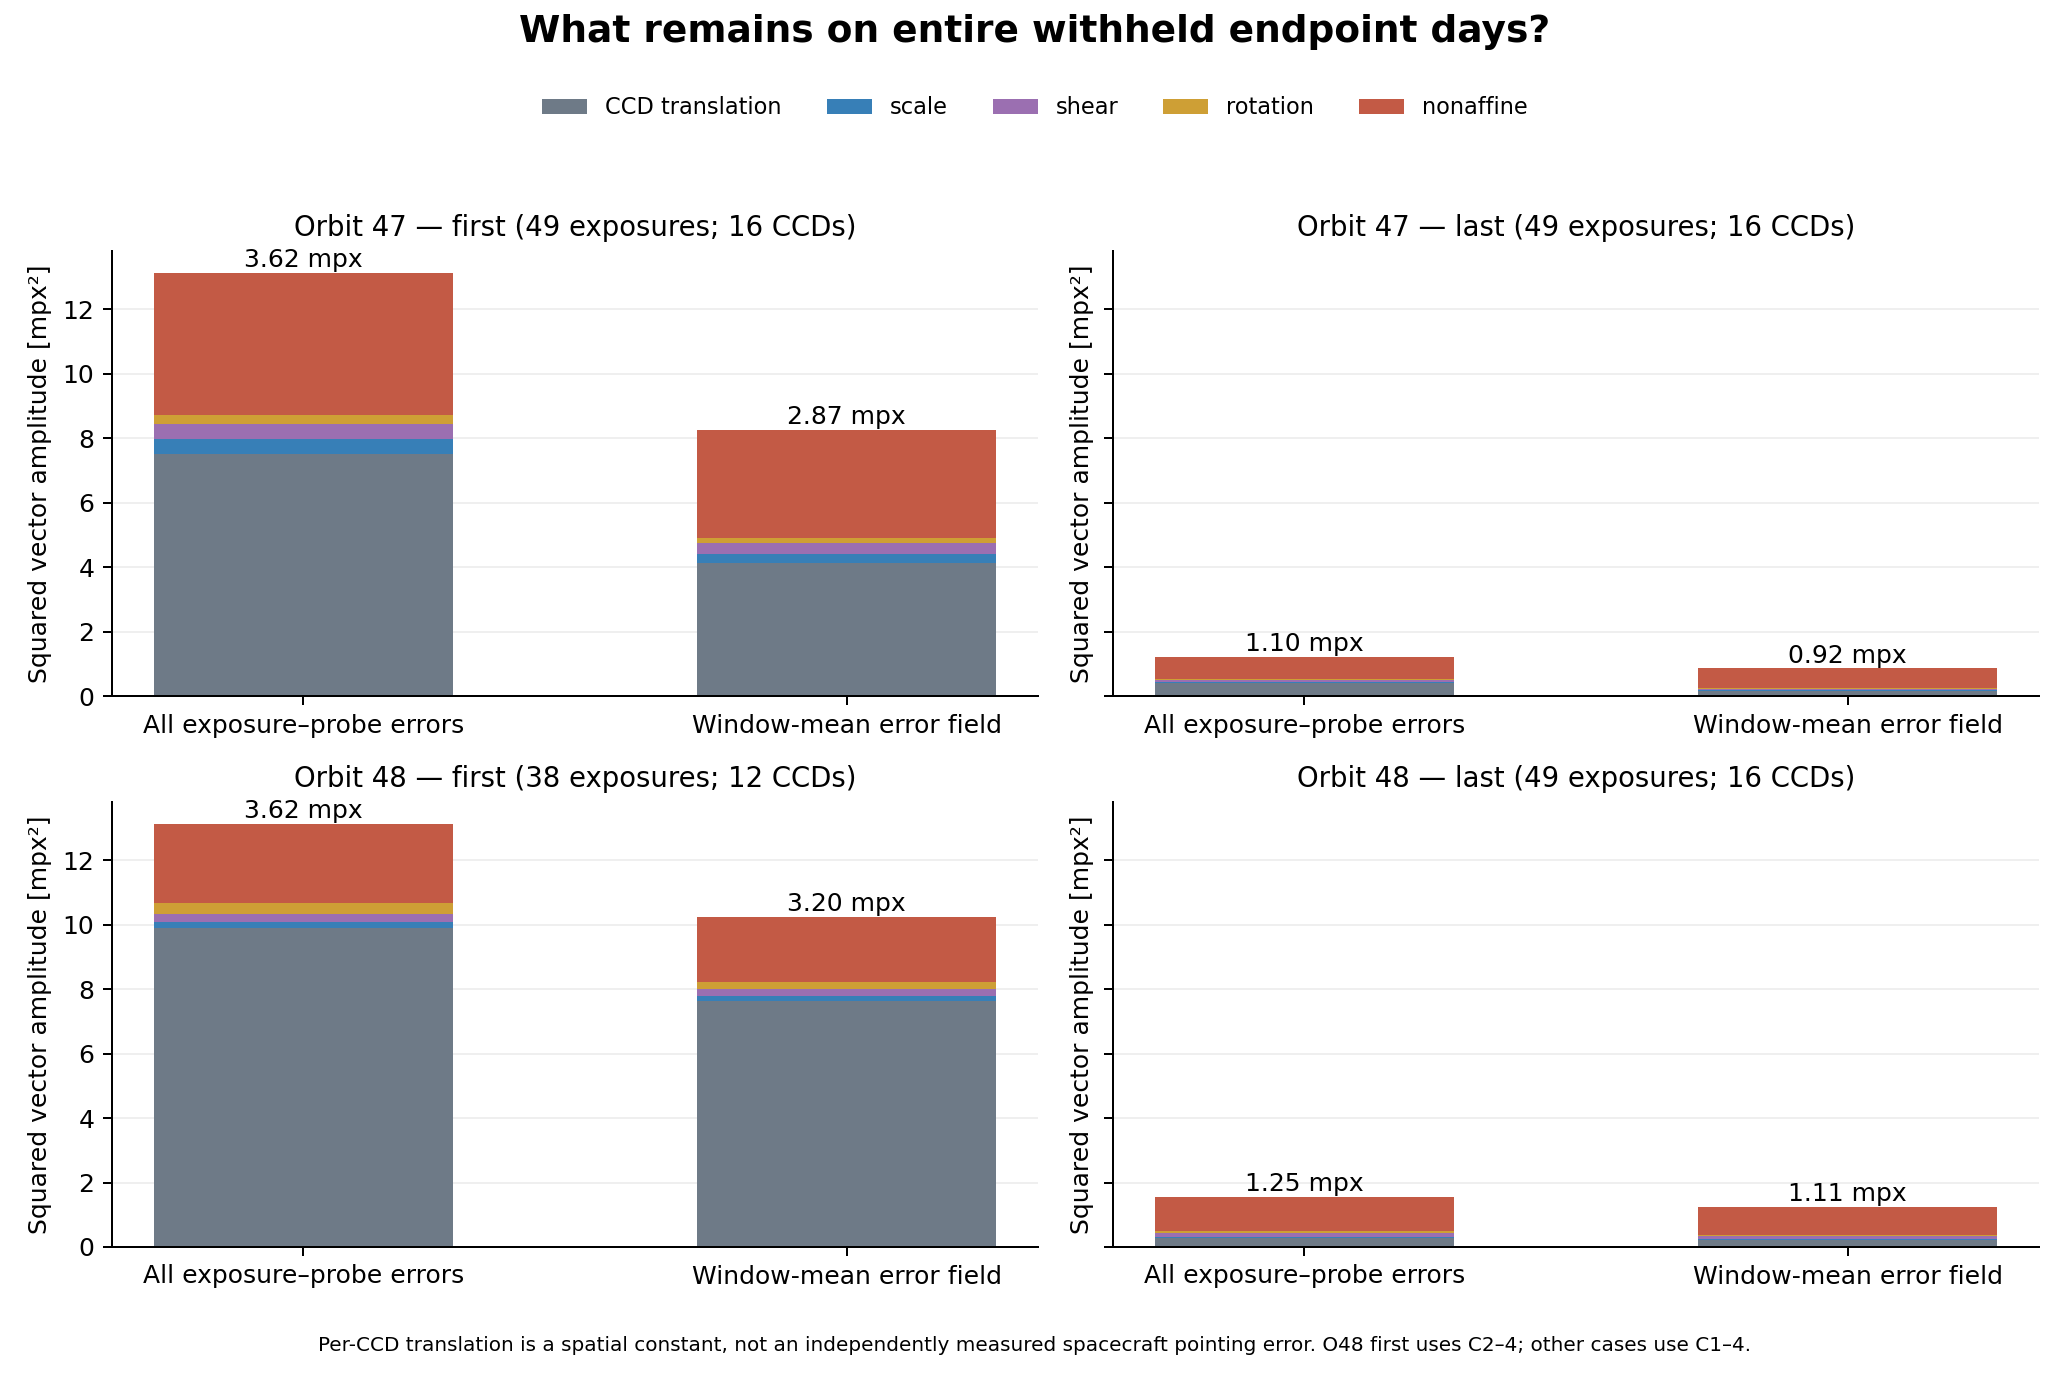
| Window | CCD offsets [% squared error] | Scale [% squared error] | Non-affine [% squared error] |
|---|---|---|---|
| o47_first | 57.080 | 3.638 | 33.594 |
| o47_last | 32.927 | 3.512 | 56.025 |
| o48_first | 75.249 | 1.542 | 18.697 |
| o48_last | 17.023 | 2.762 | 68.767 |
- Startup residuals contain coherent CCD-level offsets and non-affine structure. The fitted per-CCD isotropic scale term accounts for only about1.5–3.6% of remaining squared error in these archived endpoint predictions.
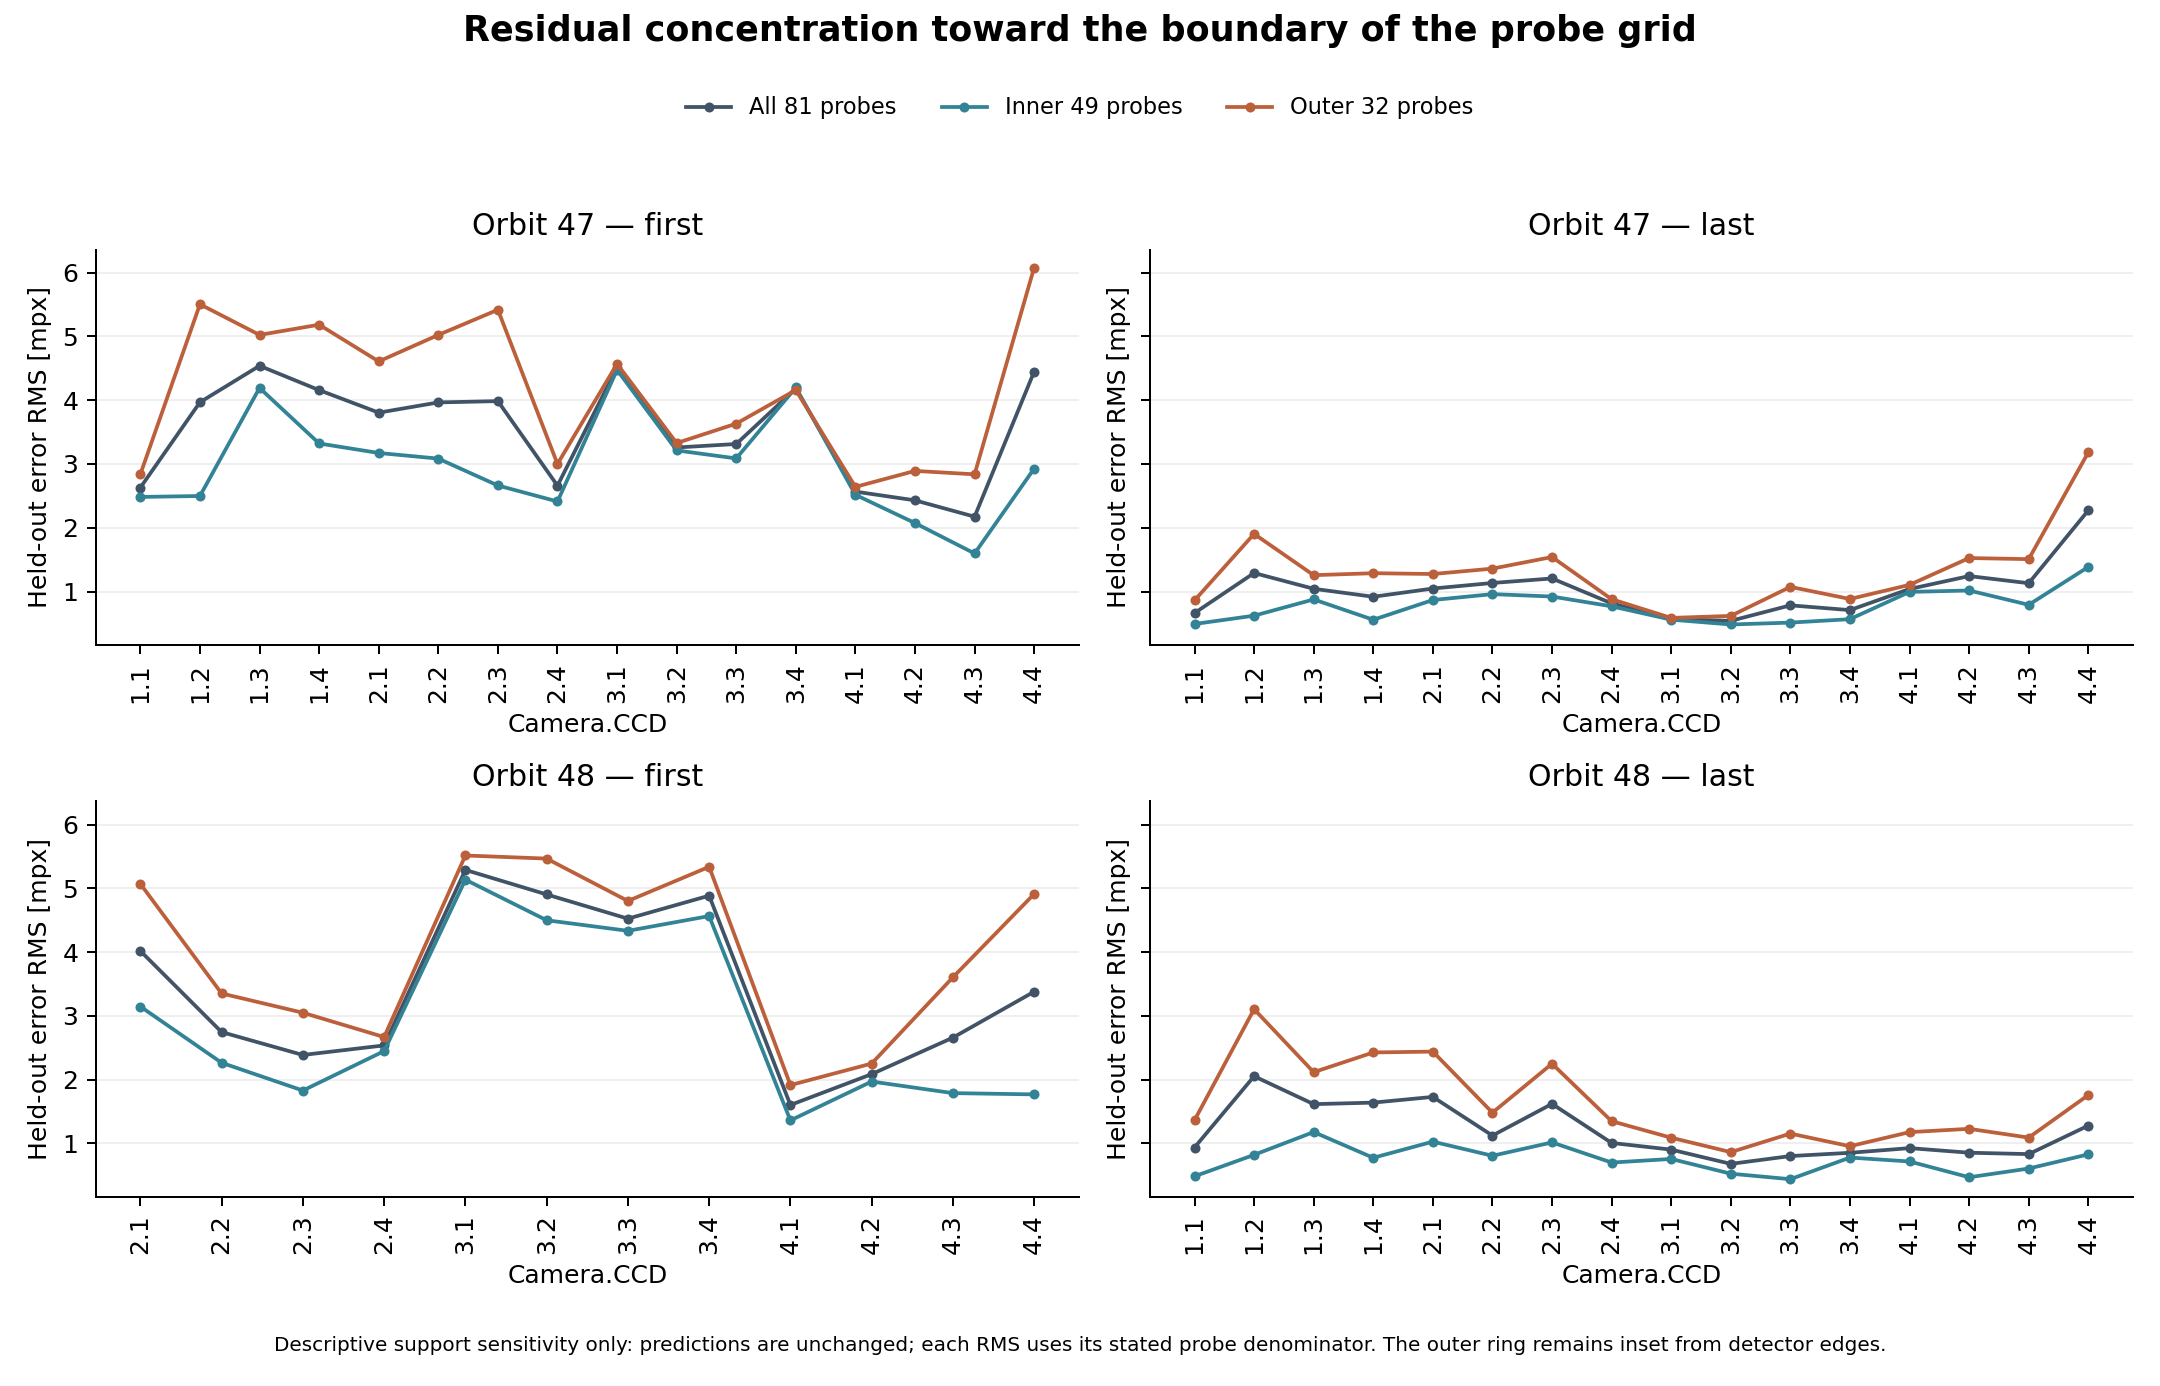
- At orbit48 startup, C3 retains an offset across all four CCD interiors; edge-localized failures alone do not explain it. Other CCDs show stronger outer-probe contributions.
- The edge test changes only the scored support, not the predictions. Lower interior RMS is not an improved correction; it identifies where validation is needed.
- Non-affine means the part not represented by a per-CCD linear transform. It could contain optical distortion, centroid bias or polynomial-WCS fitting artifacts. A coherent header residual is not proof of mechanical motion.
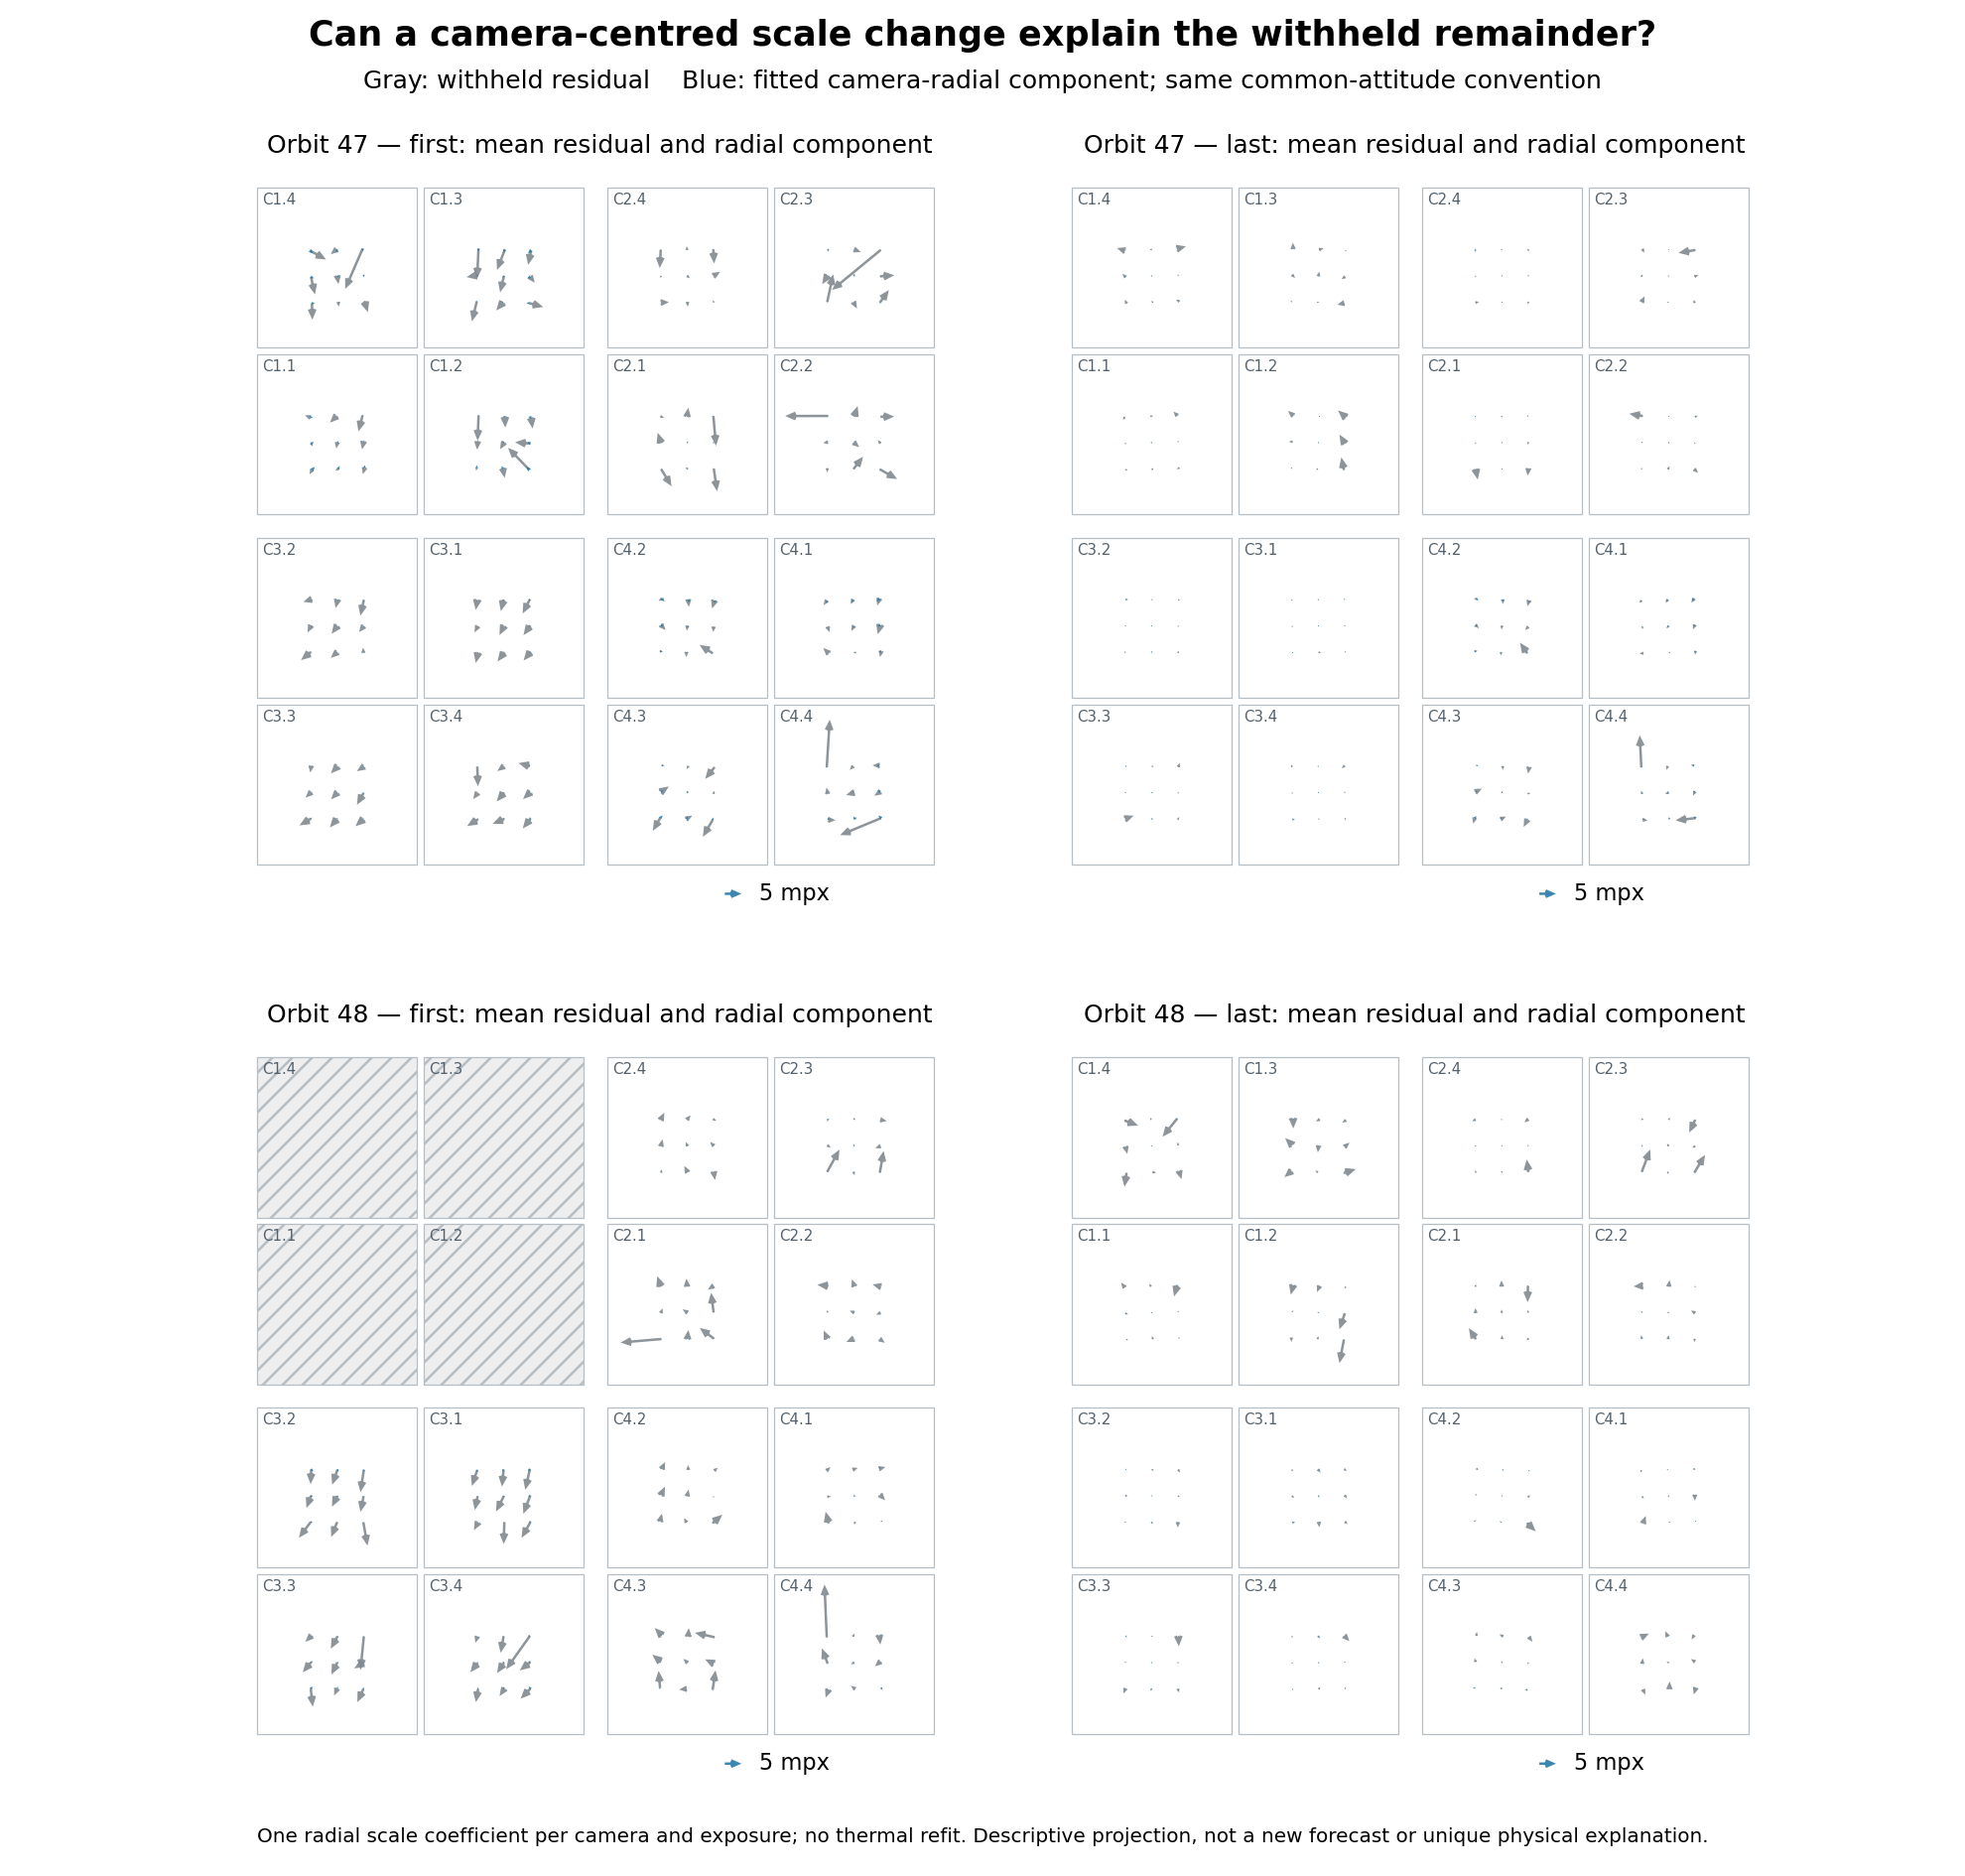
- A separate whole-camera radial-template test addresses the per-CCD-centering ambiguity. Even allowing a free amplitude for every camera and exposure, these templates capture only6.49%,5.32%,1.09% and2.00% of the remaining squared error for orbit47 first/last and orbit48 first/last, respectively.
- Thus another simple camera-centred isotropic expansion cannot account for most of this remainder under the tested geometry. More general thermal deformation, tilt/alignment changes and estimator effects remain possible.
Supplement: full-data calibration mode inventory
5. Sensor identities, possible causes and discriminating tests
Sensor identity
| Channel | Sector20 FITS description | Instrument Handbook TableA.3 |
|---|---|---|
| 2 | Lens Barrel | L1 |
| 3 | Lens Barrel | L2 |
| 4 | Lens Barrel | L3/4 |
| 5 | Lens Barrel | L4/3 |
| 6 | FPE Housing | Generic PT1000 sensor6 |
| 7 | FPE Housing | Base Plate |
| 9 | FPA Housing | CCD Case |
| 10 | FPA Mosaic | Mosaic |
- Preserve exact channel numbers. The flight-file and design-document descriptions do not uniquely identify the mechanically responsible element.
- Sensor differences are temperature contrasts, not gradients per metre: no calibrated sensor separation has been used.
- The handbook describes multiple thermal paths, including the lens hood heat sink and isolation between focal-plane electronics and assembly. That motivates component-resolved tests without proving a particular residual's cause.
- Primary source: TESS Instrument Handbook, §4.4 and AppendixA.
Shape of the withheld remainder
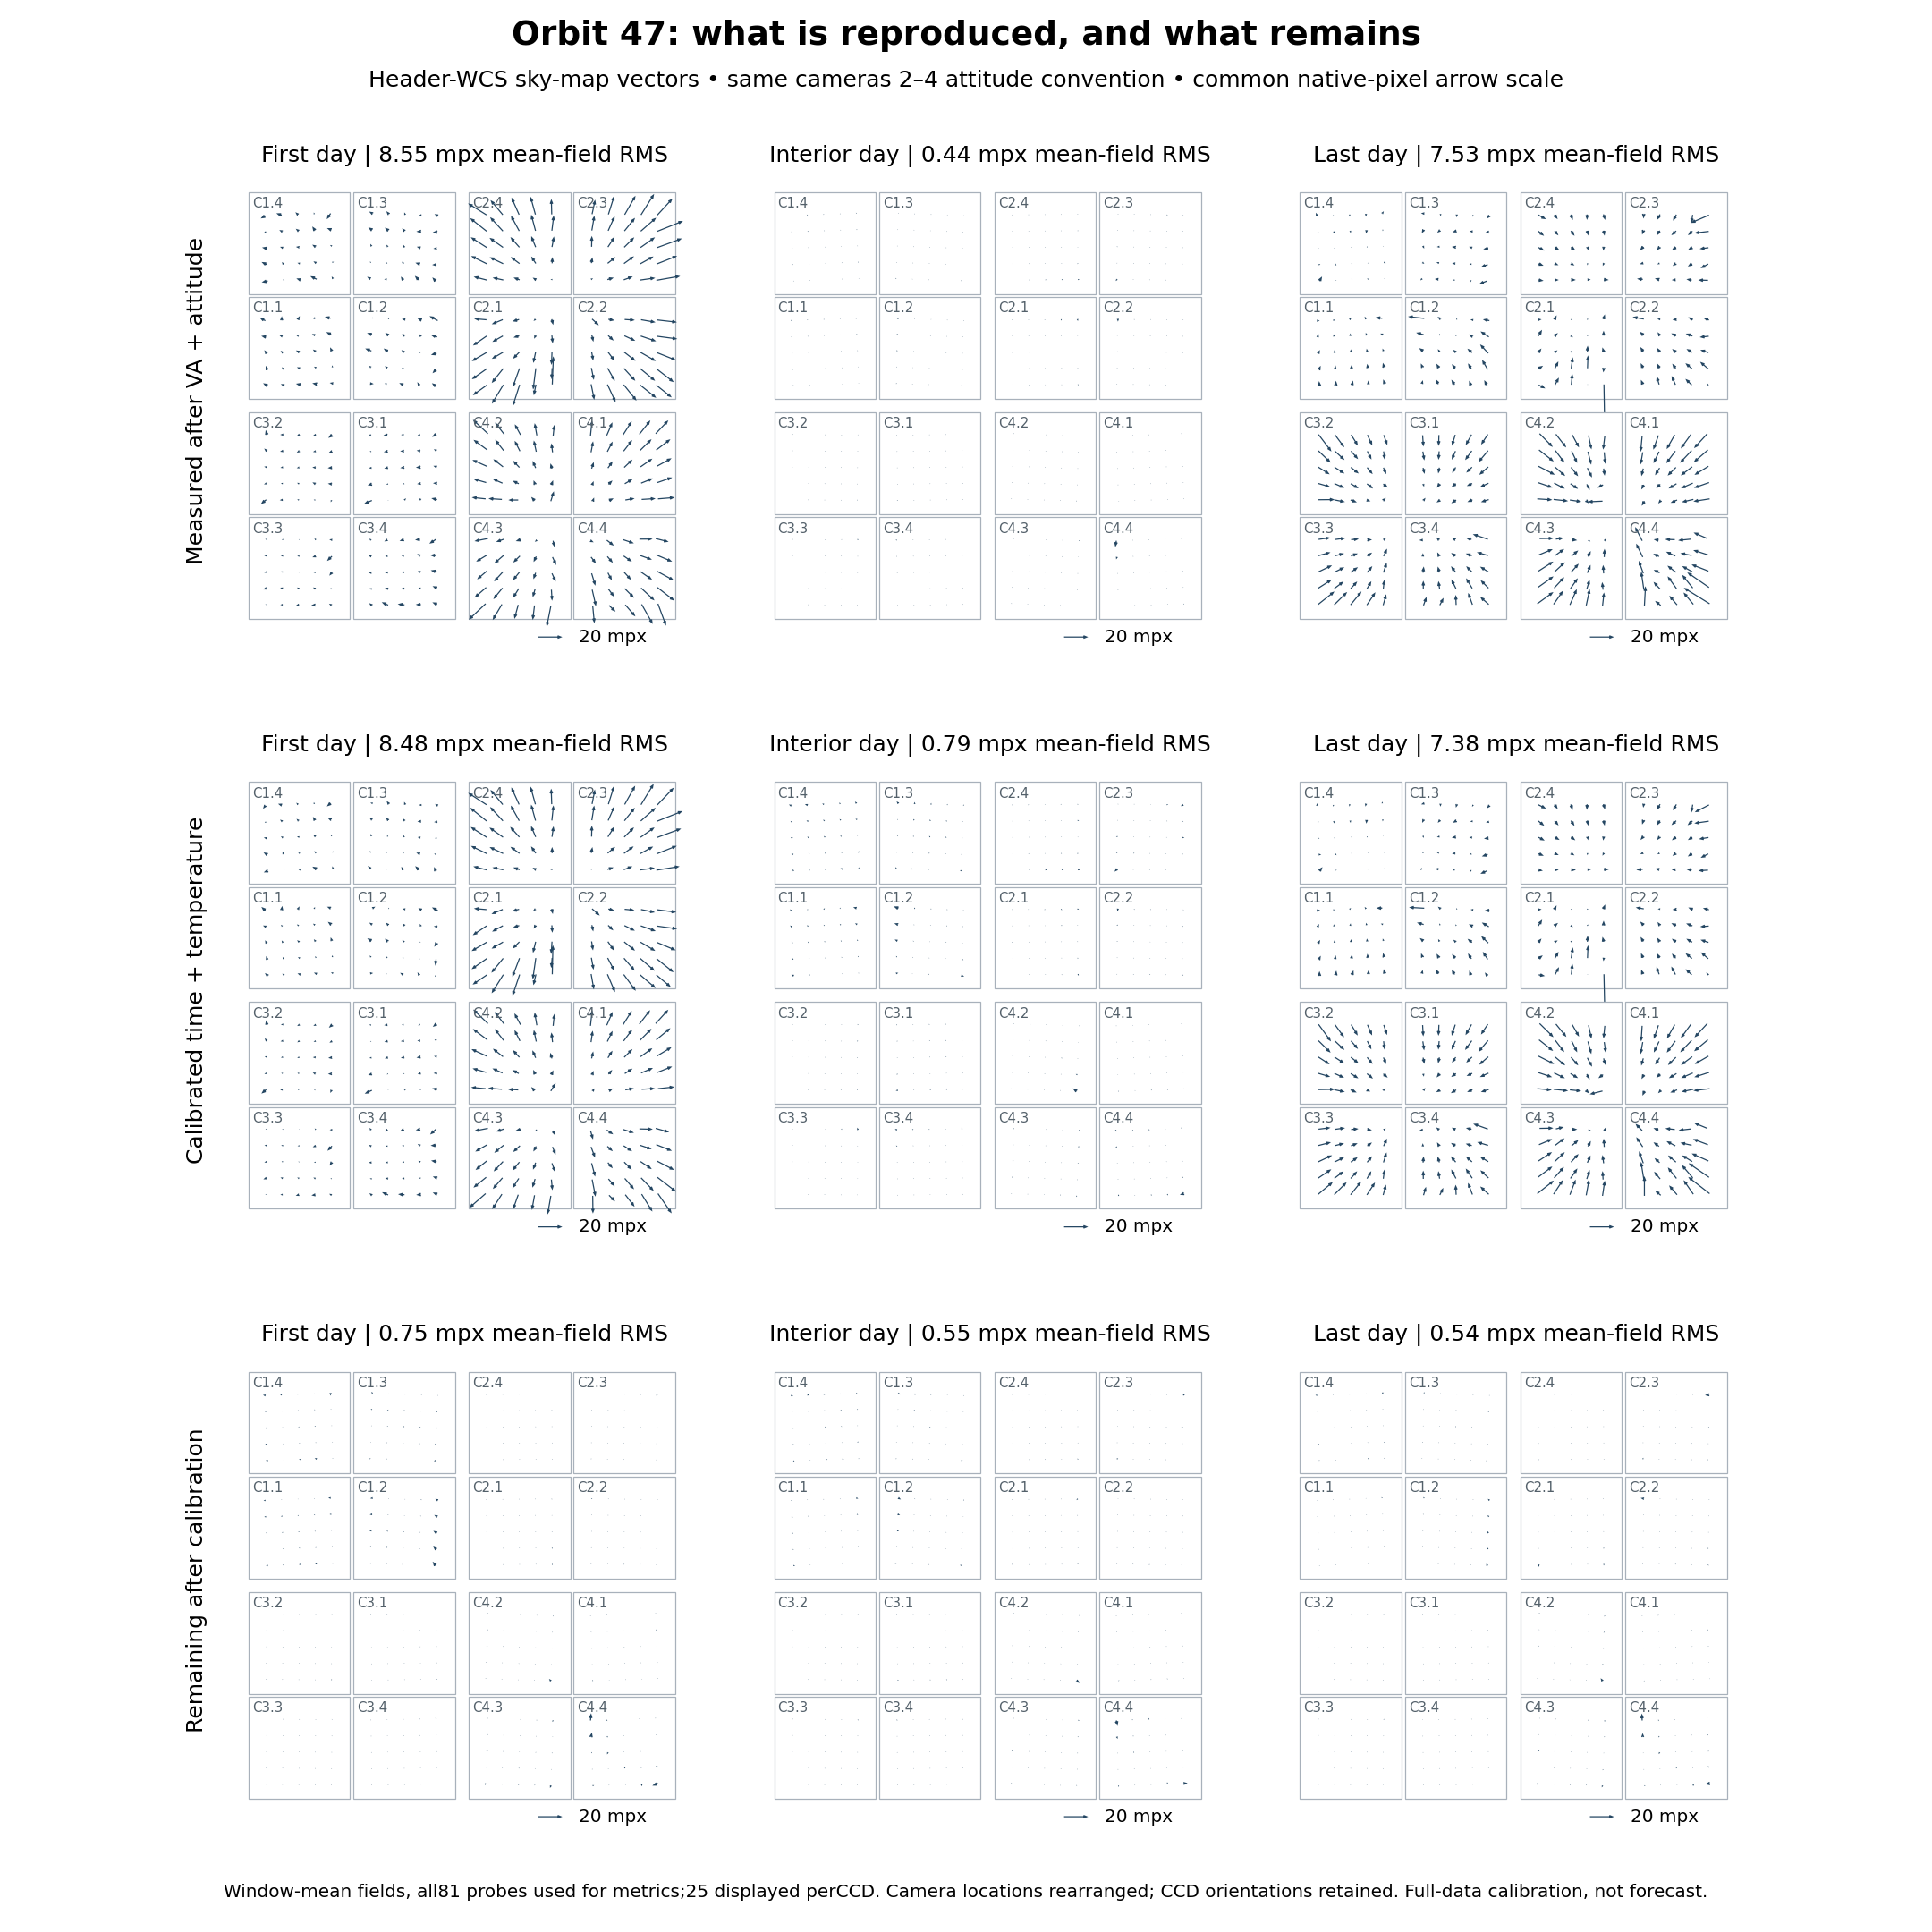
- The archived endpoint errors contain coherent per-CCD offsets and non-affine structure. Per-CCD isotropic scale accounts for only about1.5–3.6% of their squared residual amplitude.
- A spatial constant within each CCD is not an independent spacecraft-pointing measurement. Common attitude has already been removed.
- Orbit48 camera3 retains residuals across CCD interiors. Some other CCDs show strong outer-probe concentrations; both physical distortion and WCS/centroid fitting artifacts remain plausible.
-
Window-mean maps show persistent patterns; exposure-averaged squared errors retain their time-variable part. The page plots both, without mixing their denominators.
-
A separate whole-camera radial-template projection (free camera amplitudes at every exposure) captures only1.09–6.49% of the remaining squared error across these endpoints. This descriptive fit addresses the CCD-centering ambiguity and limits simple isotropic expansion as the missing pattern; it does not rule out other thermal deformations.
What could cause the remainder?
| Candidate | Signature to test | Present limit |
|---|---|---|
| Unequilibrated optics or unmeasured thermal gradients | History-dependent scale/distortion at matched sensor temperatures | Tested contrasts/history do not close both startups |
| Camera or detector alignment changes | Relative CCD translations, rotation/shear and smooth nonradial fields | Spatial decomposition identifies shape, not the moving component |
| Guide response or attitude convention | Common rotation with a distinct relative-camera pattern | Measured attitude is supplied; controller/commanded-attitude reconstruction remains open |
| PSF/centroid or WCS-fitting bias | Magnitude/colour/pixel-phase dependence or large edge-localized residuals | Header maps alone cannot distinguish physical motion from estimator errors |
Tests that would make the paper's explanation stronger
- Re-measure reserved startup/interior/ending images with the same profile-centre convention and held-source support; compare spatial modes with header maps.
- Test a fixed model in another thermal/guiding regime; avoid repeatedly tuning against these two startups.
- Resolve sensor locations/calibration and timing; add explicitly identified driver/interface and on-chip channels only after checking their data quality.
- Test matched-temperature but different-history cases and predict a distinct spatial mode before attributing a component.
- Report coherent residuals against an independently measured noise floor. An unexplained but bounded residual is a valid result; it must not be labelled fully explained.
Conclusion: temperature is a useful predictor, and the residual's spatial shape narrows the next tests. Complete physical attribution and an independently verified full-orbit WCS accuracy budget are not yet established.