Bright-star rings and native-pixel transport: corrected reference test
What actually changes?
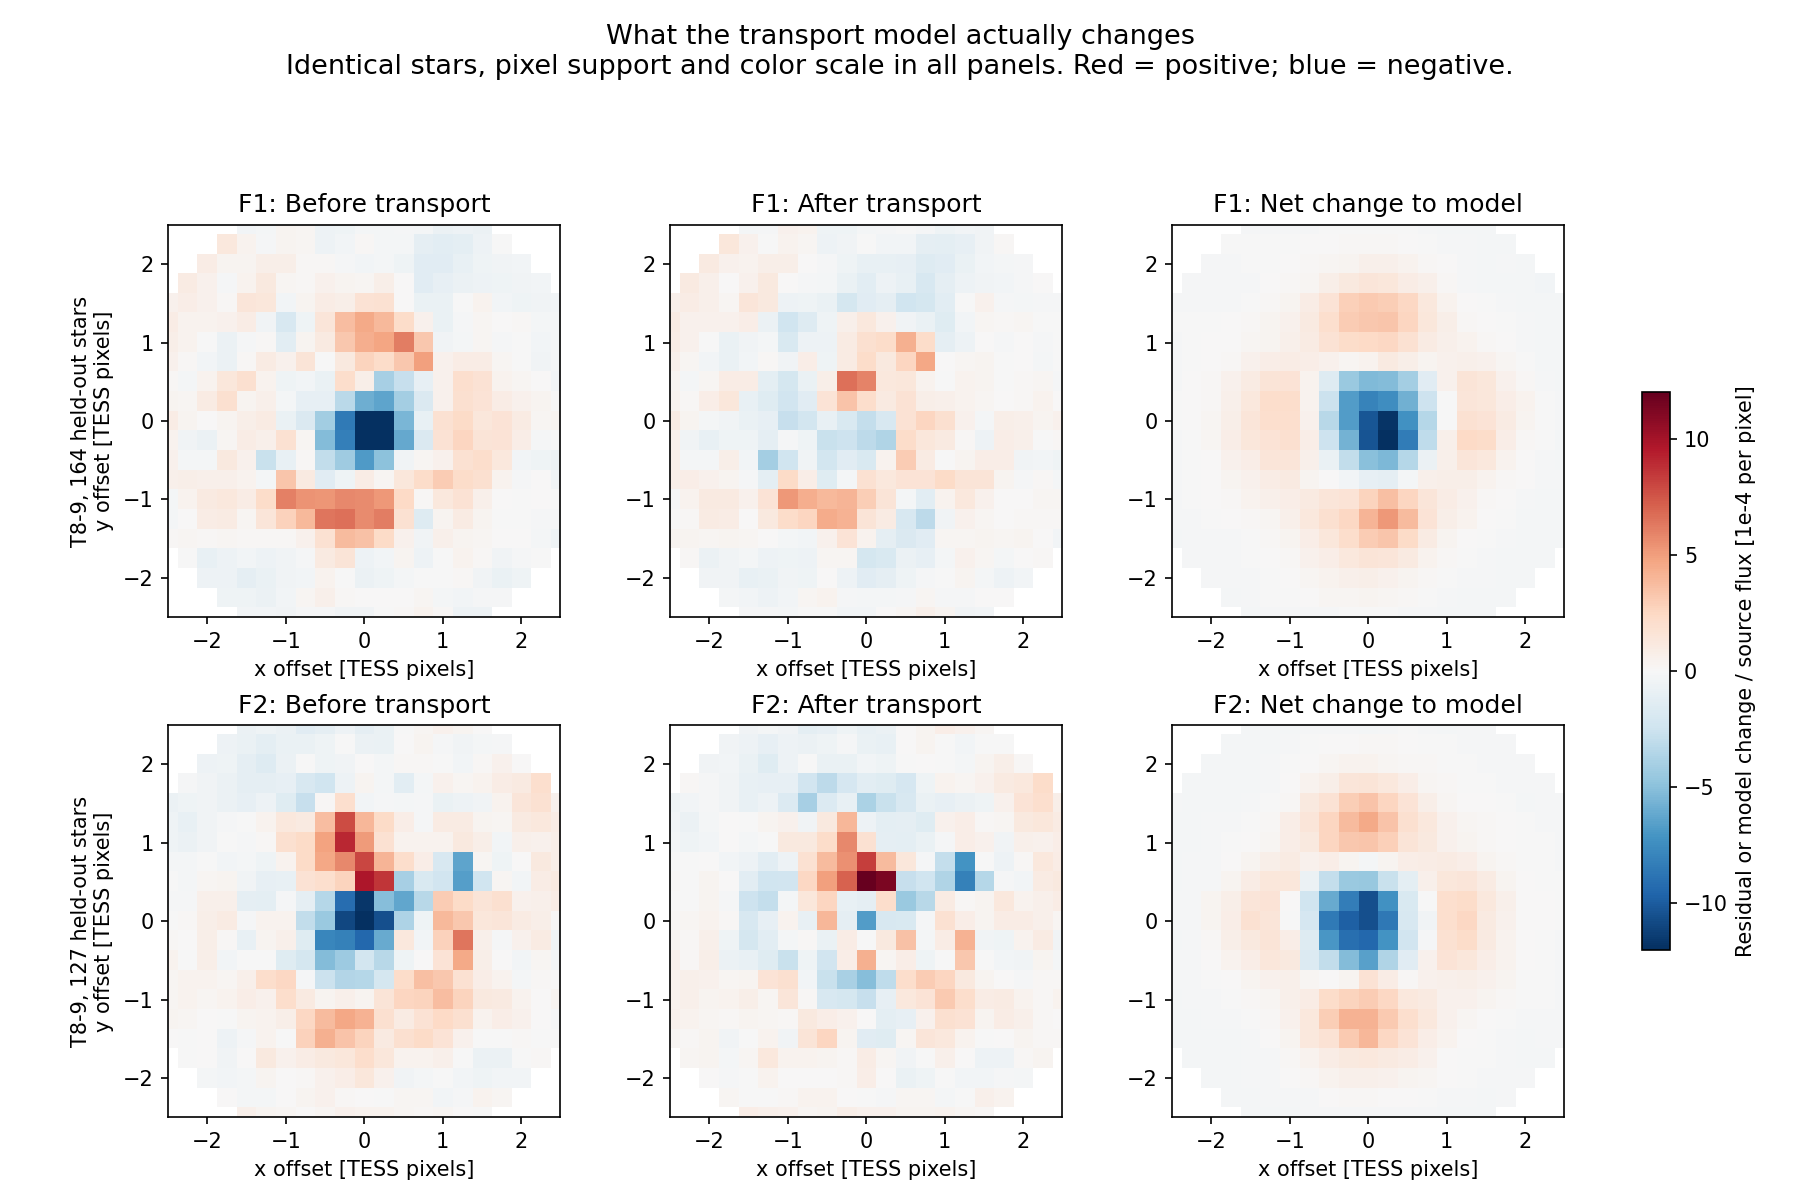
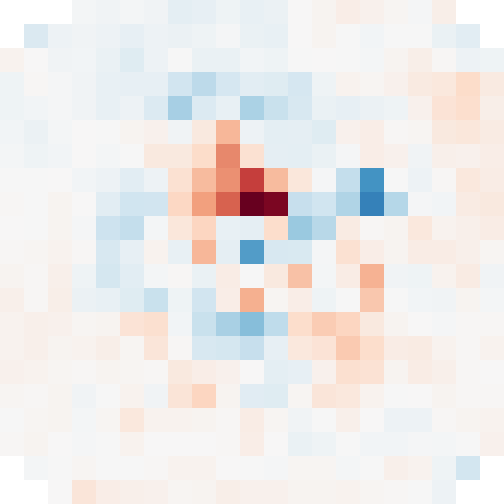
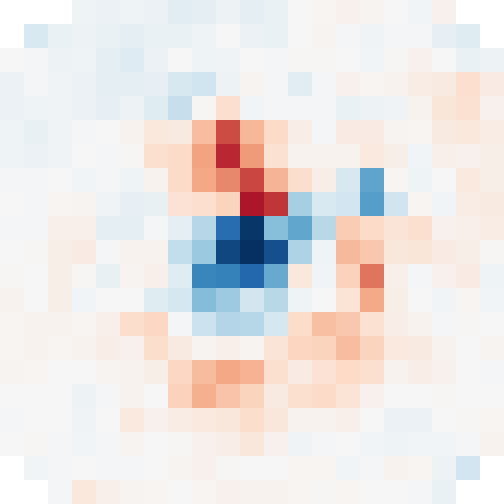
The correction changes the central hole, but it does not remove the whole residual pattern. The large red/blue asymmetric features remain. Compare before and after at the same location below.
The difference image below shows the net change to the fitted model, including re-fitted flux, position and background. It is not a direct image of transported electrons.
| Field | Core mean before | Core mean after |
|---|
| F1 | -6.29 | +0.27 |
| F2 | -4.84 | +1.60 |
Core means are averages inside radius 0.6 TESS pixels, in units of 10−4 of source flux per pixel. These are descriptive stacked-image values, not aperture flux biases or uncertainty estimates. F2 crosses into a positive core mean; the innermost pixel and asymmetric lobes remain imperfect.
Conclusion — 2026-10-08
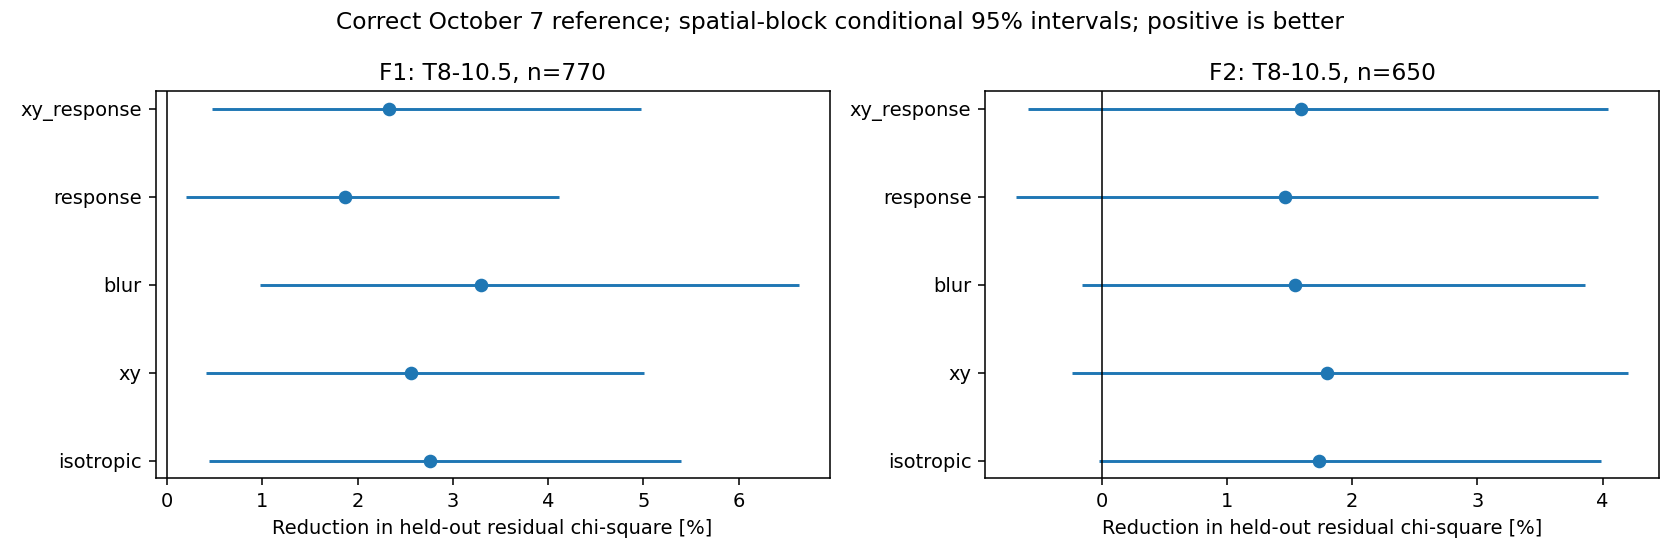
On the correct October 7 reference, x/y transport lowers held-out bright-star residual chi-square by 2.56% in F1 and 1.80% in F2. Only F1 excludes no improvement at the reported conditional 95% interval. The ring is visibly reduced, but the result does not establish transport as the physical cause or as superior to the smooth-blur control.
This report supersedes the interpretation of the historical A0 pilot. The first pilot used September 30 faint-only A0 fits, whereas the user was referring to the newer October 7 v8/Paper-1 residuals. Switching references, using an ordinary mean instead of the original clipped stack, and profiling nuisance parameters before displaying residuals made that an inappropriate visual comparison. No inference against the original bright-star ring follows from the historical pilot.
What the Claude history establishes
Transcript 0b28ddb4-ae56-4557-be06-68dce812027a, lines 360 and 575, identifies the v8 recipe (modeled omitted Gaia neighbors, bright-star weight cap, faint stars allowed to train shape), the bright central deficit/first-ring excess, and the fact that a smooth blur leaves a narrower central residual. Line 1689 extends the tests to the five-fold Paper-1 reference. The transcript's physical attribution is stronger than the morphology alone warrants; the observed residual is the evidence, not proof of transported electrons.
The corrected test uses all five held-out folds of F1 and F2 from paper1_final_fits_20261007, pin 677a6c5e9b690941d3aa07caefb789dacd6359ca, with the same evaluation scenes and W3 renderer. F1 is S24 C2K2; F2 is S20 C3K3. These fits include faint-star shape training but are not strictly faint-only: bright stars also contribute with capped weights. No retraining was done.
Every recovered star is held out of its reference ePSF fit. The native-pixel replay matches Claude's saved W3 per-star fluxes exactly; maximum relative discrepancy in saved raw residual chi-square is 5.28e-16. The baseline raster replay check is 6.78e-05 in normalized flux per pixel (see ring_reconciliation.json).
The per-star table replay and published-stack replay are distinct checks: the latter is not bit-identical. The published stack script separately re-solves flux with its zero-perturbation rendering hook. The audit's first row therefore uses the actual saved published baseline, rather than claiming that our new raster is an exact replacement. Its ring is reproduced in sign and morphology by the recovered native-pixel model; the small raster difference remains a limitation on precise stack-amplitude comparisons.
Where did the ring go?
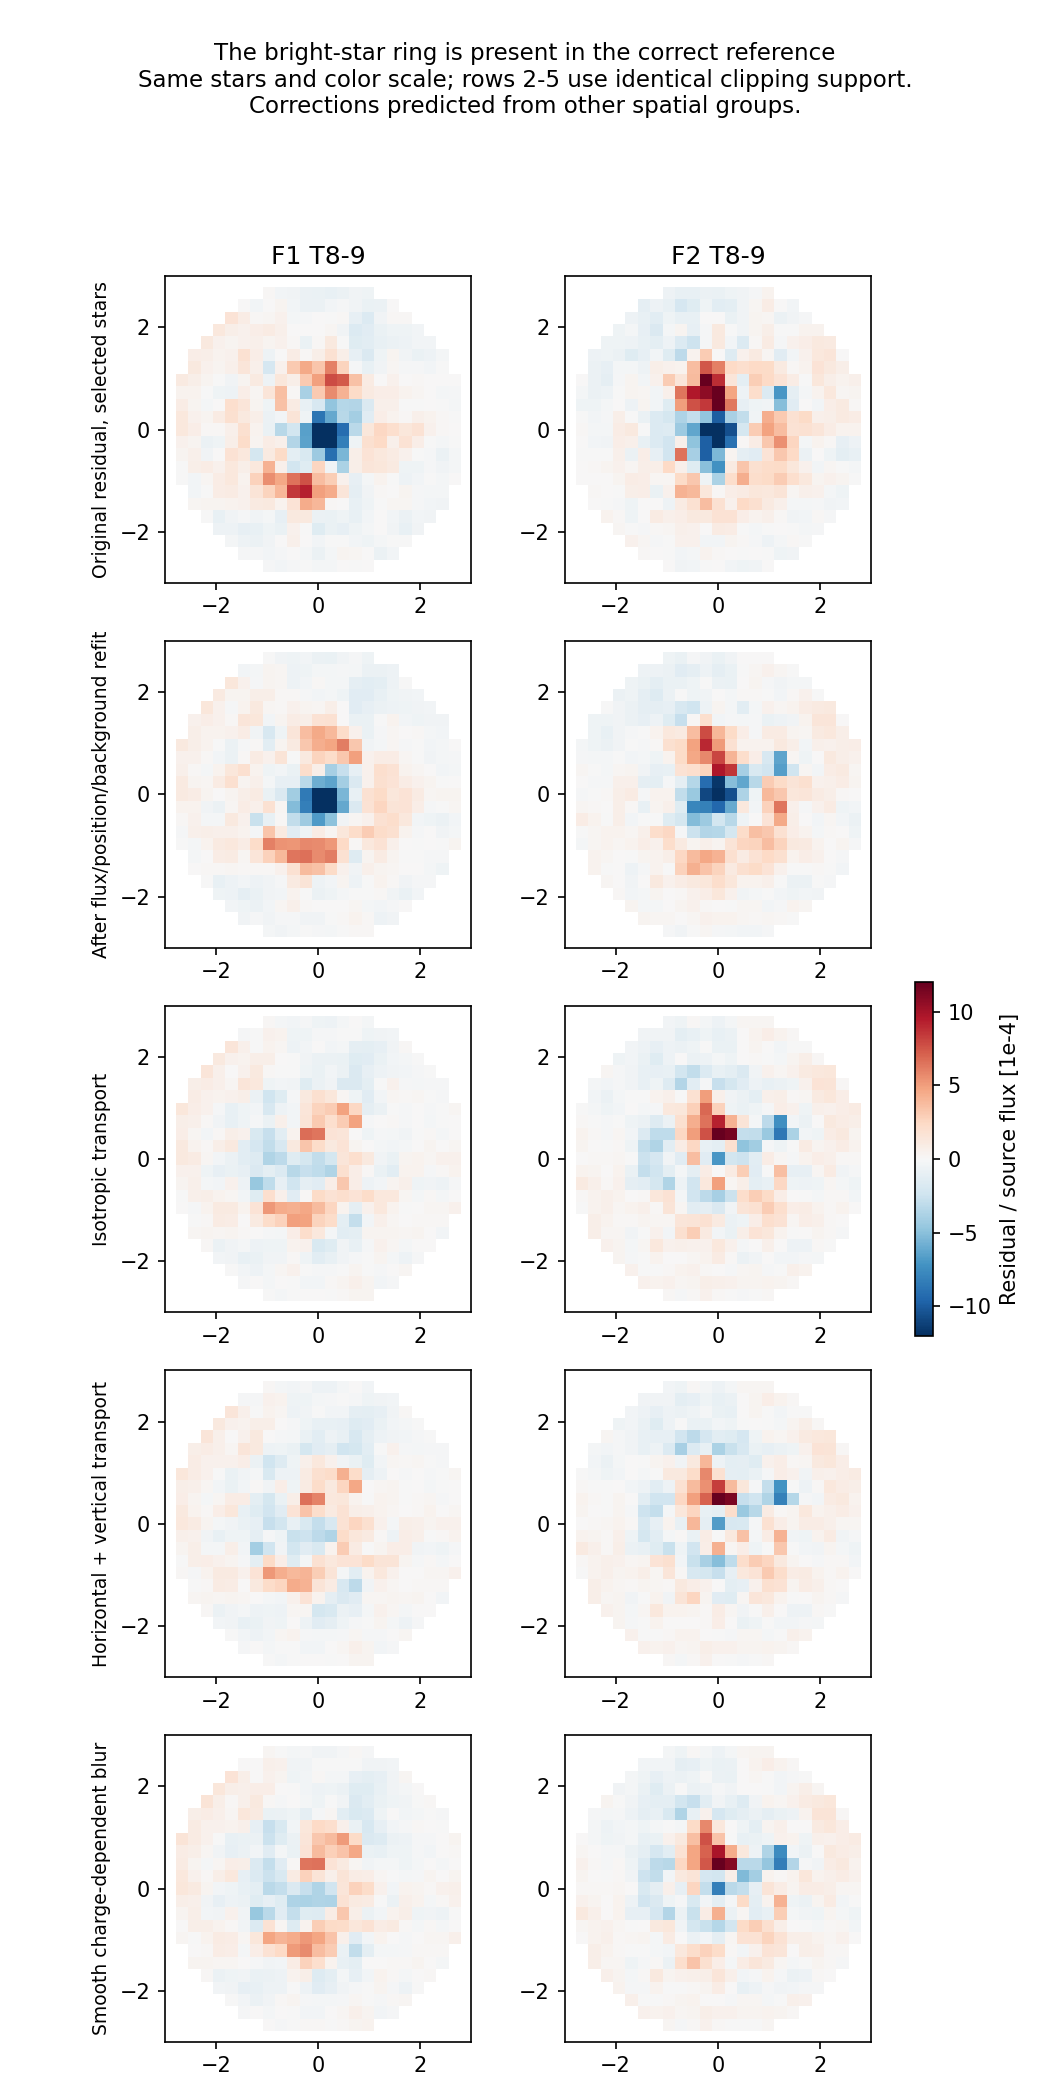
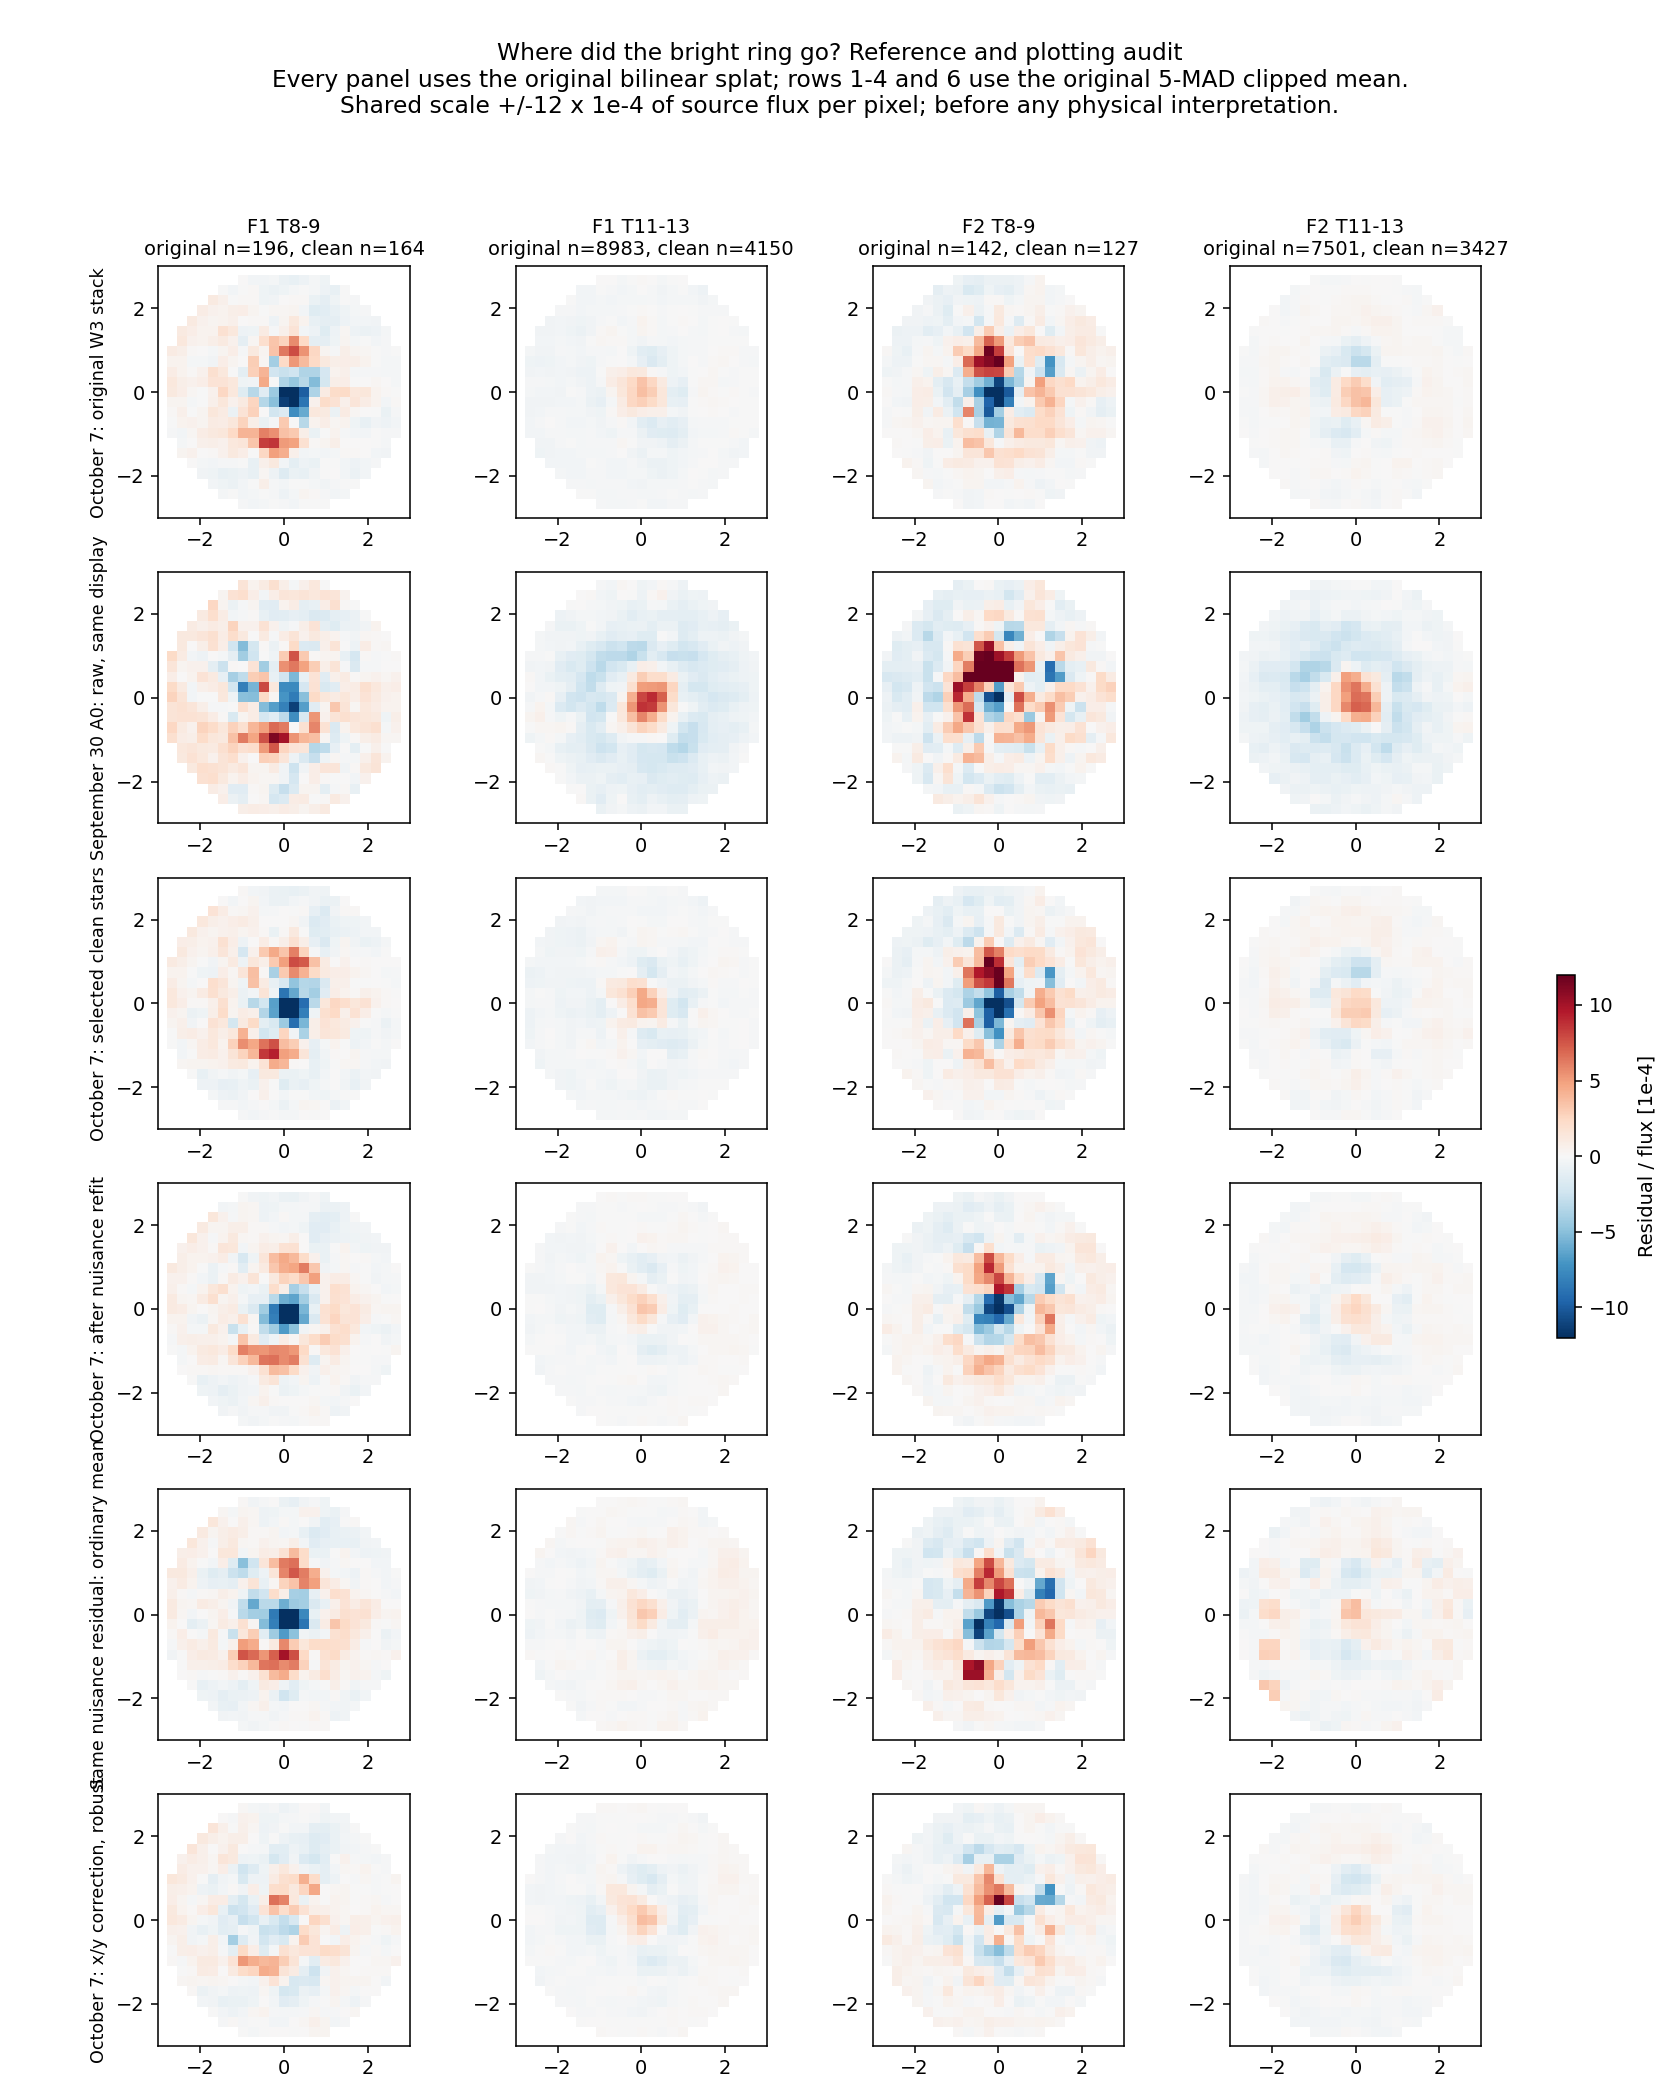
The first row is the original October 7 W3 baseline, before transport. The second row uses September 30 A0 residuals with the same display procedure. Rows 3–5 successively expose the clean-sample selection, nuisance refit, and ordinary-mean display. The last row applies the new correction on held-out spatial groups. All panels share a scale; they are not independently stretched. The full-star first row and selected-star rows have different counts stated in the titles. This explicitly prevents interpreting differences of sample or display as a transport result.
The audit shows that the newer bright ring survives both the clean-star selection and nuisance refitting. Nuisance fitting did not erase it. The main mismatch in the first pilot was the historical reference, compounded by changing the display estimator. The new transport reduces the central hole; directional residuals remain, and F2 can overshoot into a central excess. The faint residual is not removed.
Predictive scores on the correct reference
| Field |
Correction |
Reduction in held-out bright-star chi-square |
Conditional 95% interval |
| F1 |
isotropic |
+2.760% |
[+0.445, +5.395]% |
| F1 |
xy |
+2.559% |
[+0.405, +5.003]% |
| F1 |
blur |
+3.295% |
[+0.980, +6.633]% |
| F1 |
response |
+1.871% |
[+0.200, +4.118]% |
| F1 |
xy_response |
+2.333% |
[+0.474, +4.975]% |
| F2 |
isotropic |
+1.737% |
[-0.019, +3.985]% |
| F2 |
xy |
+1.798% |
[-0.237, +4.206]% |
| F2 |
blur |
+1.544% |
[-0.161, +3.858]% |
| F2 |
response |
+1.464% |
[-0.687, +3.960]% |
| F2 |
xy_response |
+1.592% |
[-0.590, +4.047]% |
These are reductions in summed inverse-noise-weighted native-pixel residual chi-square, not recovered flux accuracy. Calibration stars have T8–10.5. For each original ePSF fold, transport parameters are learned on four of five deterministic spatial groups and evaluated on the fifth. Confidence intervals resample detector tiles with fitted corrections fixed; they omit calibration-refit and ePSF-reference uncertainty.
Model and controls
The signed nearest-neighbor transfer is
$$T_{p\rightarrow r}=\kappa_d\,(Q_p^2-Q_r^2)/Q_0.$$
$T_{p\rightarrow r}$ is the electron transfer from pixel $p$ to adjacent pixel $r$ per short exposure. $Q_p,Q_r$ are the predicted pixel charges in electrons, formed from the summed saved scene model using a 2-second charge proxy. $Q_0=10^4\,\mathrm{e^-}$ is a fixed scale. $\kappa_d$ is the dimensionless coefficient for horizontal or vertical boundaries; it is fitted either identically in both directions or separately. All pair transfers use the original charge image, subtract from one pixel and add to the other, conserving charge. This is a nonlinear-diffusion approximation, not an electrostatic boundary kernel.
The same native pixels and amplitude, x/y-position and constant-background nuisance parameters are used for each correction arm. Primary centroid and blur derivatives come from the exact pinned renderer, rather than finite differences of a native stamp. The fit is a first-order residual model; a full nonlinear source-flux/position rerender with transport was not performed. Shared transport coefficients are constrained nonnegative; per-star unconstrained coefficients are diagnostic only.
isotropic has one transport coefficient; xy has two; blur is the original smooth blur generator scaled by peak charge, without a fitted width offset; response is a negative quadratic pixel-response term; xy_response fits transport and that response together. Coefficients in output tables/plots are expressed in units of $10^{-3}$ of the dimensionless parameter. The response control is a shape test, not a measured electronic calibration.
The fixed clean sample requires T8–13, positive source flux, at least 20 valid pixels within radius 3 pixels, no masked pixels within radius 2, and modeled neighbor contamination below 1% within radius 4. Unmodeled or template-removed light may remain. Faint controls at T11–13 were not used to learn the bright shared coefficients.
Numerical validation and limits
- F1: paired x/y-versus-blur chi-square ratio 1.007603, conditional 95% interval [1.001222, 1.014385]; below one would favor transport.
- F2: paired x/y-versus-blur chi-square ratio 0.997421, conditional 95% interval [0.989684, 1.004922]; below one would favor transport.
- F1: 5332 clean evaluation stars, 770 bright stars. Conservation error 1e-15; doubling the charge gives exactly four times the transfer in the test. Injecting transport coefficients (1.0, 0.6) in units of 1e-3 recovers (0.9977, 0.5977).
- F1: noise-only coefficients (0.0016, 0.0010), formal errors (0.0019, 0.0020). These conditional tests reuse the same stellar profile; they do not prove the physical model.
- F1: approximate finite-faint-charge pivot gives held-out bright chi-square ratio 0.974045, interval [0.947285, 0.994757]. Median faint reduced chi-square is 11.97 at T11–12 and 4.25 at T12–13 after nuisance profiling; the base profile is not assumed to be exact low-charge truth.
- F2: 4401 clean evaluation stars, 650 bright stars. Conservation error 7.9e-16; doubling the charge gives exactly four times the transfer in the test. Injecting transport coefficients (1.0, 0.6) in units of 1e-3 recovers (1.0001, 0.6008).
- F2: noise-only coefficients (-0.0006, -0.0001), formal errors (0.0017, 0.0018). These conditional tests reuse the same stellar profile; they do not prove the physical model.
- F2: approximate finite-faint-charge pivot gives held-out bright chi-square ratio 0.982150, interval [0.956998, 1.001729]. Median faint reduced chi-square is 8.25 at T11–12 and 2.59 at T12–13 after nuisance profiling; the base profile is not assumed to be exact low-charge truth.
Other controls are saved in the summaries: assumed sky rates 20/100 e-/s/pixel, native finite-difference versus exact centroid derivatives, fixed normalized shape weights, color and subpixel-phase splits, stricter modeled crowding, response-only injection, and leakage of a charge-independent shape defect into transport. These are sensitivities, not additional independent discoveries. The finite-charge pivot uses the median faint-star peak charge per original fold and is not a calibrated zero-charge reconstruction.
The original comparison display uses bilinear splatting and a 5-MAD-clipped mean. The new full diagnostic grids additionally show ordinary mean stacks of native samples binned by phase; those grids are deliberately labeled and are not a reproduction of the original display estimator. Numerical fitting/scoring never uses the display raster. Color grids use the saved Gaia-XP coordinate: blue below 0.8, mid 0.8–1.2, red at or above 1.2. Sparse bright/color/spatial panels cannot establish local effects.
These are historical difference images, not full incident detector-charge images. Physical sky and all removed-source light are not reconstructed. No saturation model, time-resolved coaddition, cosmic-ray clipping, independent detector-response calibration, absolute flux-truth test, or temporal signal-preservation test was performed. No production images or model parameters were modified.
Full images and per-star diagnostics
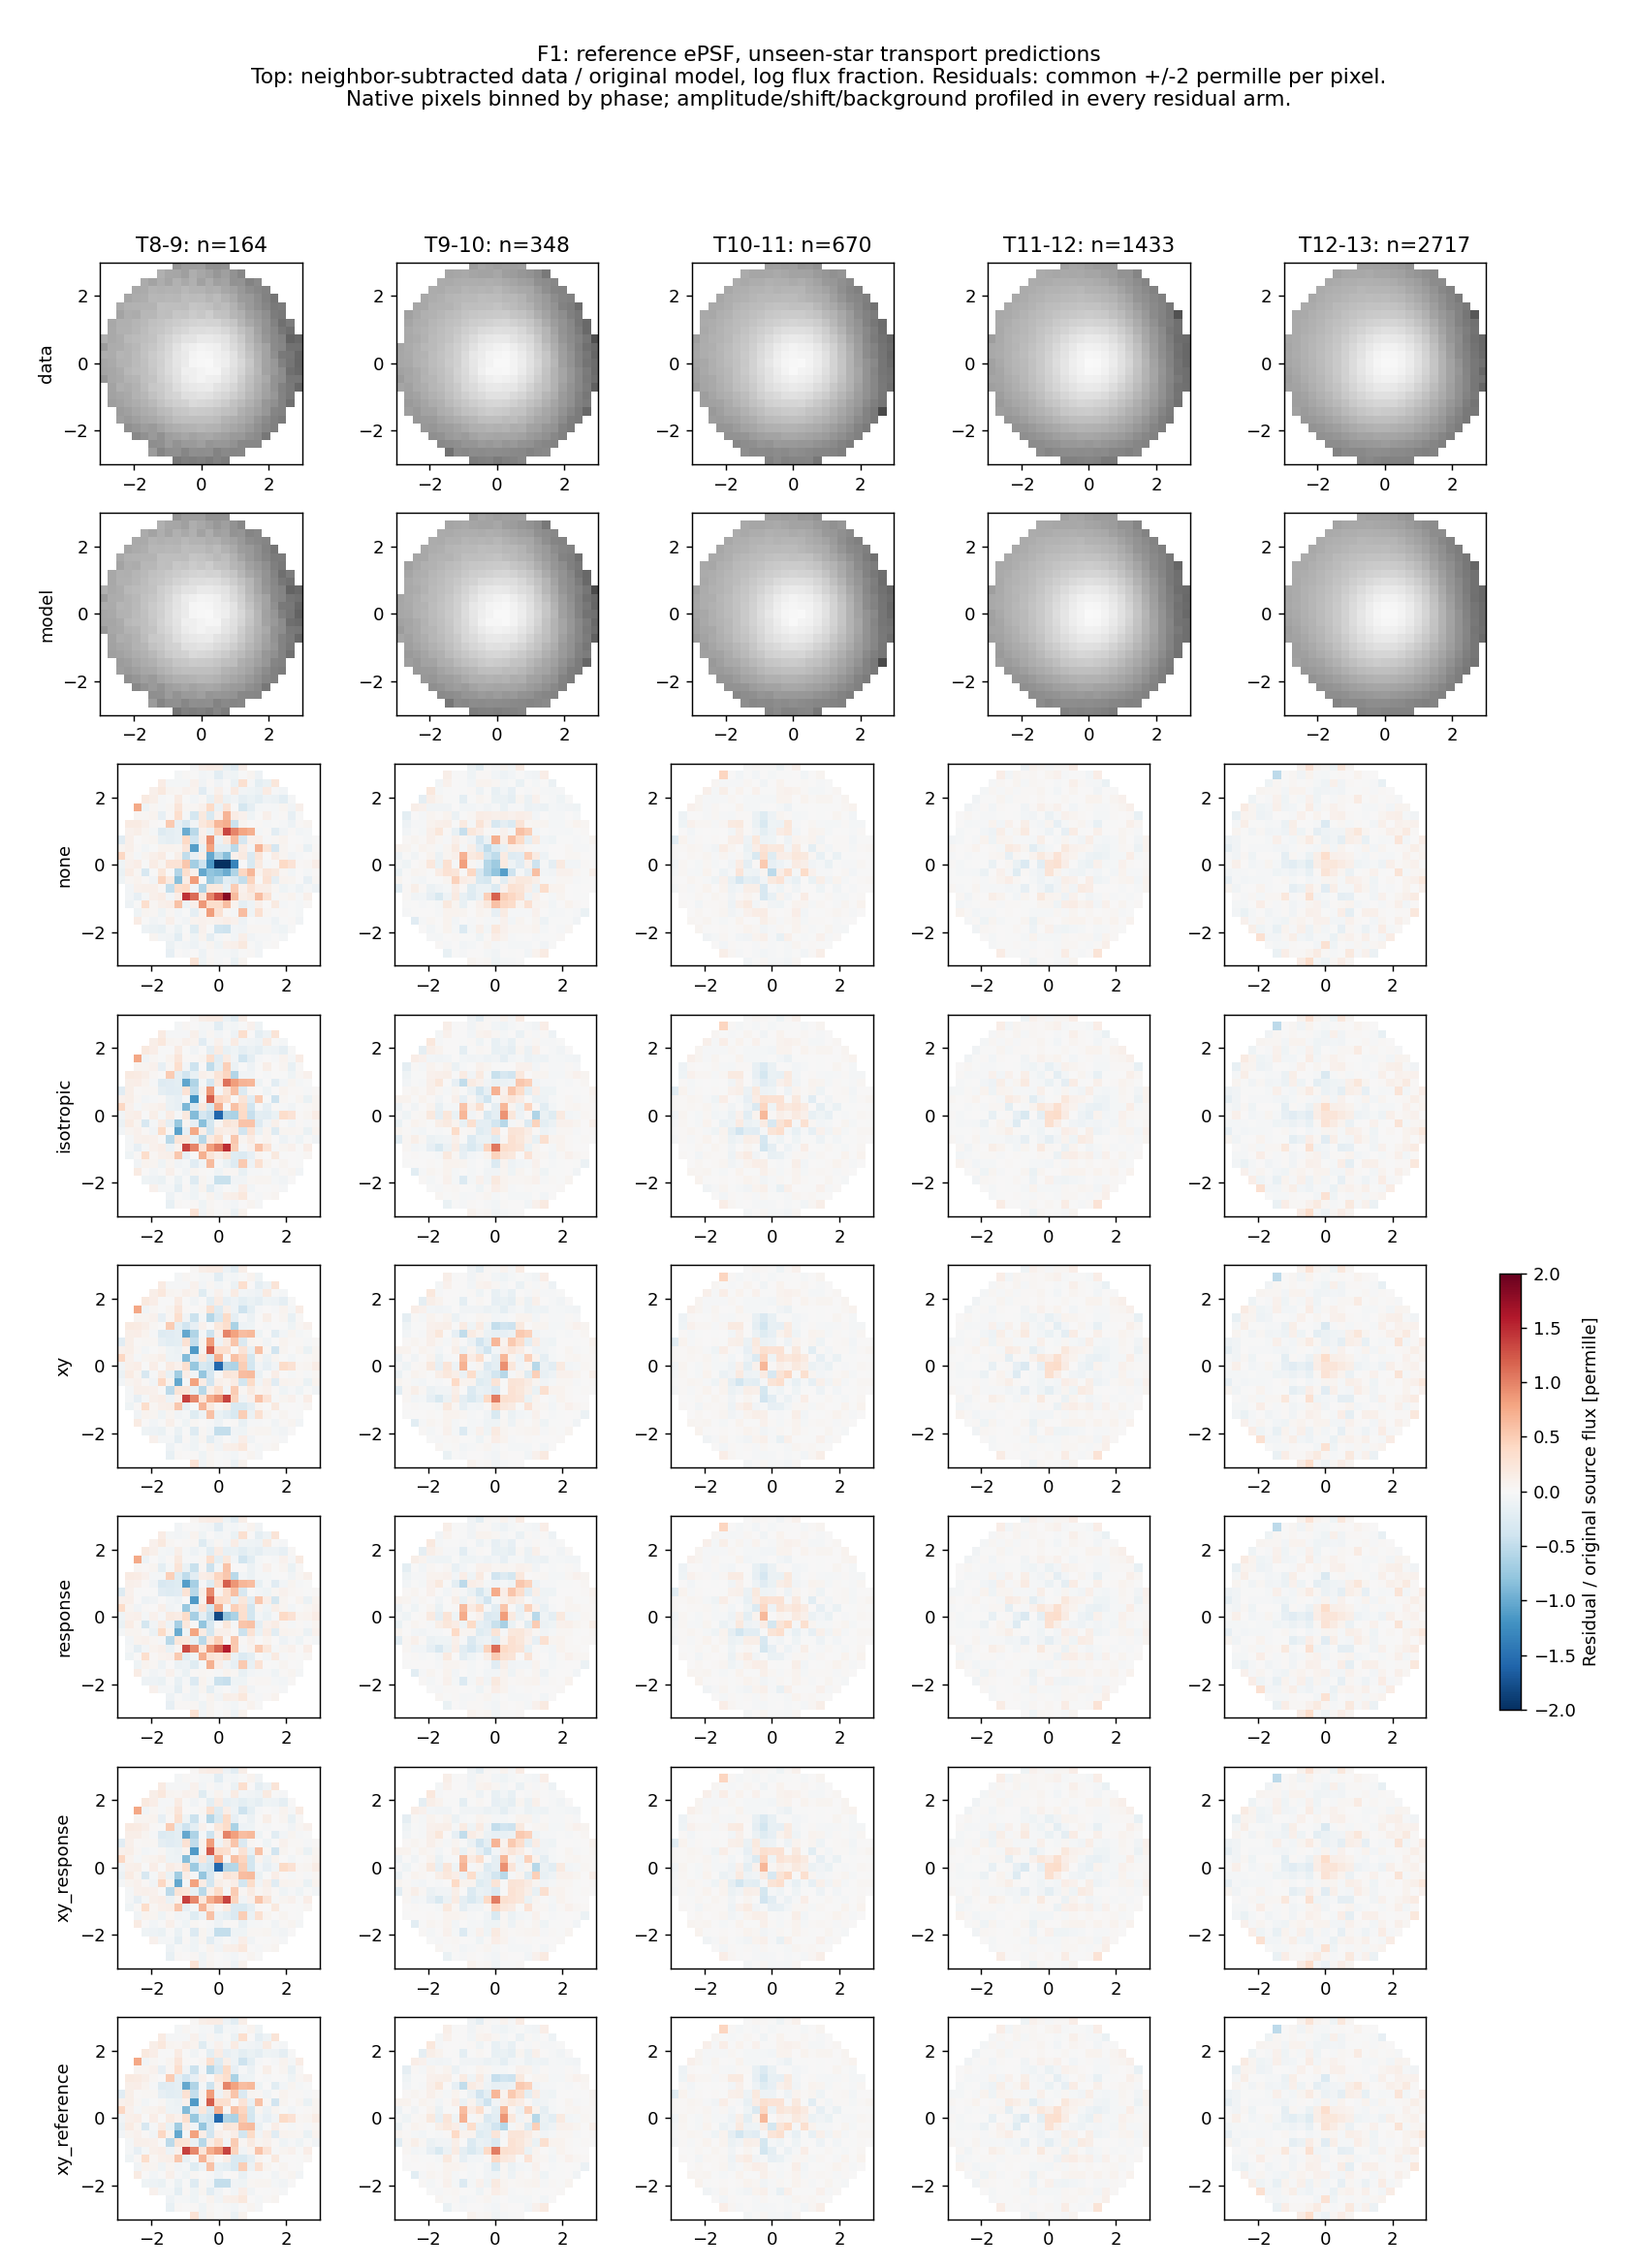
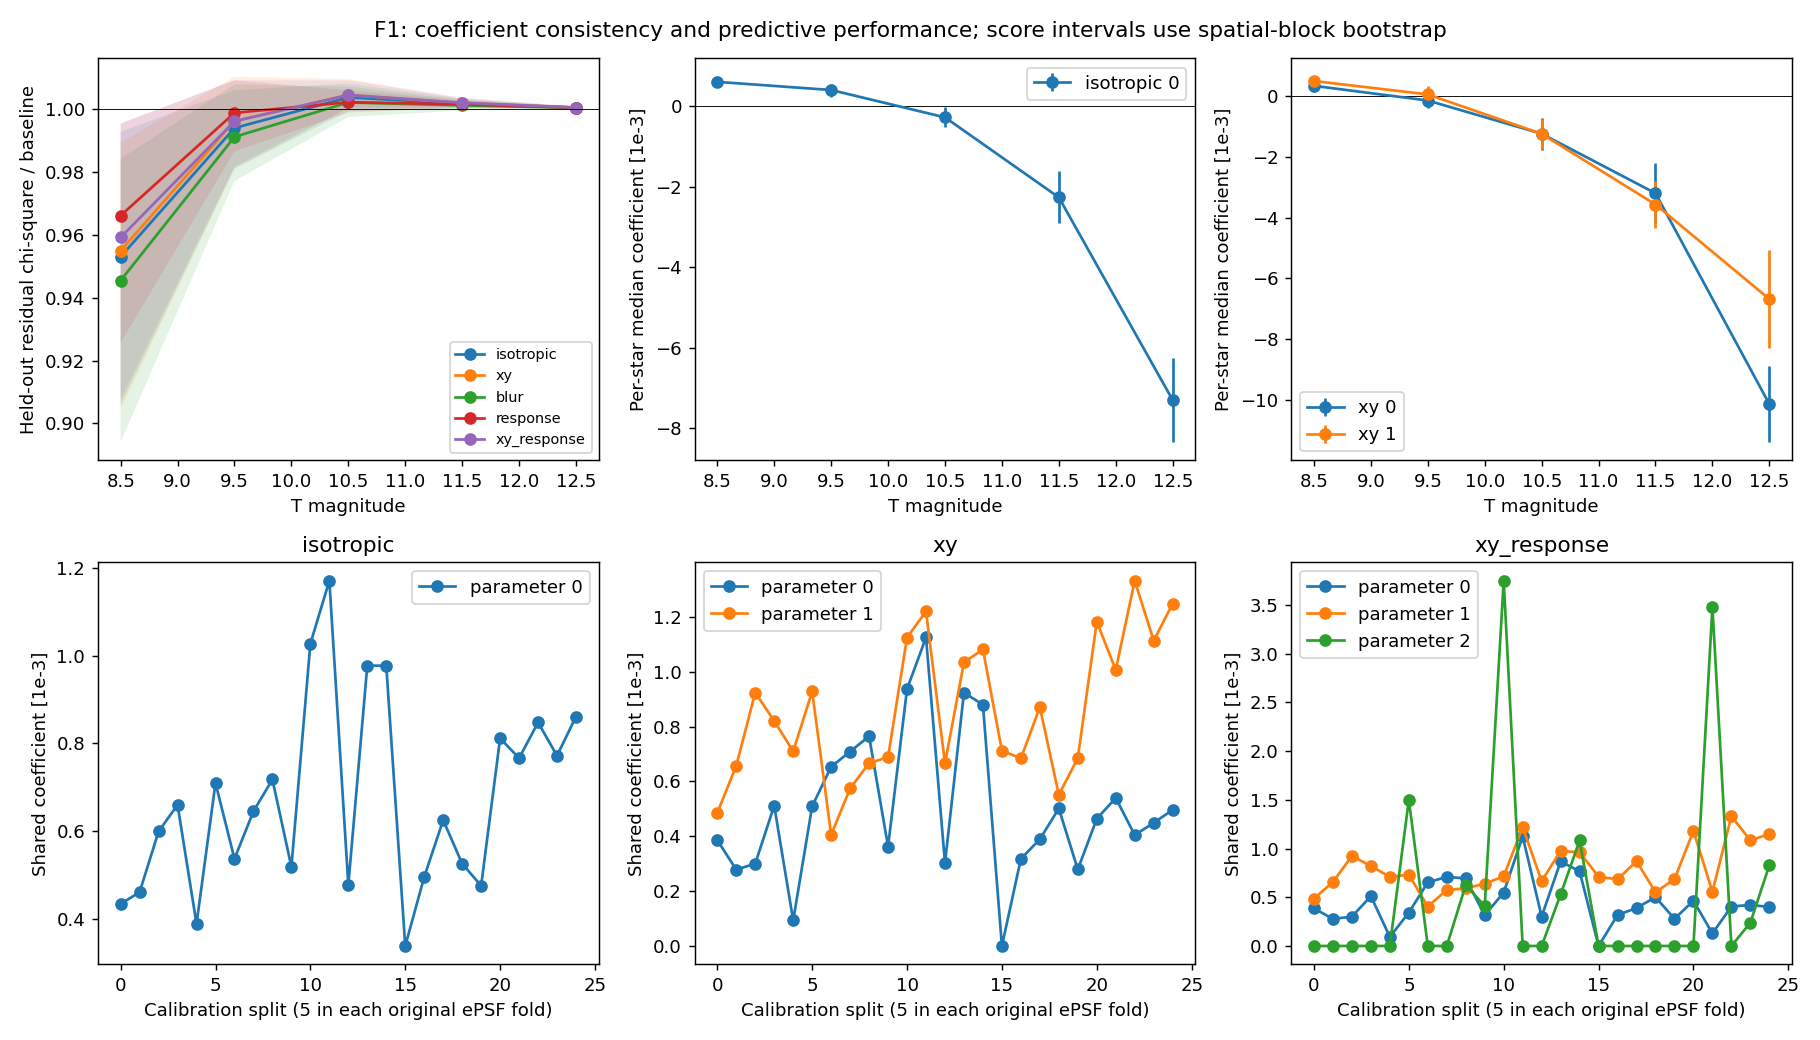
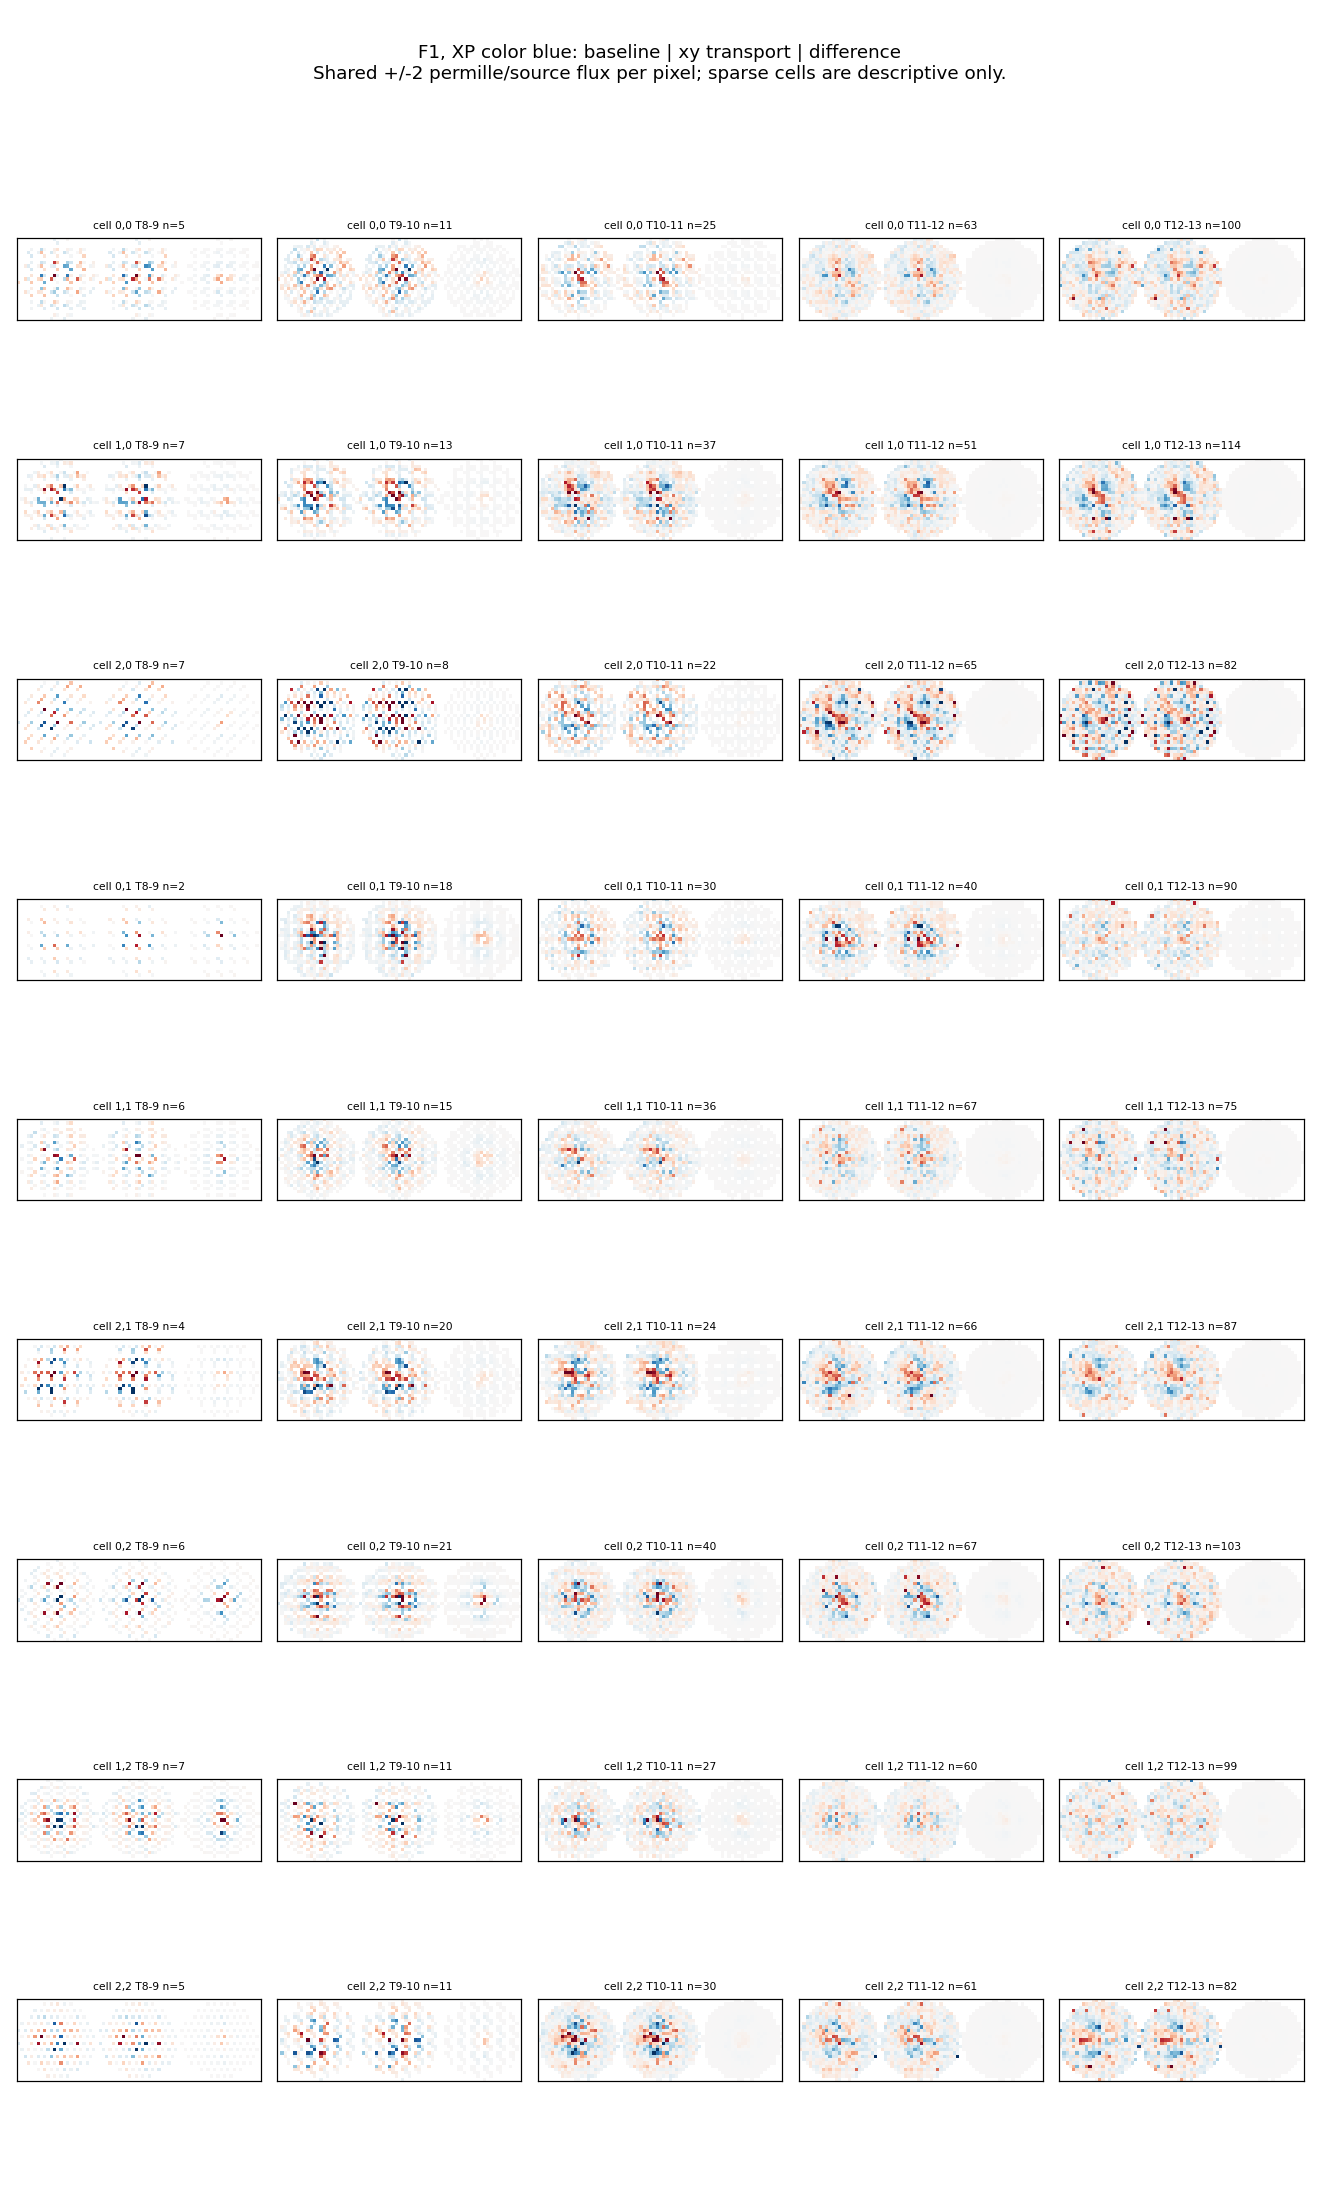
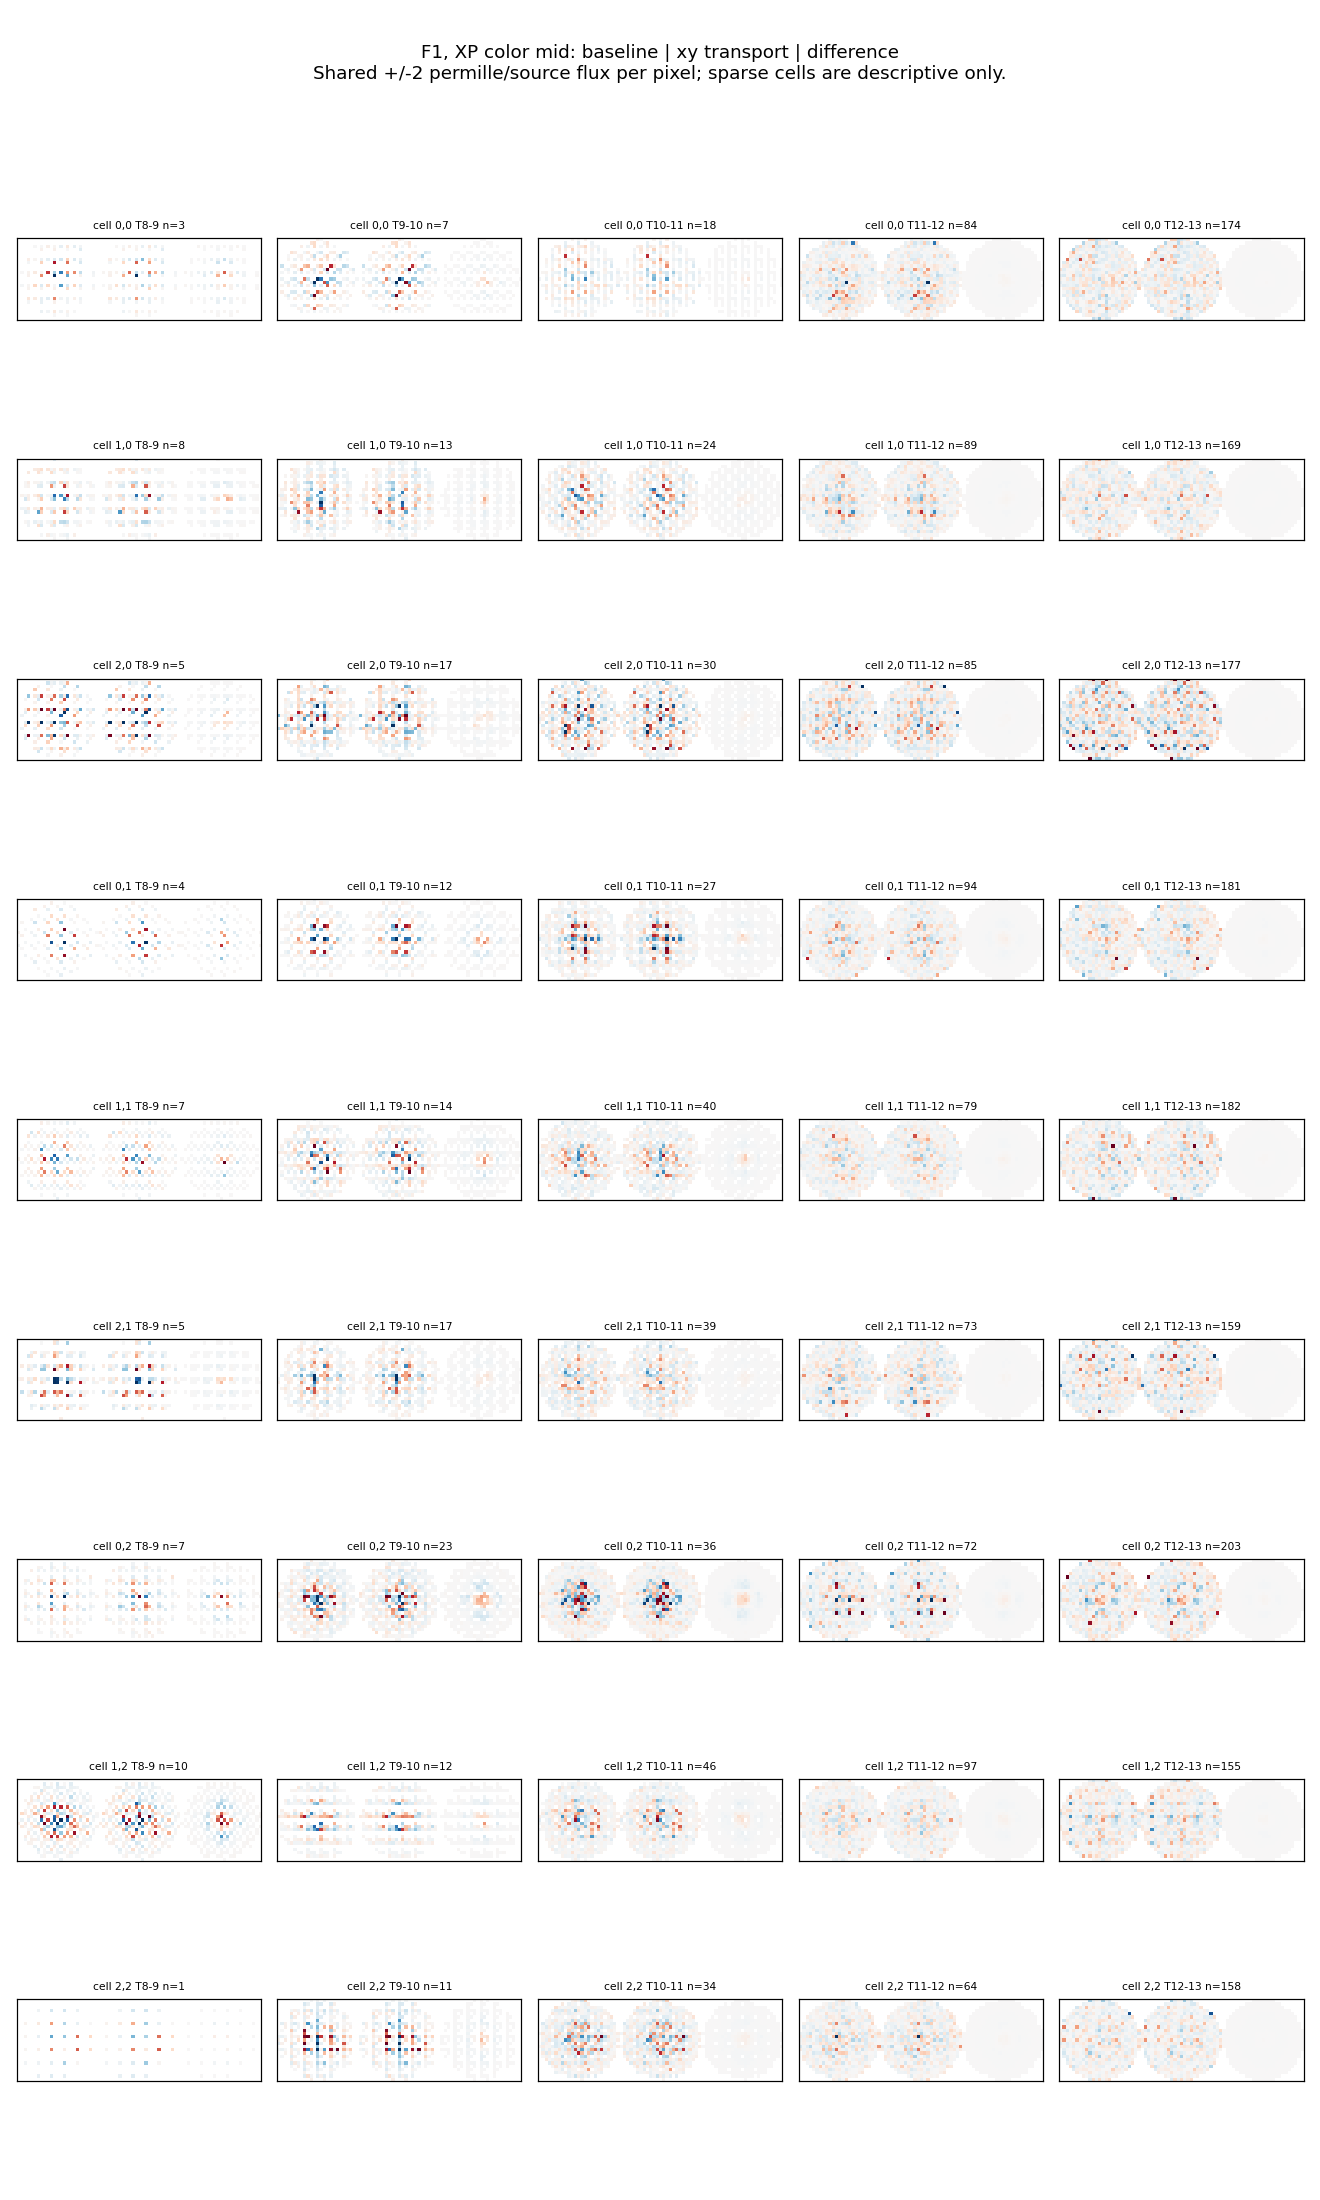
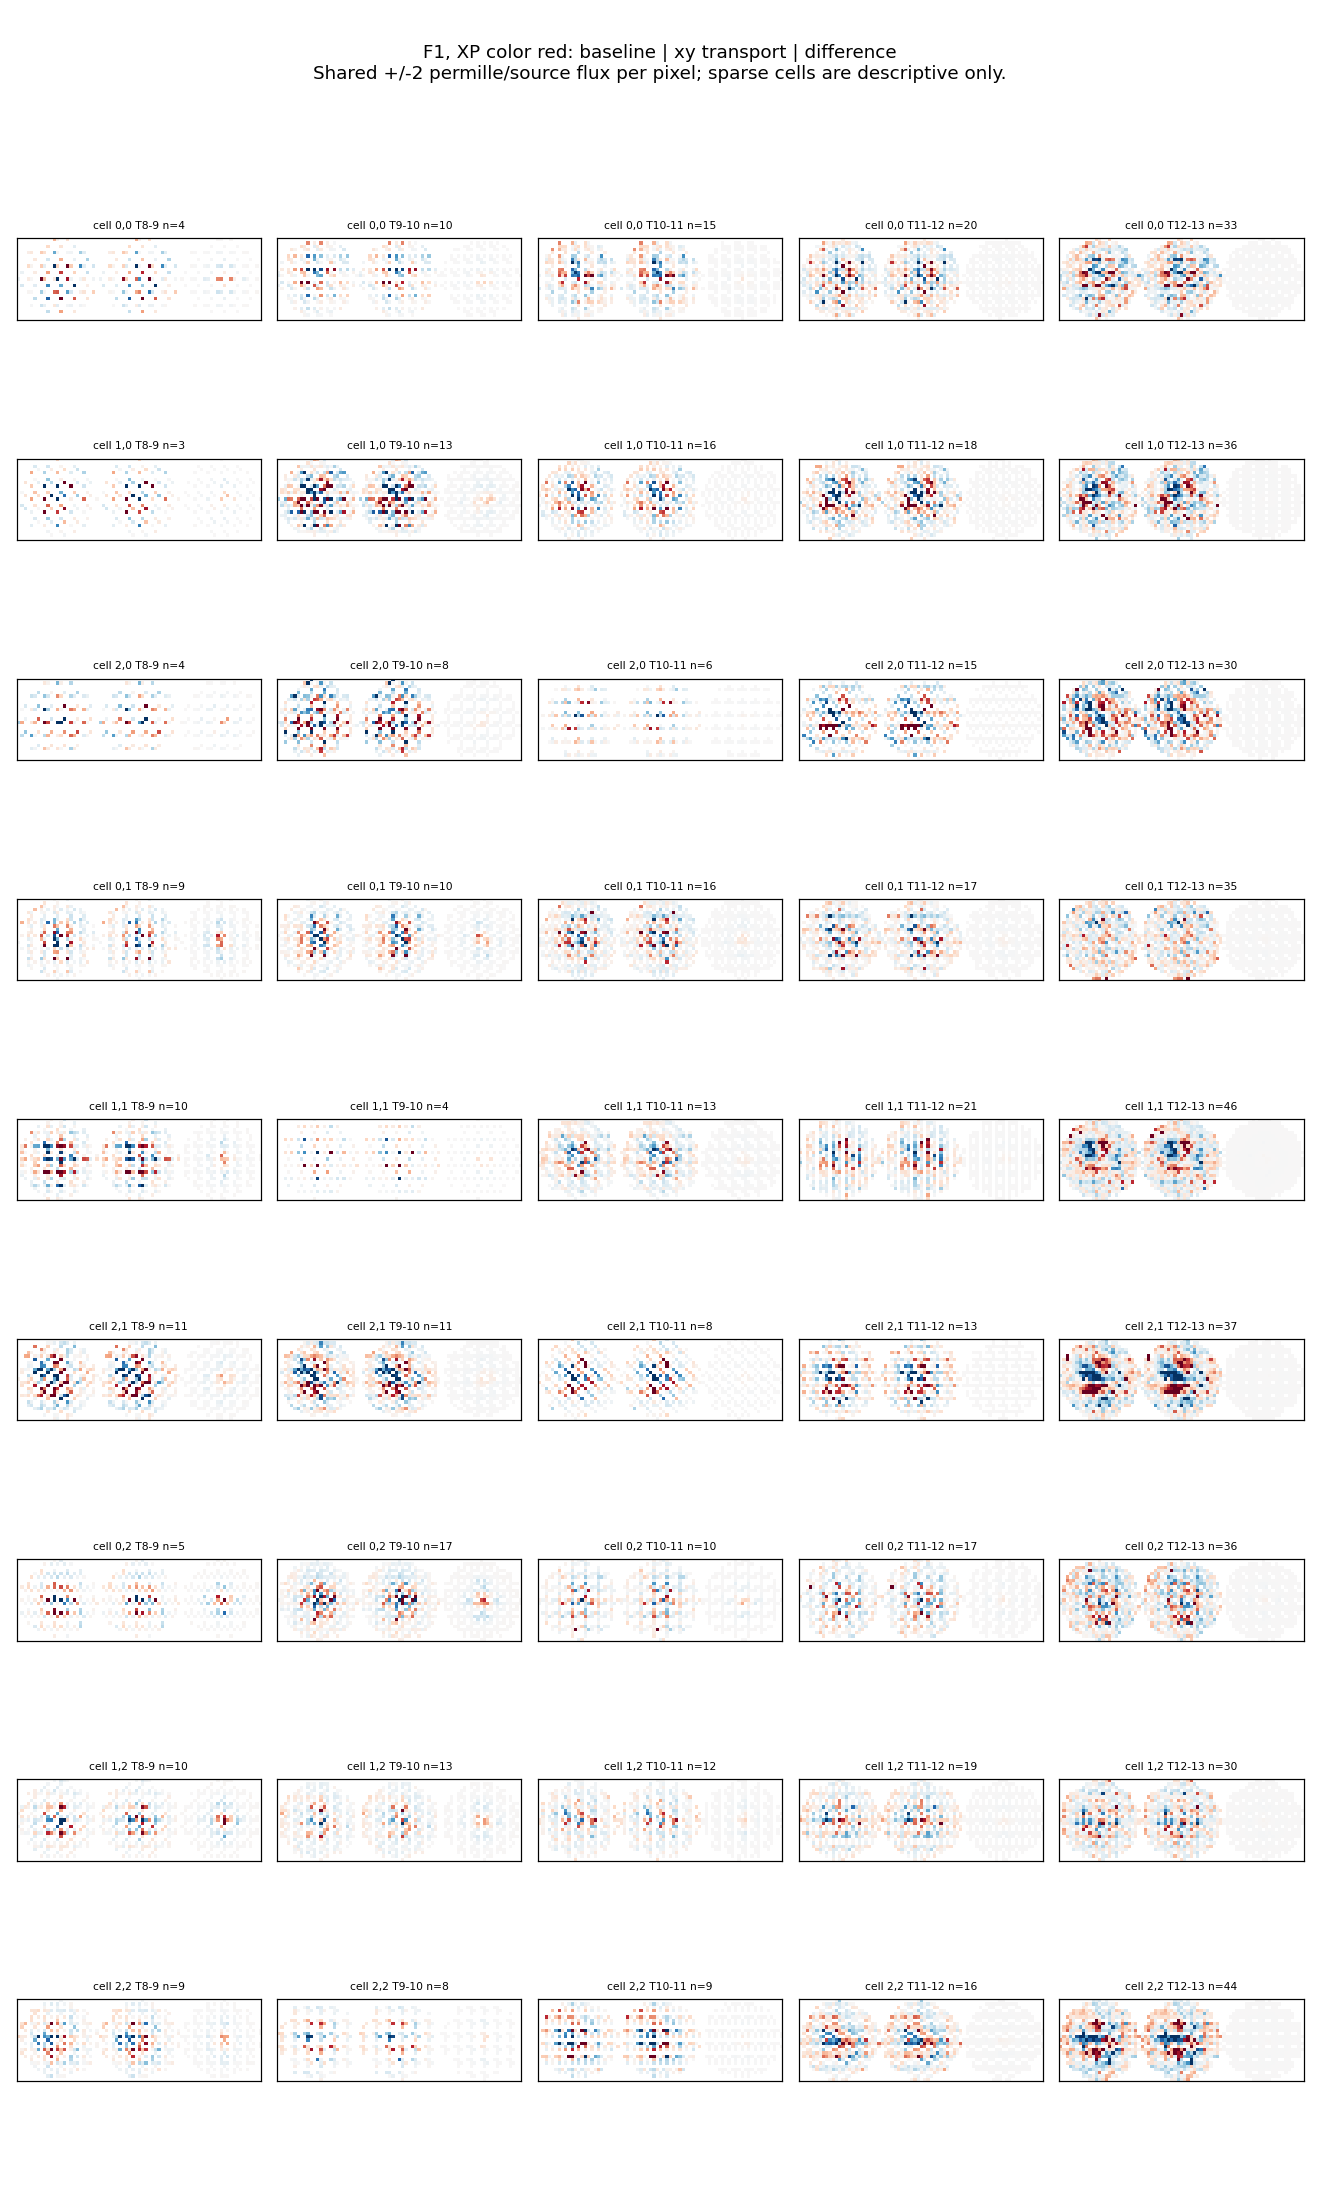
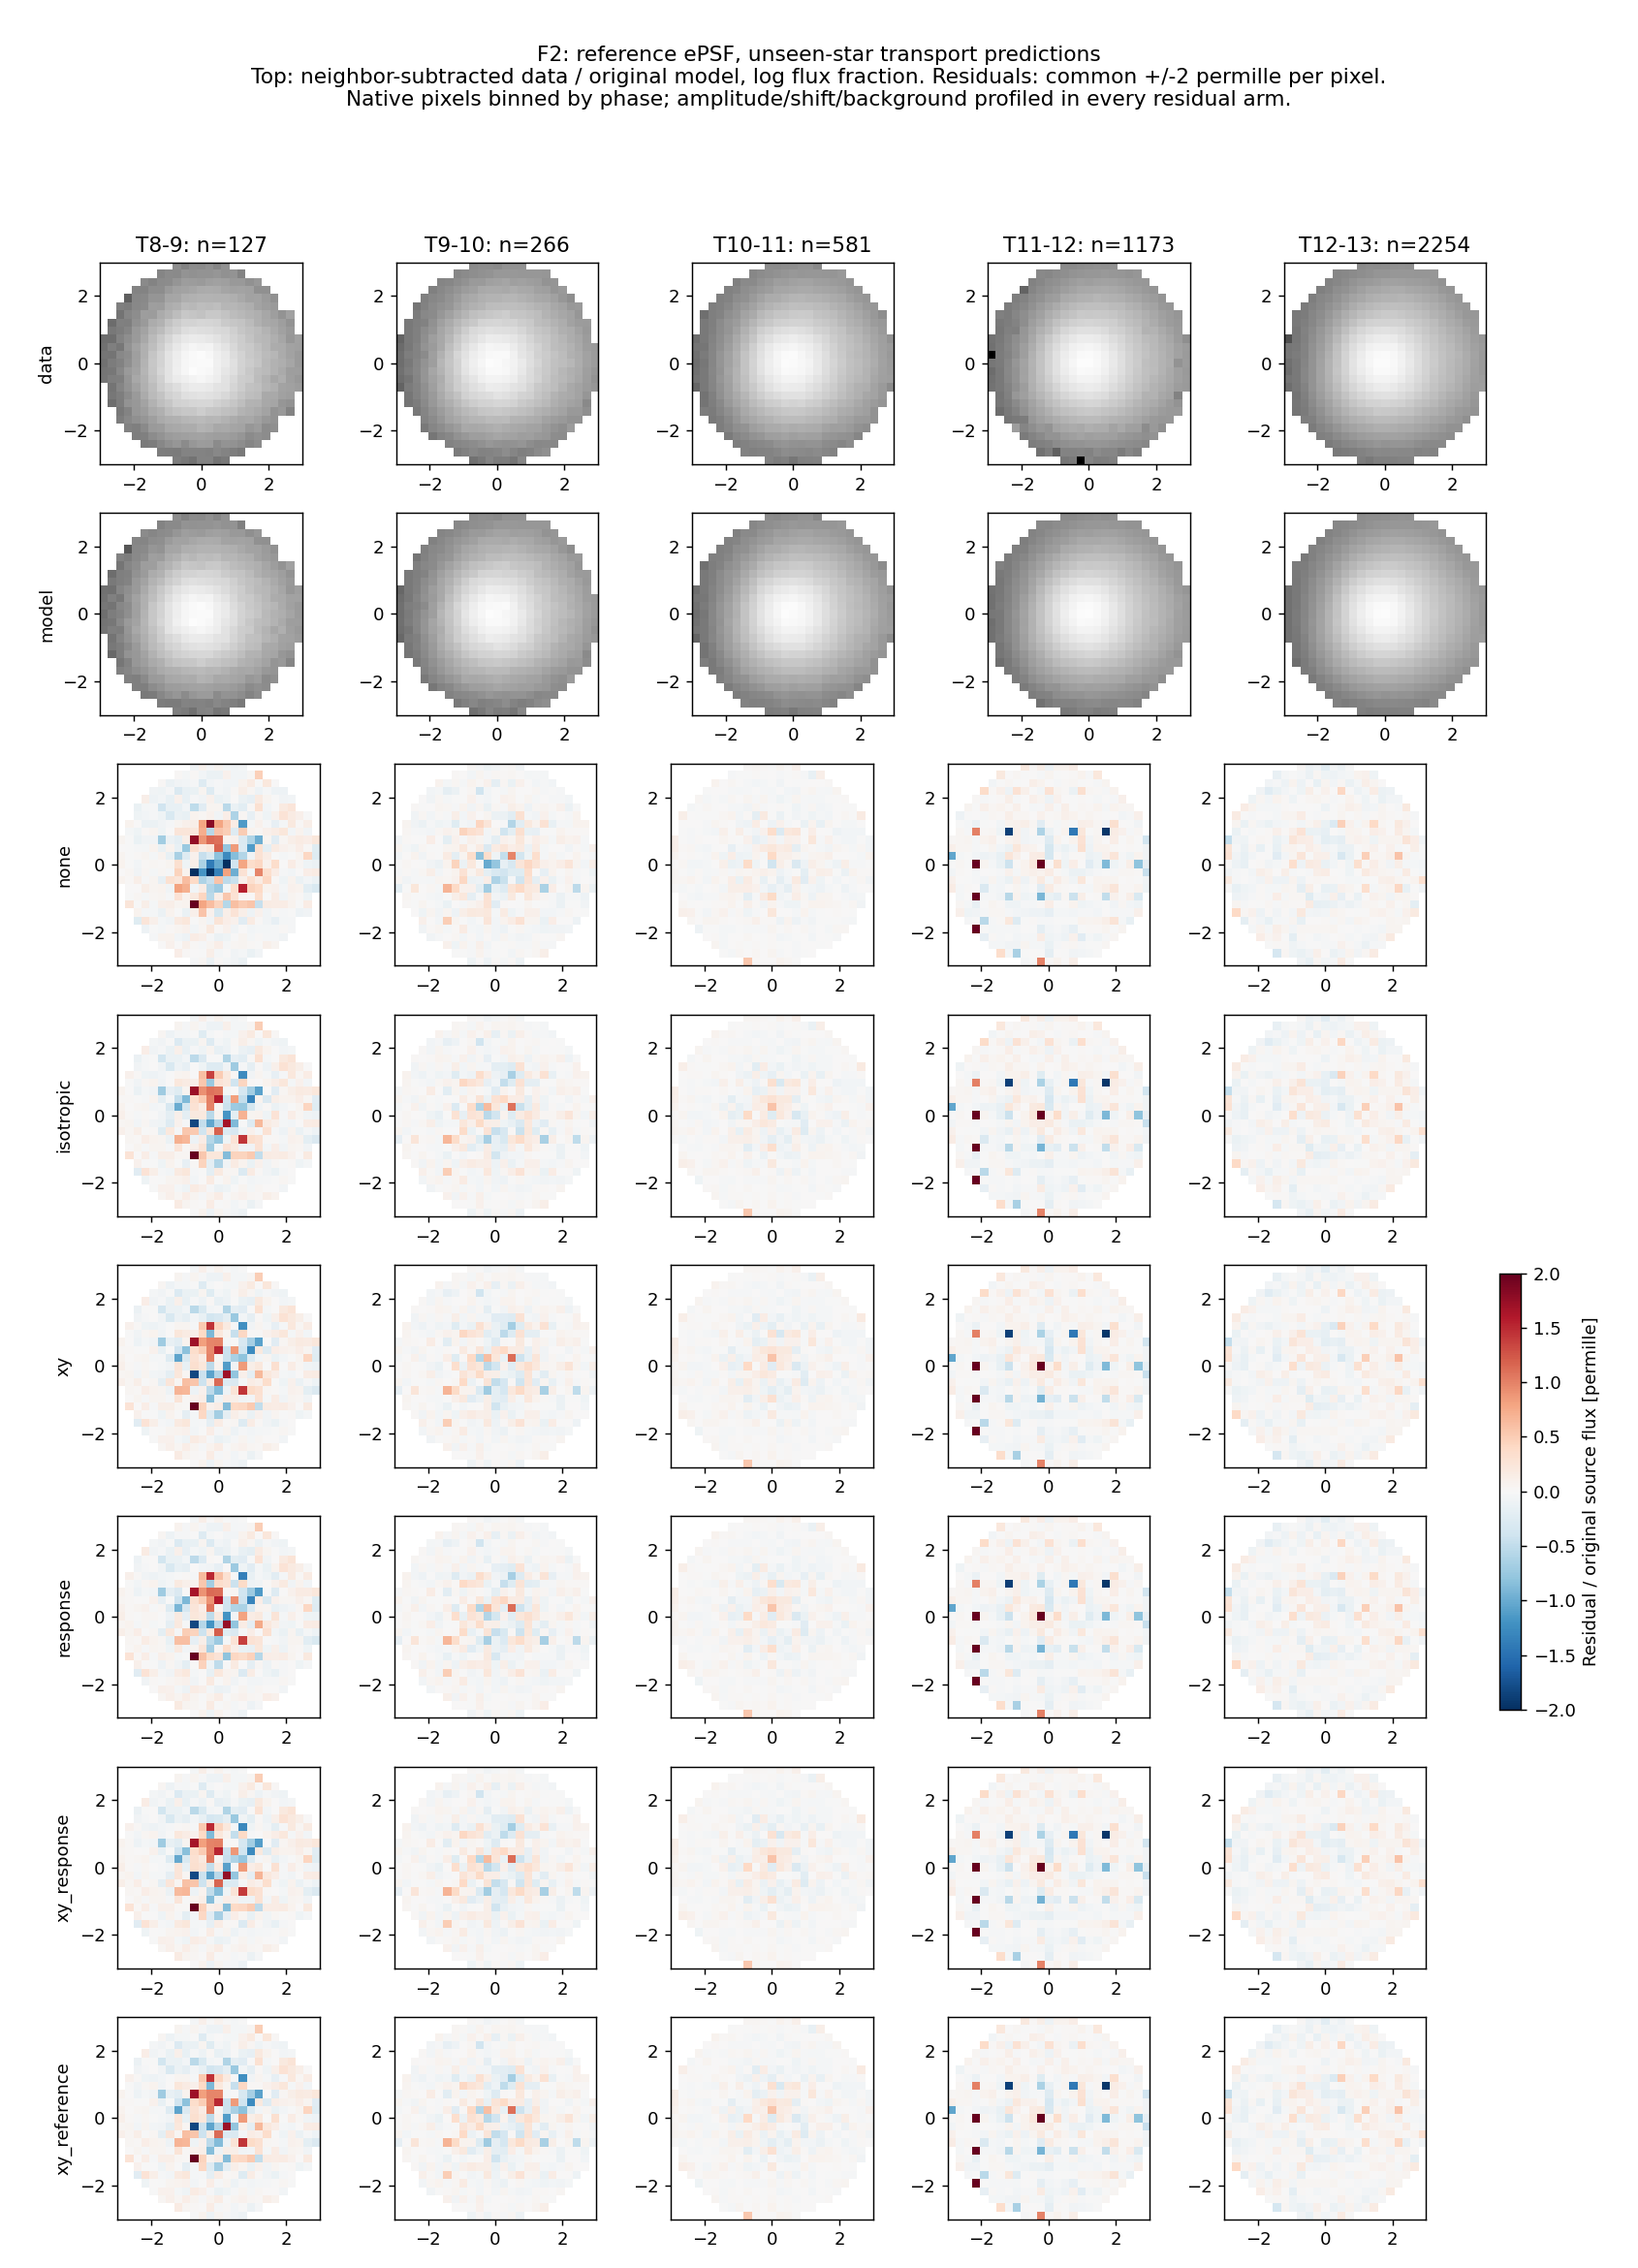
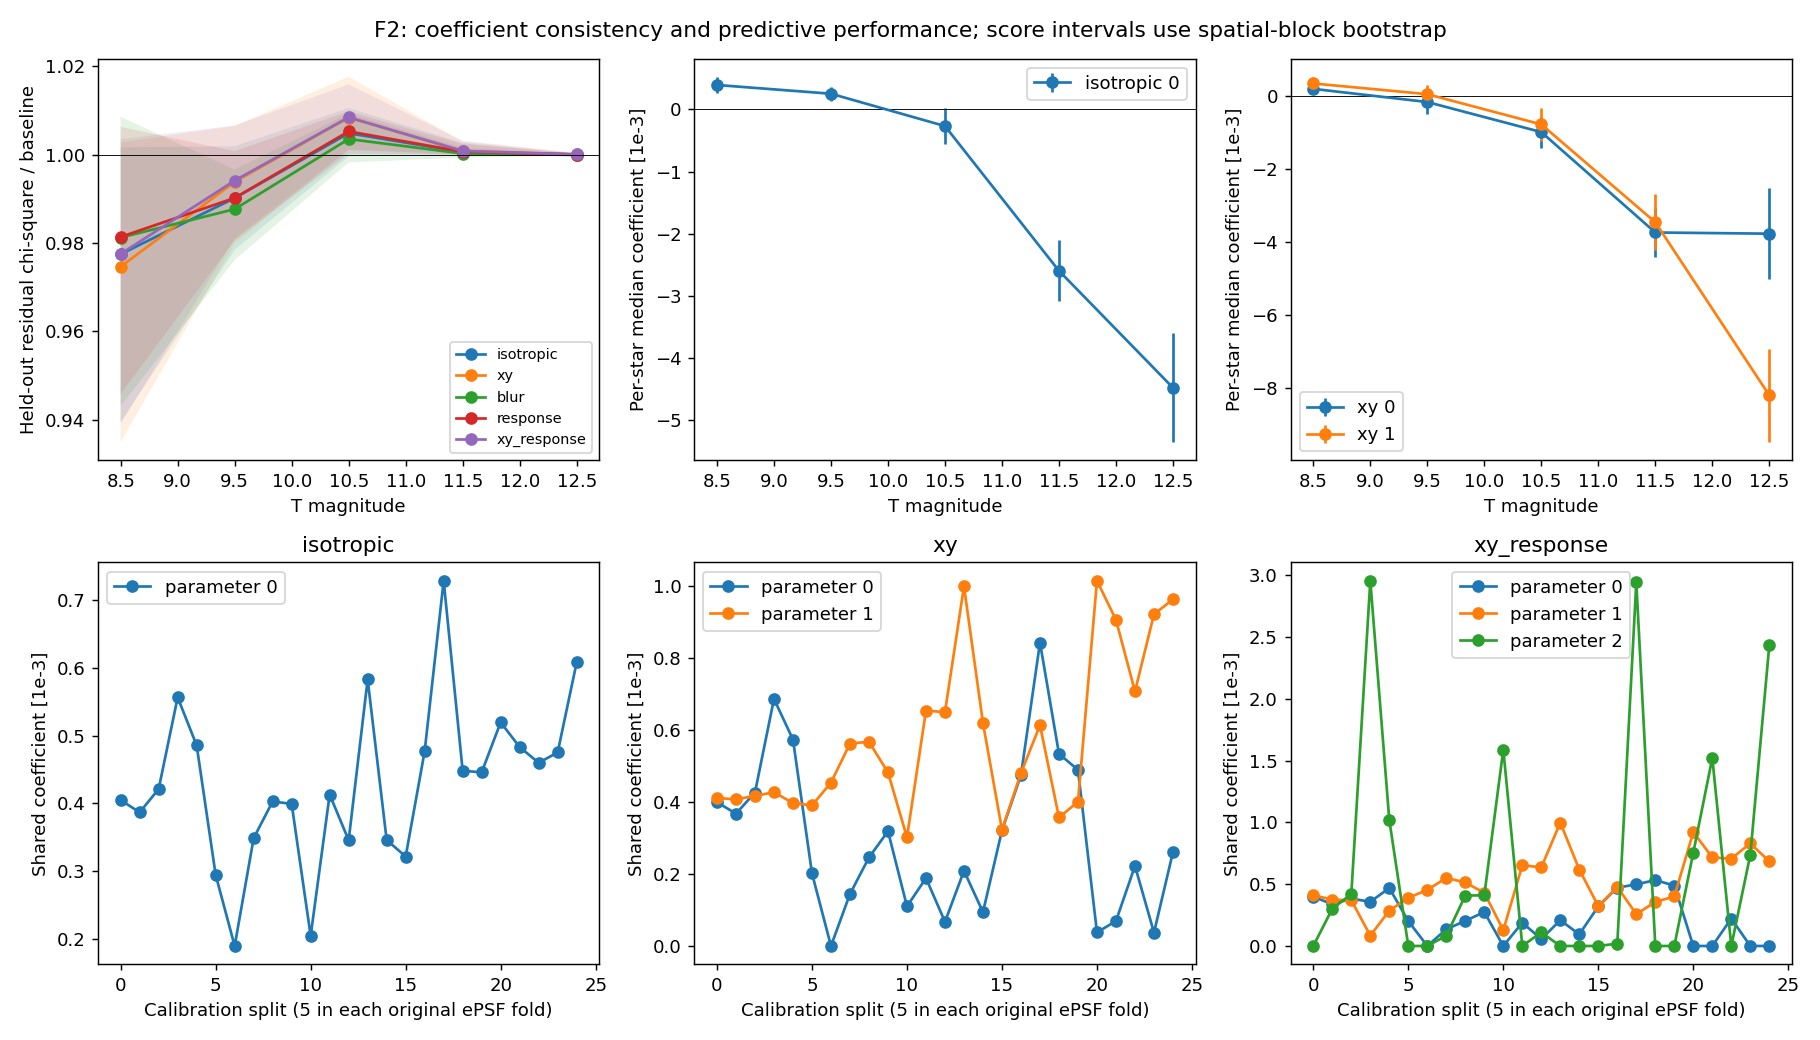
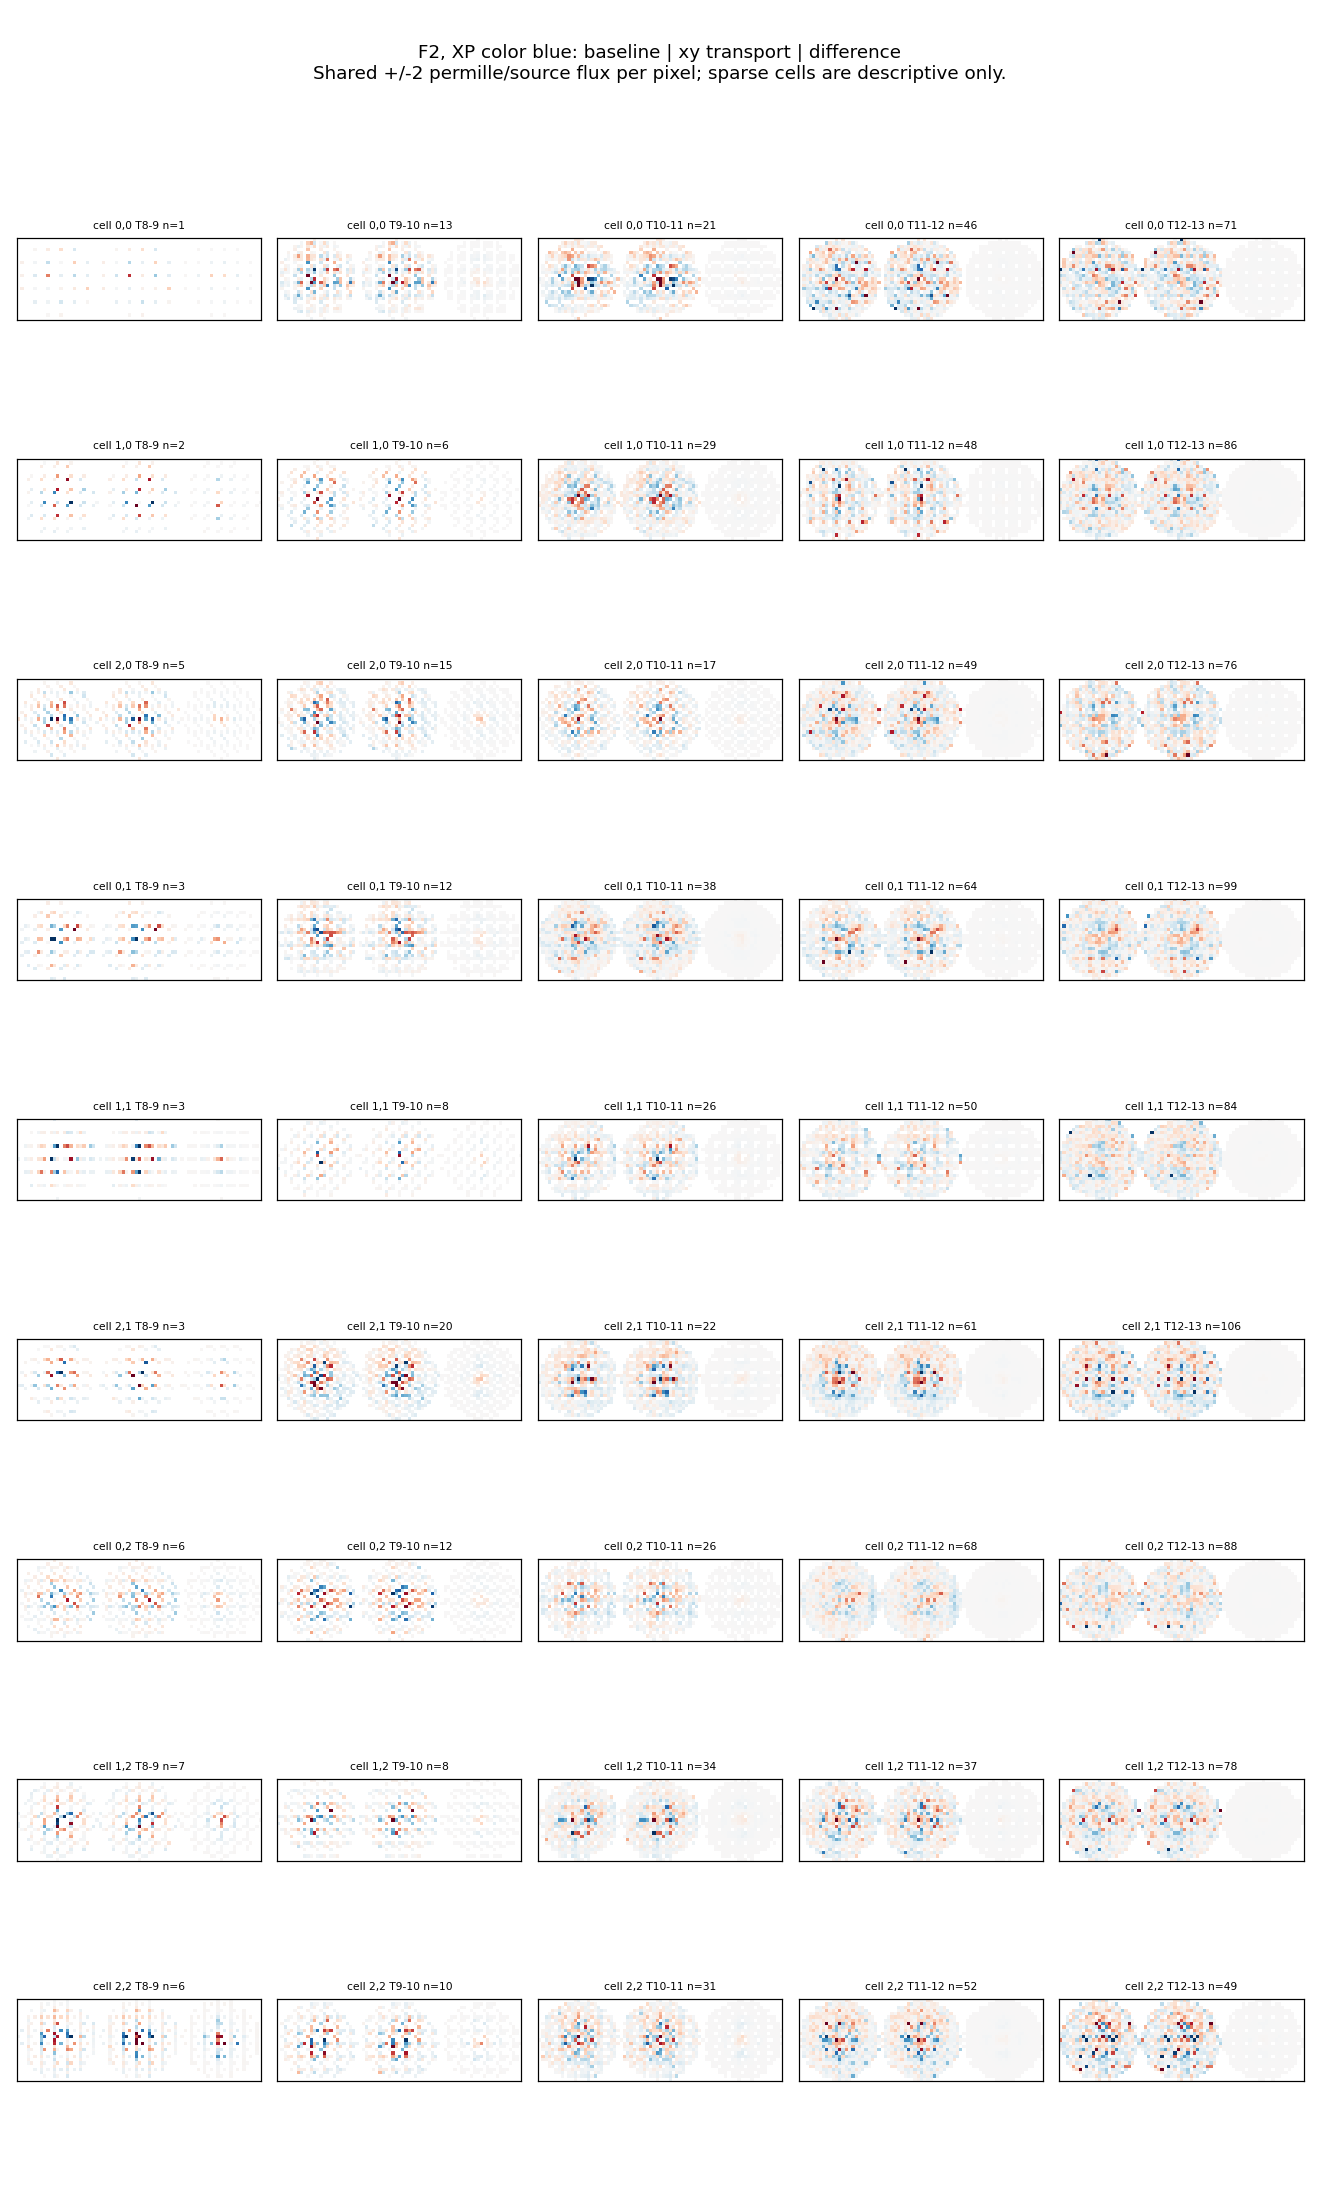
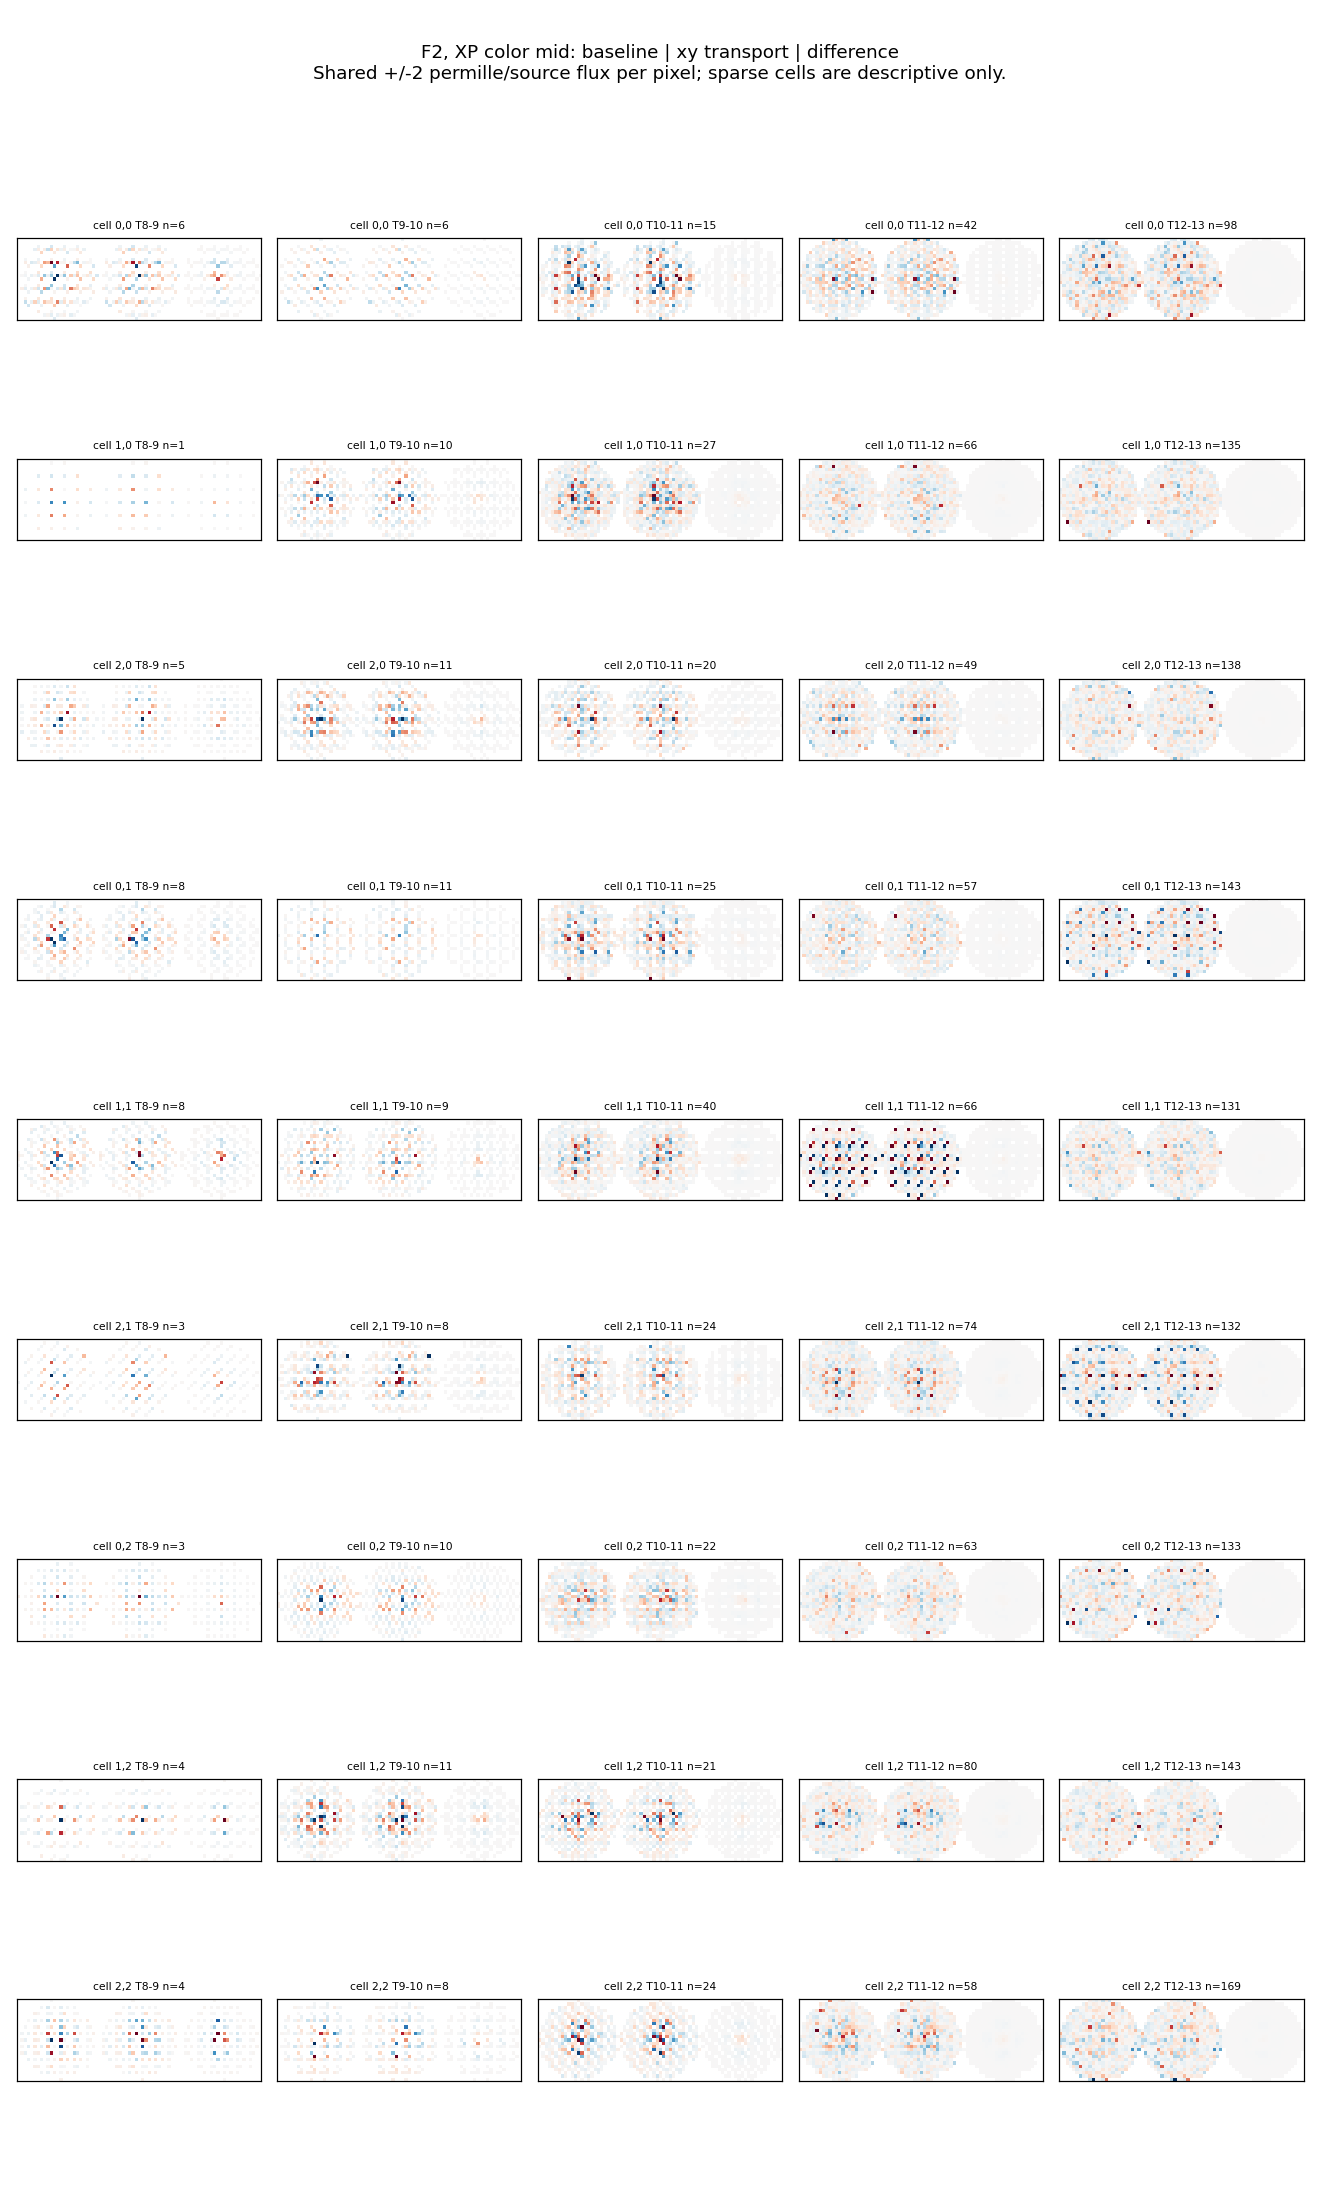
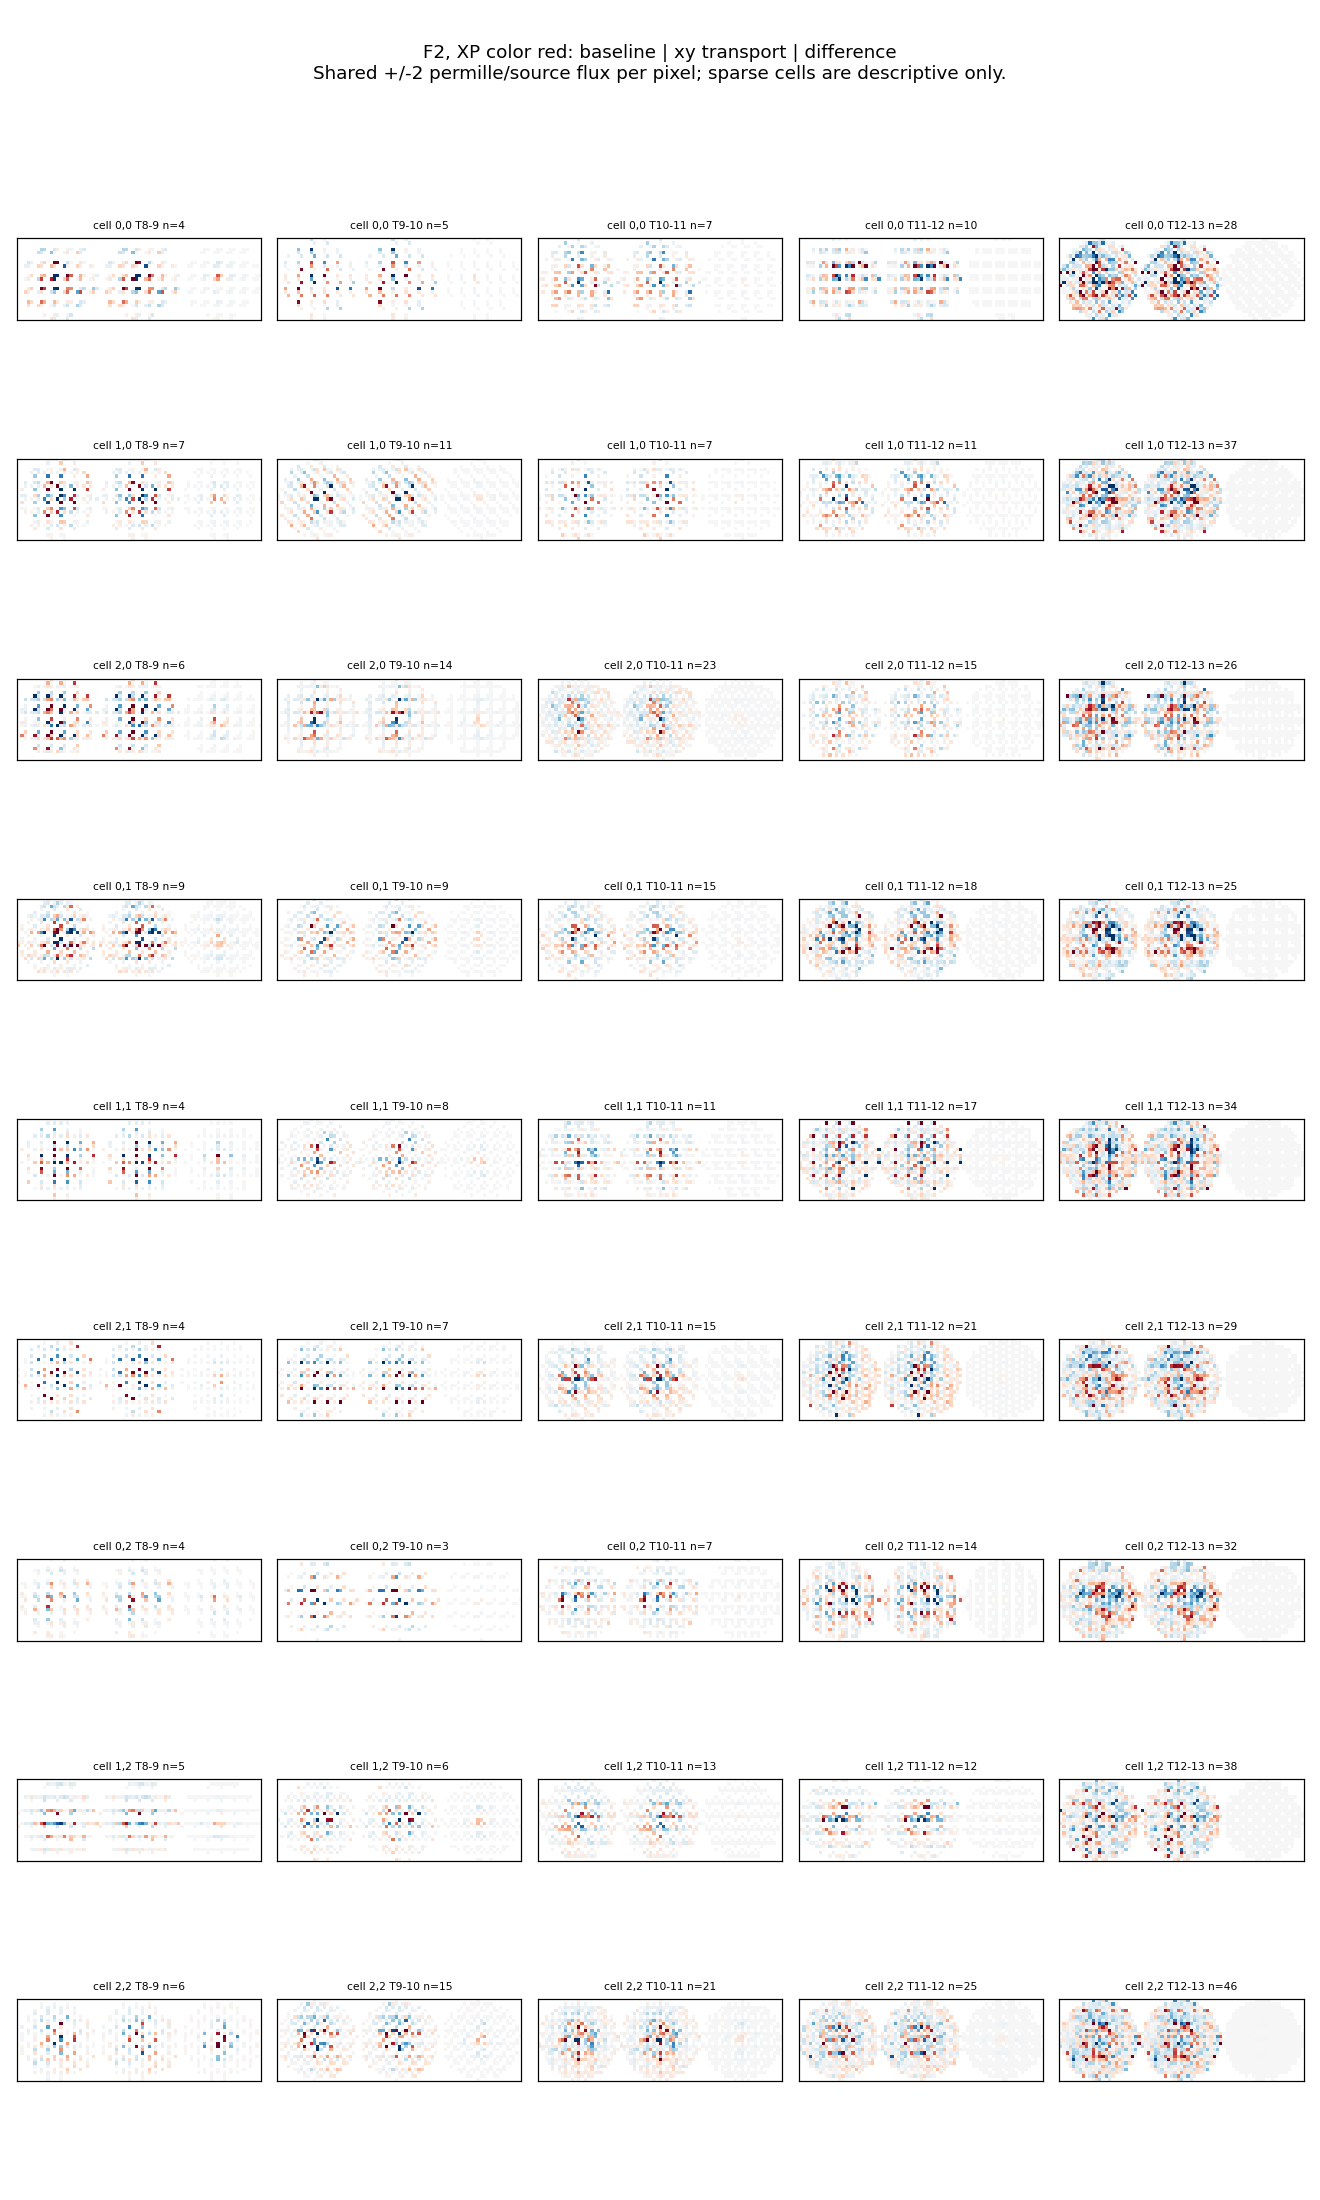
Focused presentation update
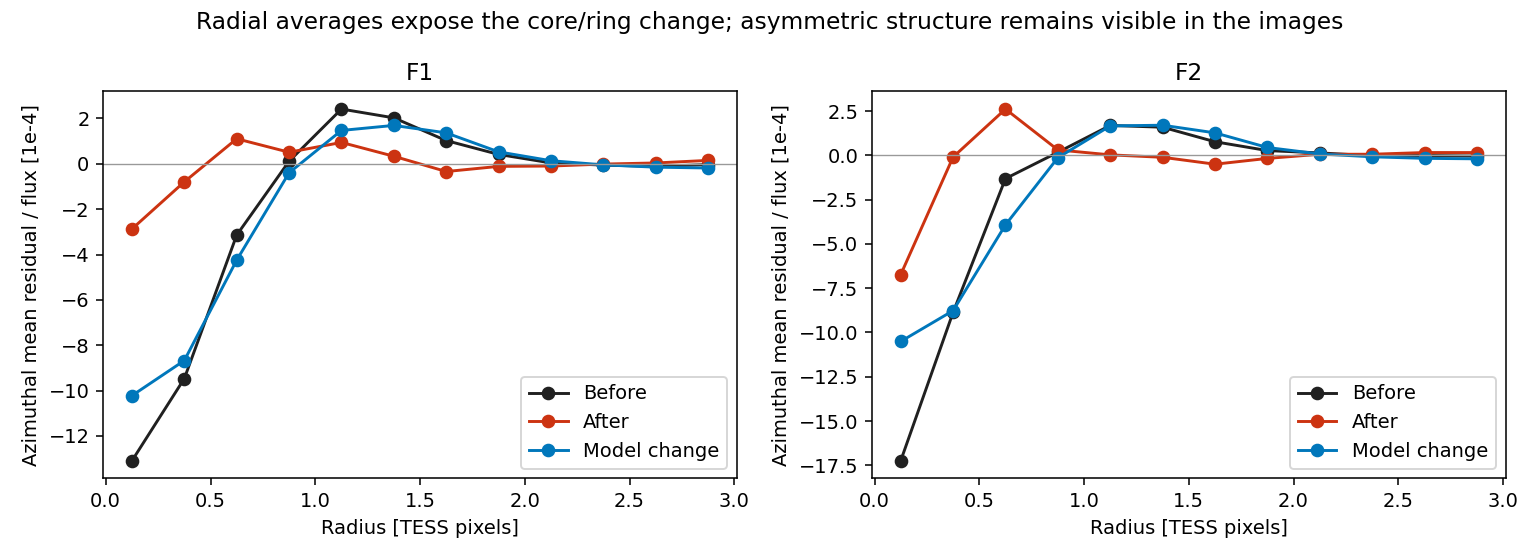
The report now starts with matched before/after sliders, an explicit net-model-change image, and radial profiles. The central deficit is reduced, while asymmetric lobes remain. No fitting or predictive scores changed. Focused images, corresponding radial profiles.
- F1: mean normalized residual inside radius 0.6 pixels changes from -6.29 to +0.27, in units of 1e-4 of source flux per pixel. Descriptive stack means only; no integrated flux or significance claim.
- F2: mean normalized residual inside radius 0.6 pixels changes from -4.84 to +1.60, in units of 1e-4 of source flux per pixel. Descriptive stack means only; no integrated flux or significance claim.
The net fitted-model change includes amplitude/position/background refits; it is not a direct measurement of transported electrons. The first model remains a partial correction, not a noise-only residual solution.
Reproducibility
Source: /home/kshukawa/syndiff_pipeline/dev/.claude/worktrees/bf-transport-20261008/tools/bf_transport_20261008/, branch codex/bf-transport-20261008. Data/results: /astro/armin/koji/syndiff/dev_runs/bf_transport_20261008/current/.
After activating syndiff, use prepare_current.py --field F1 --fold 0 (all five folds, both fields, with paper1_final_fits_20261007/code/env.sh), combine_current.py, diagnose.py --current --field F1 and F2, reconcile.py, then publish_current.py. Use OPENBLAS_NUM_THREADS=1 OMP_NUM_THREADS=1 MPLCONFIGDIR=/tmp/bf_transport_mpl PYTHONDONTWRITEBYTECODE=1. Reference identities and replay errors are in inputs/*json and replay_checks.json; numerical scores and gates in F1_summary.json/F2_summary.json; per-star coefficients, native residuals and display rasters in *_diagnostic.npz.
This is a post-hoc residual diagnostic, not a newly trained or fully refitted scene. Its color/magnitude/CCD grids are included here rather than labeled as a new training run in the shared training registry.
Conclusion: On the correct October 7 reference, x/y transport lowers held-out bright-star residual chi-square by 2.56% in F1 and 1.80% in F2. Only F1 excludes no improvement at the reported conditional 95% interval. The ring is visibly reduced, but the result does not establish transport as the physical cause or as superior to the smooth-blur control.

 BeforeAfter
 BeforeAfter