Status: completed conditional diagnostic; no production correction accepted.
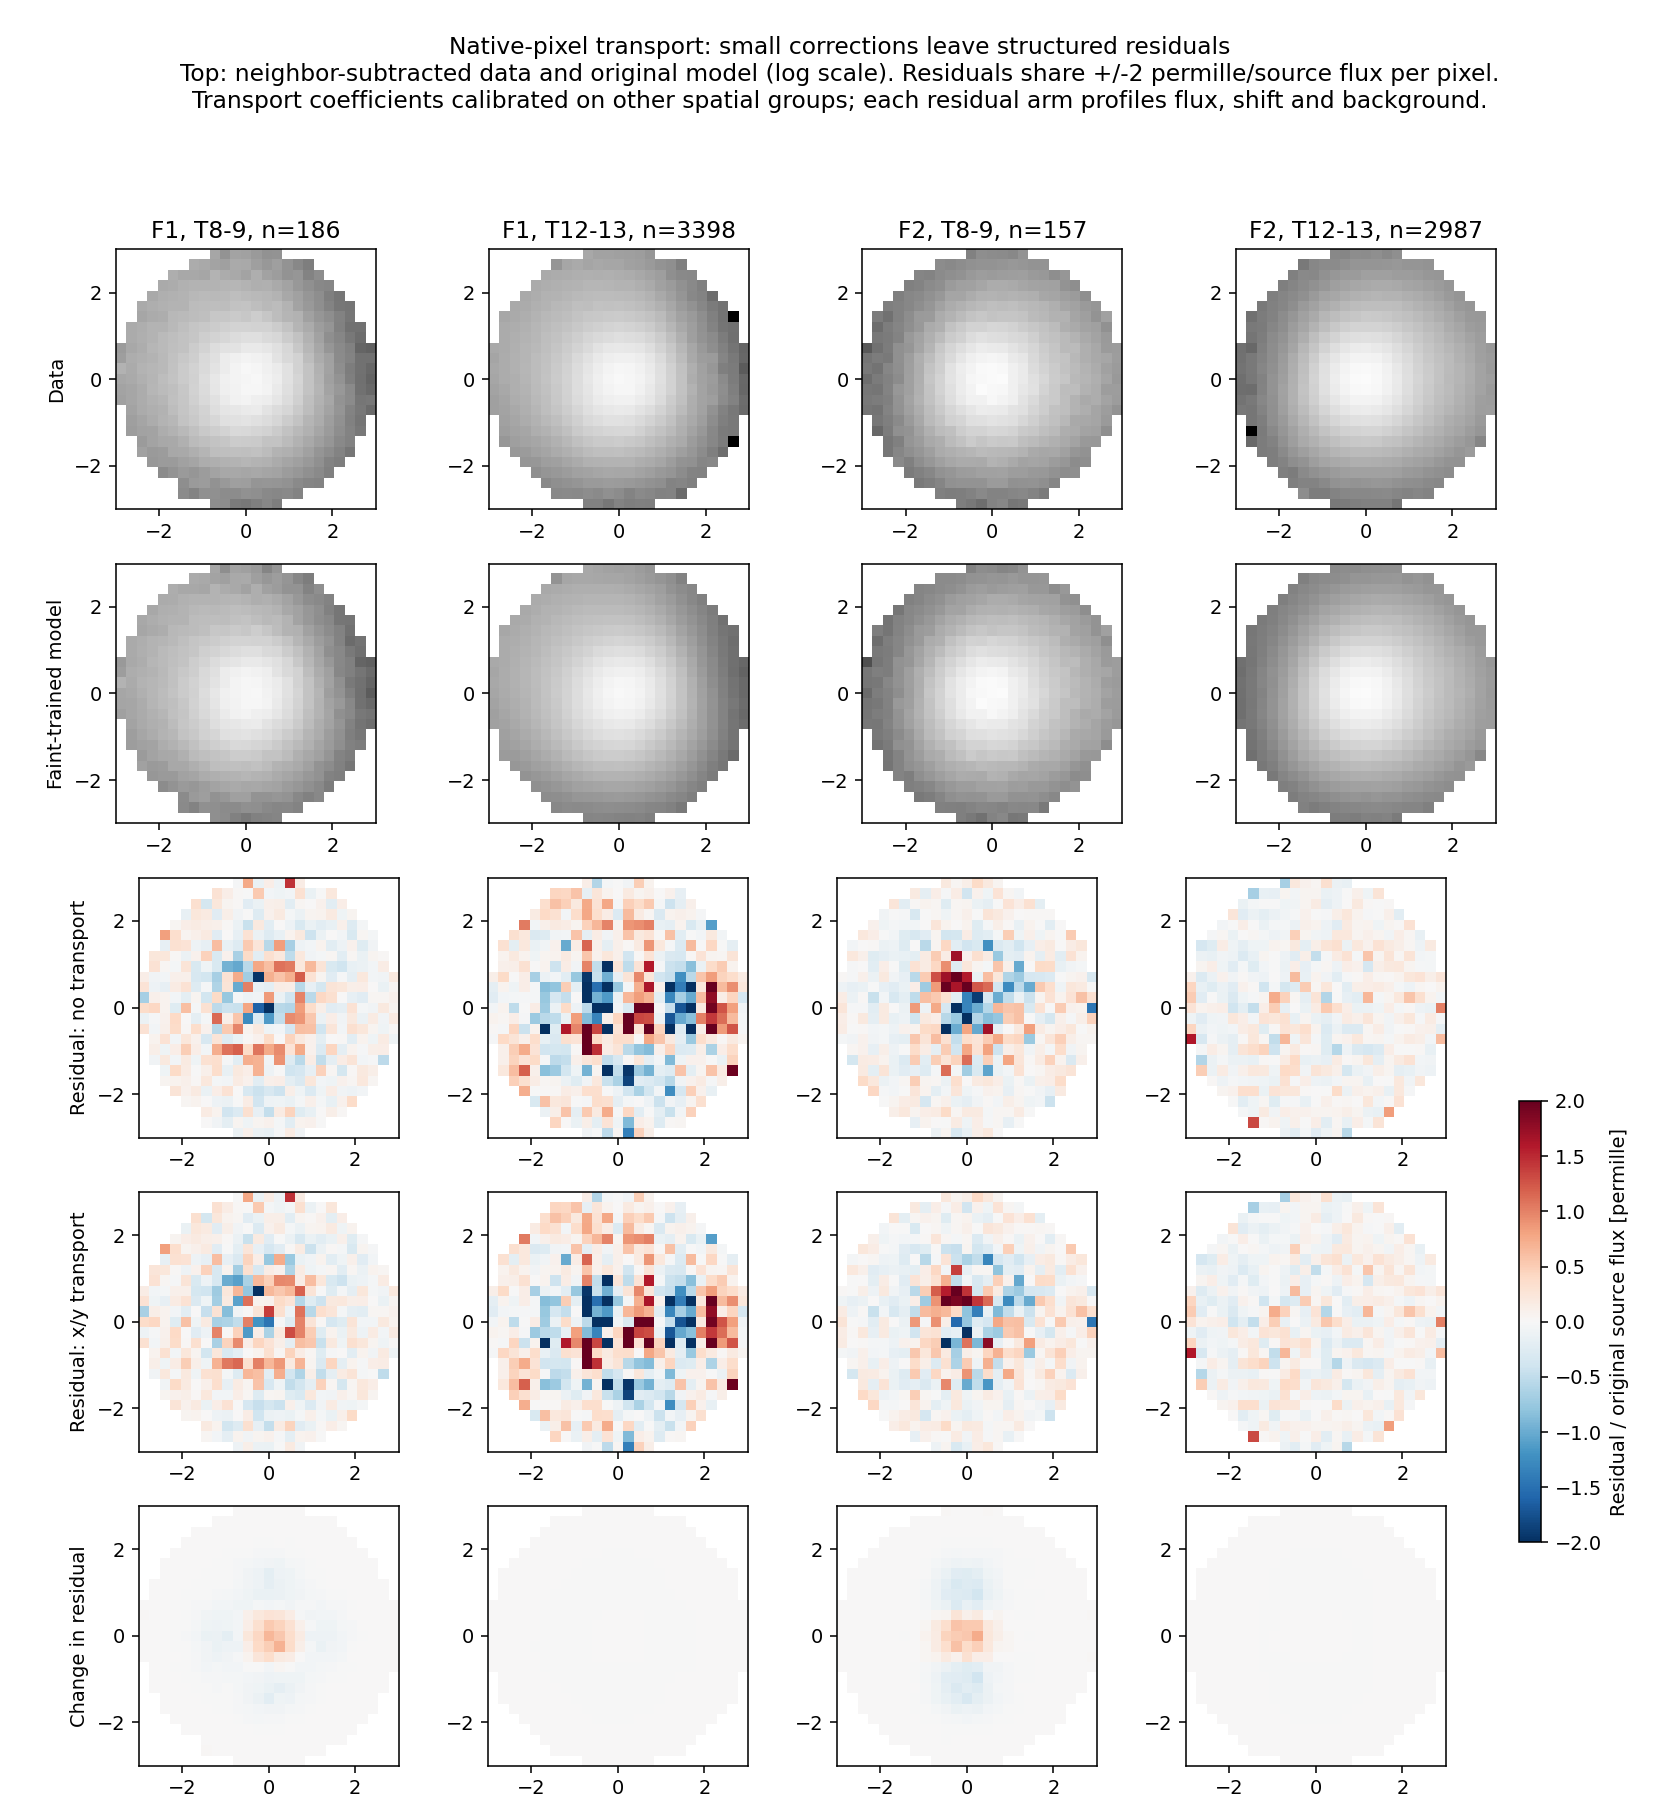
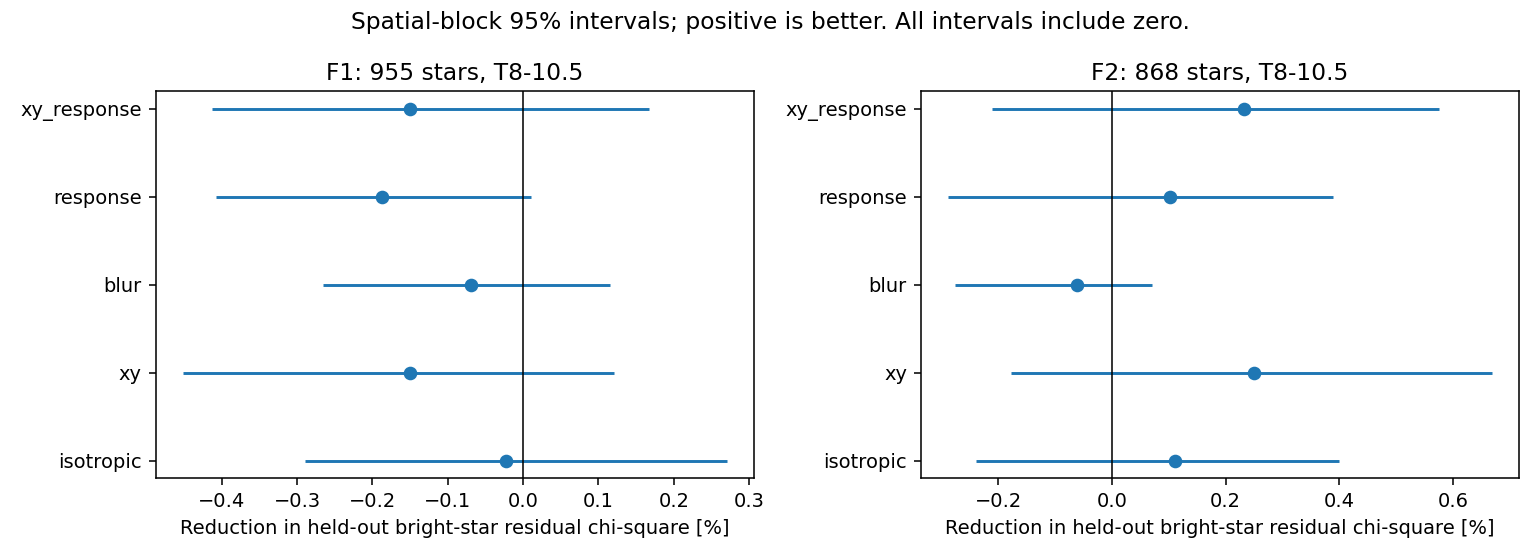
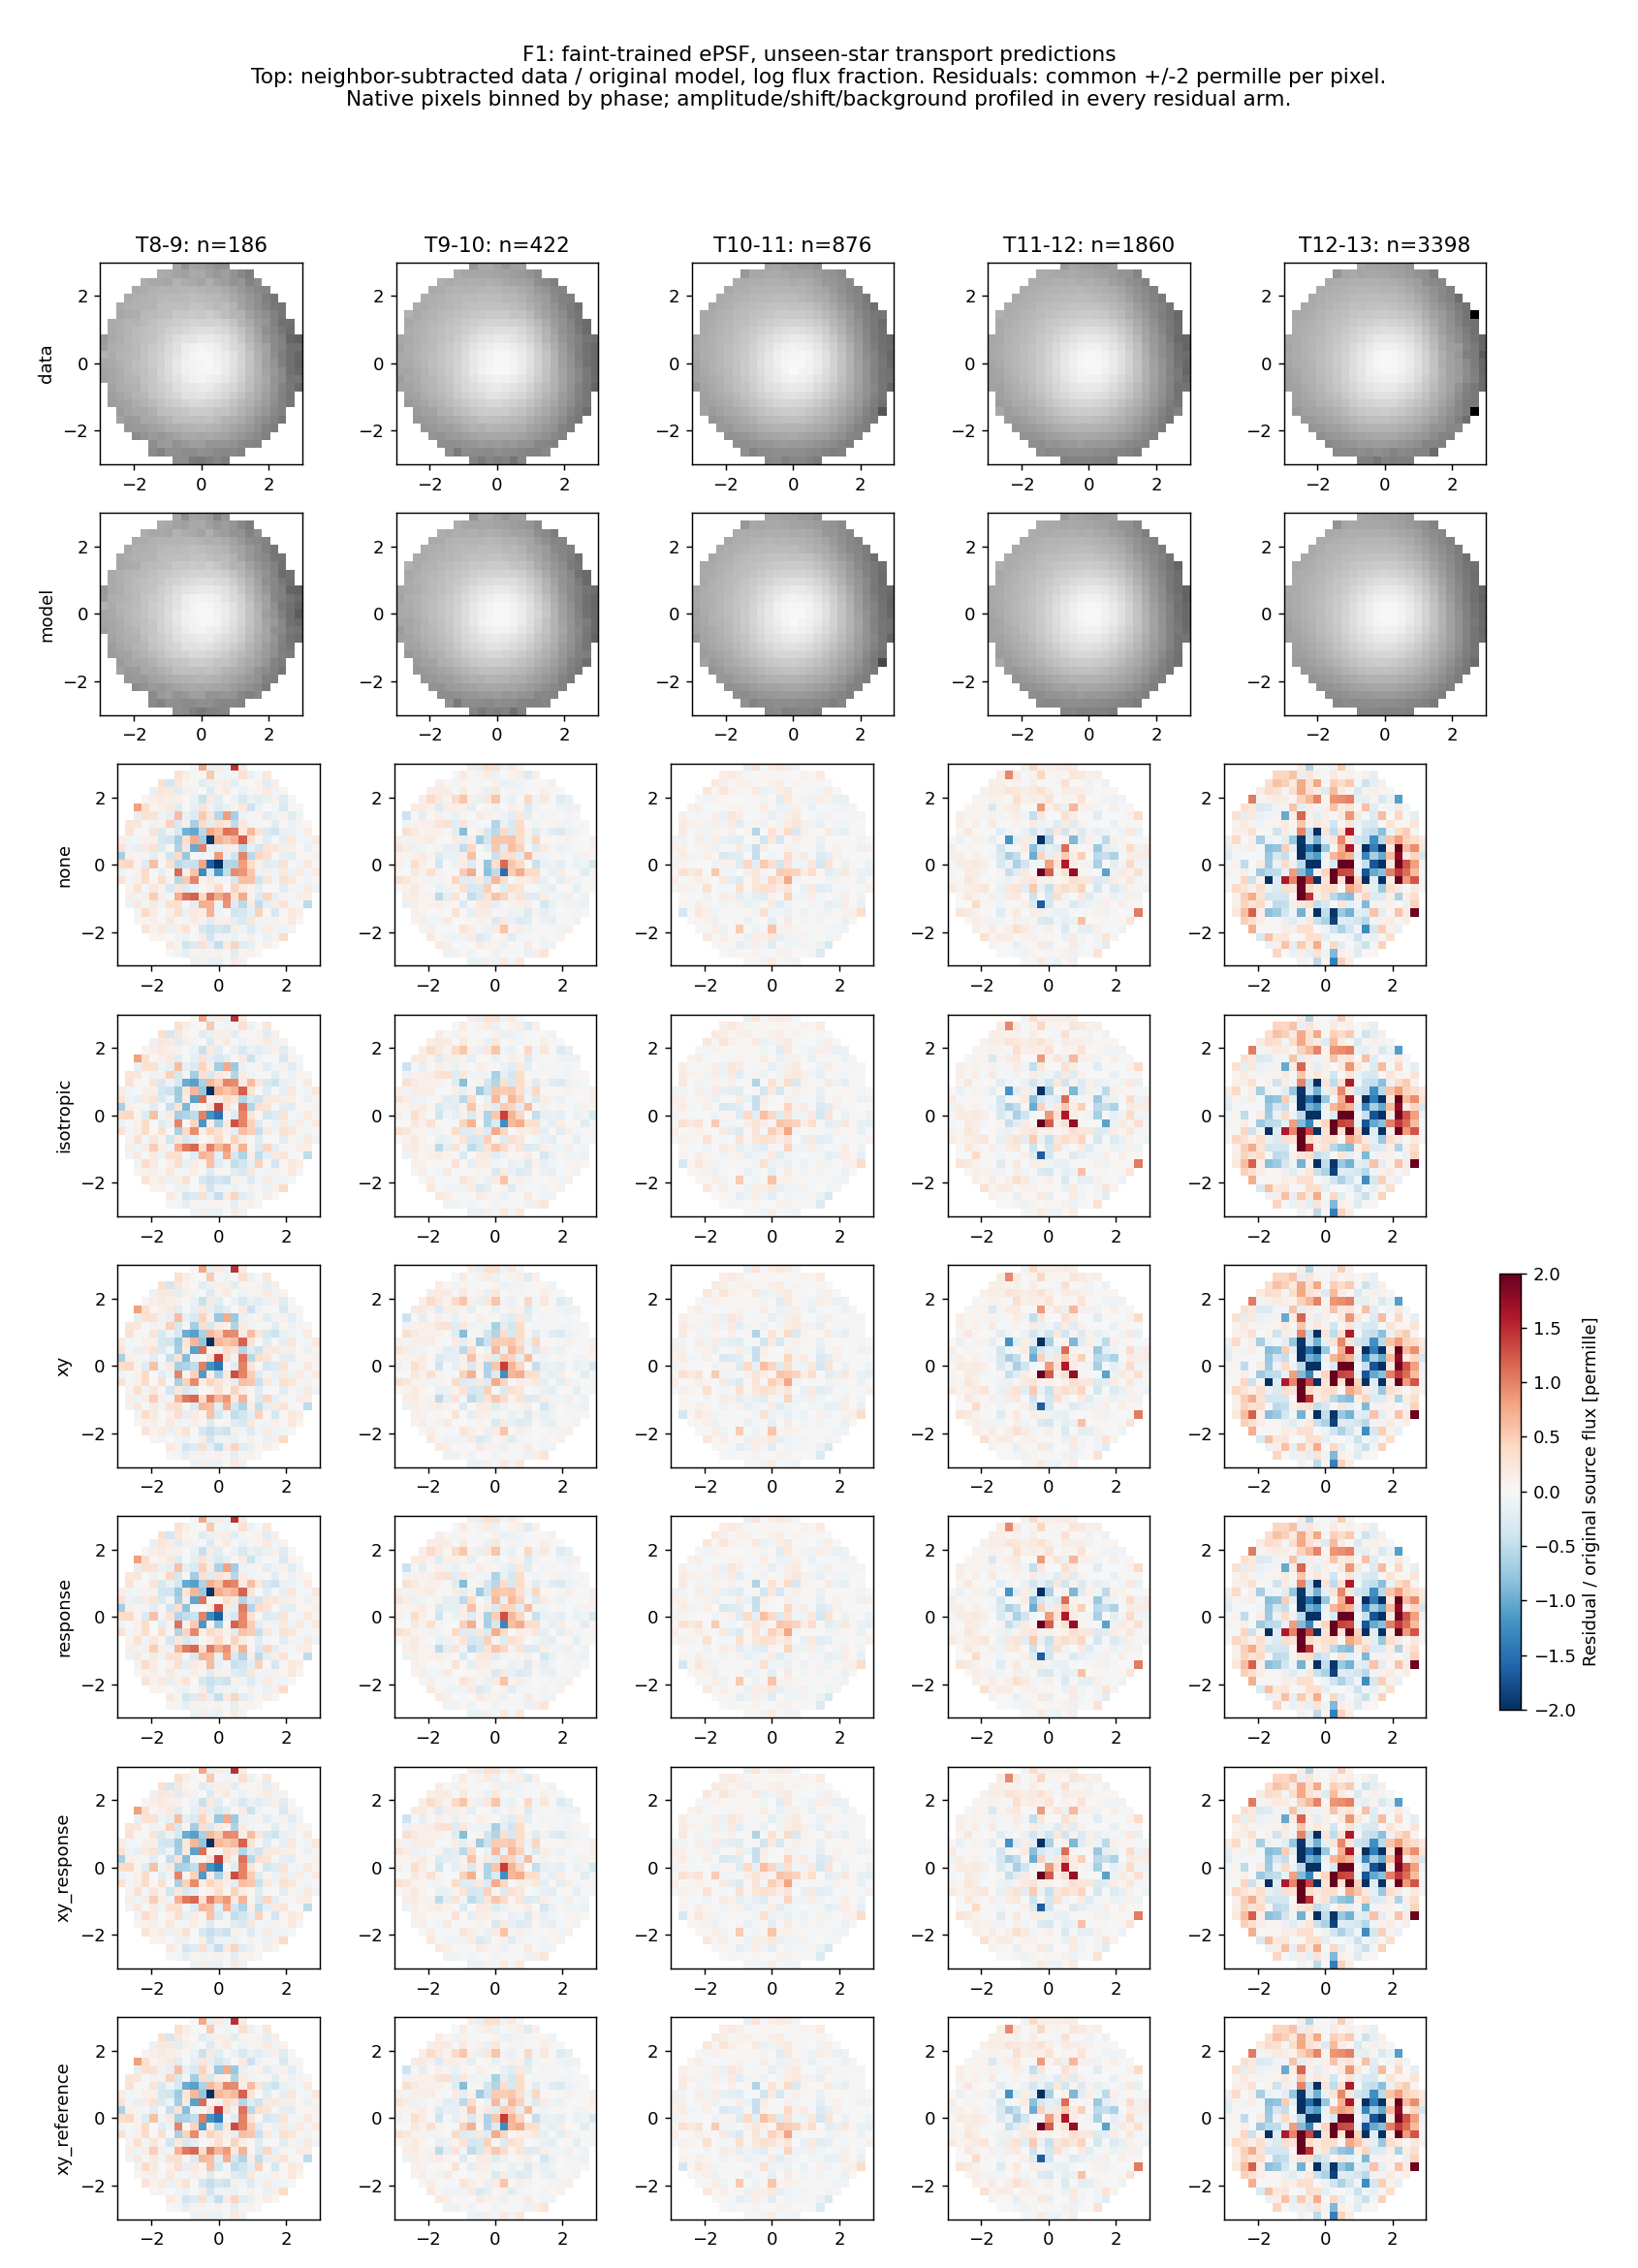
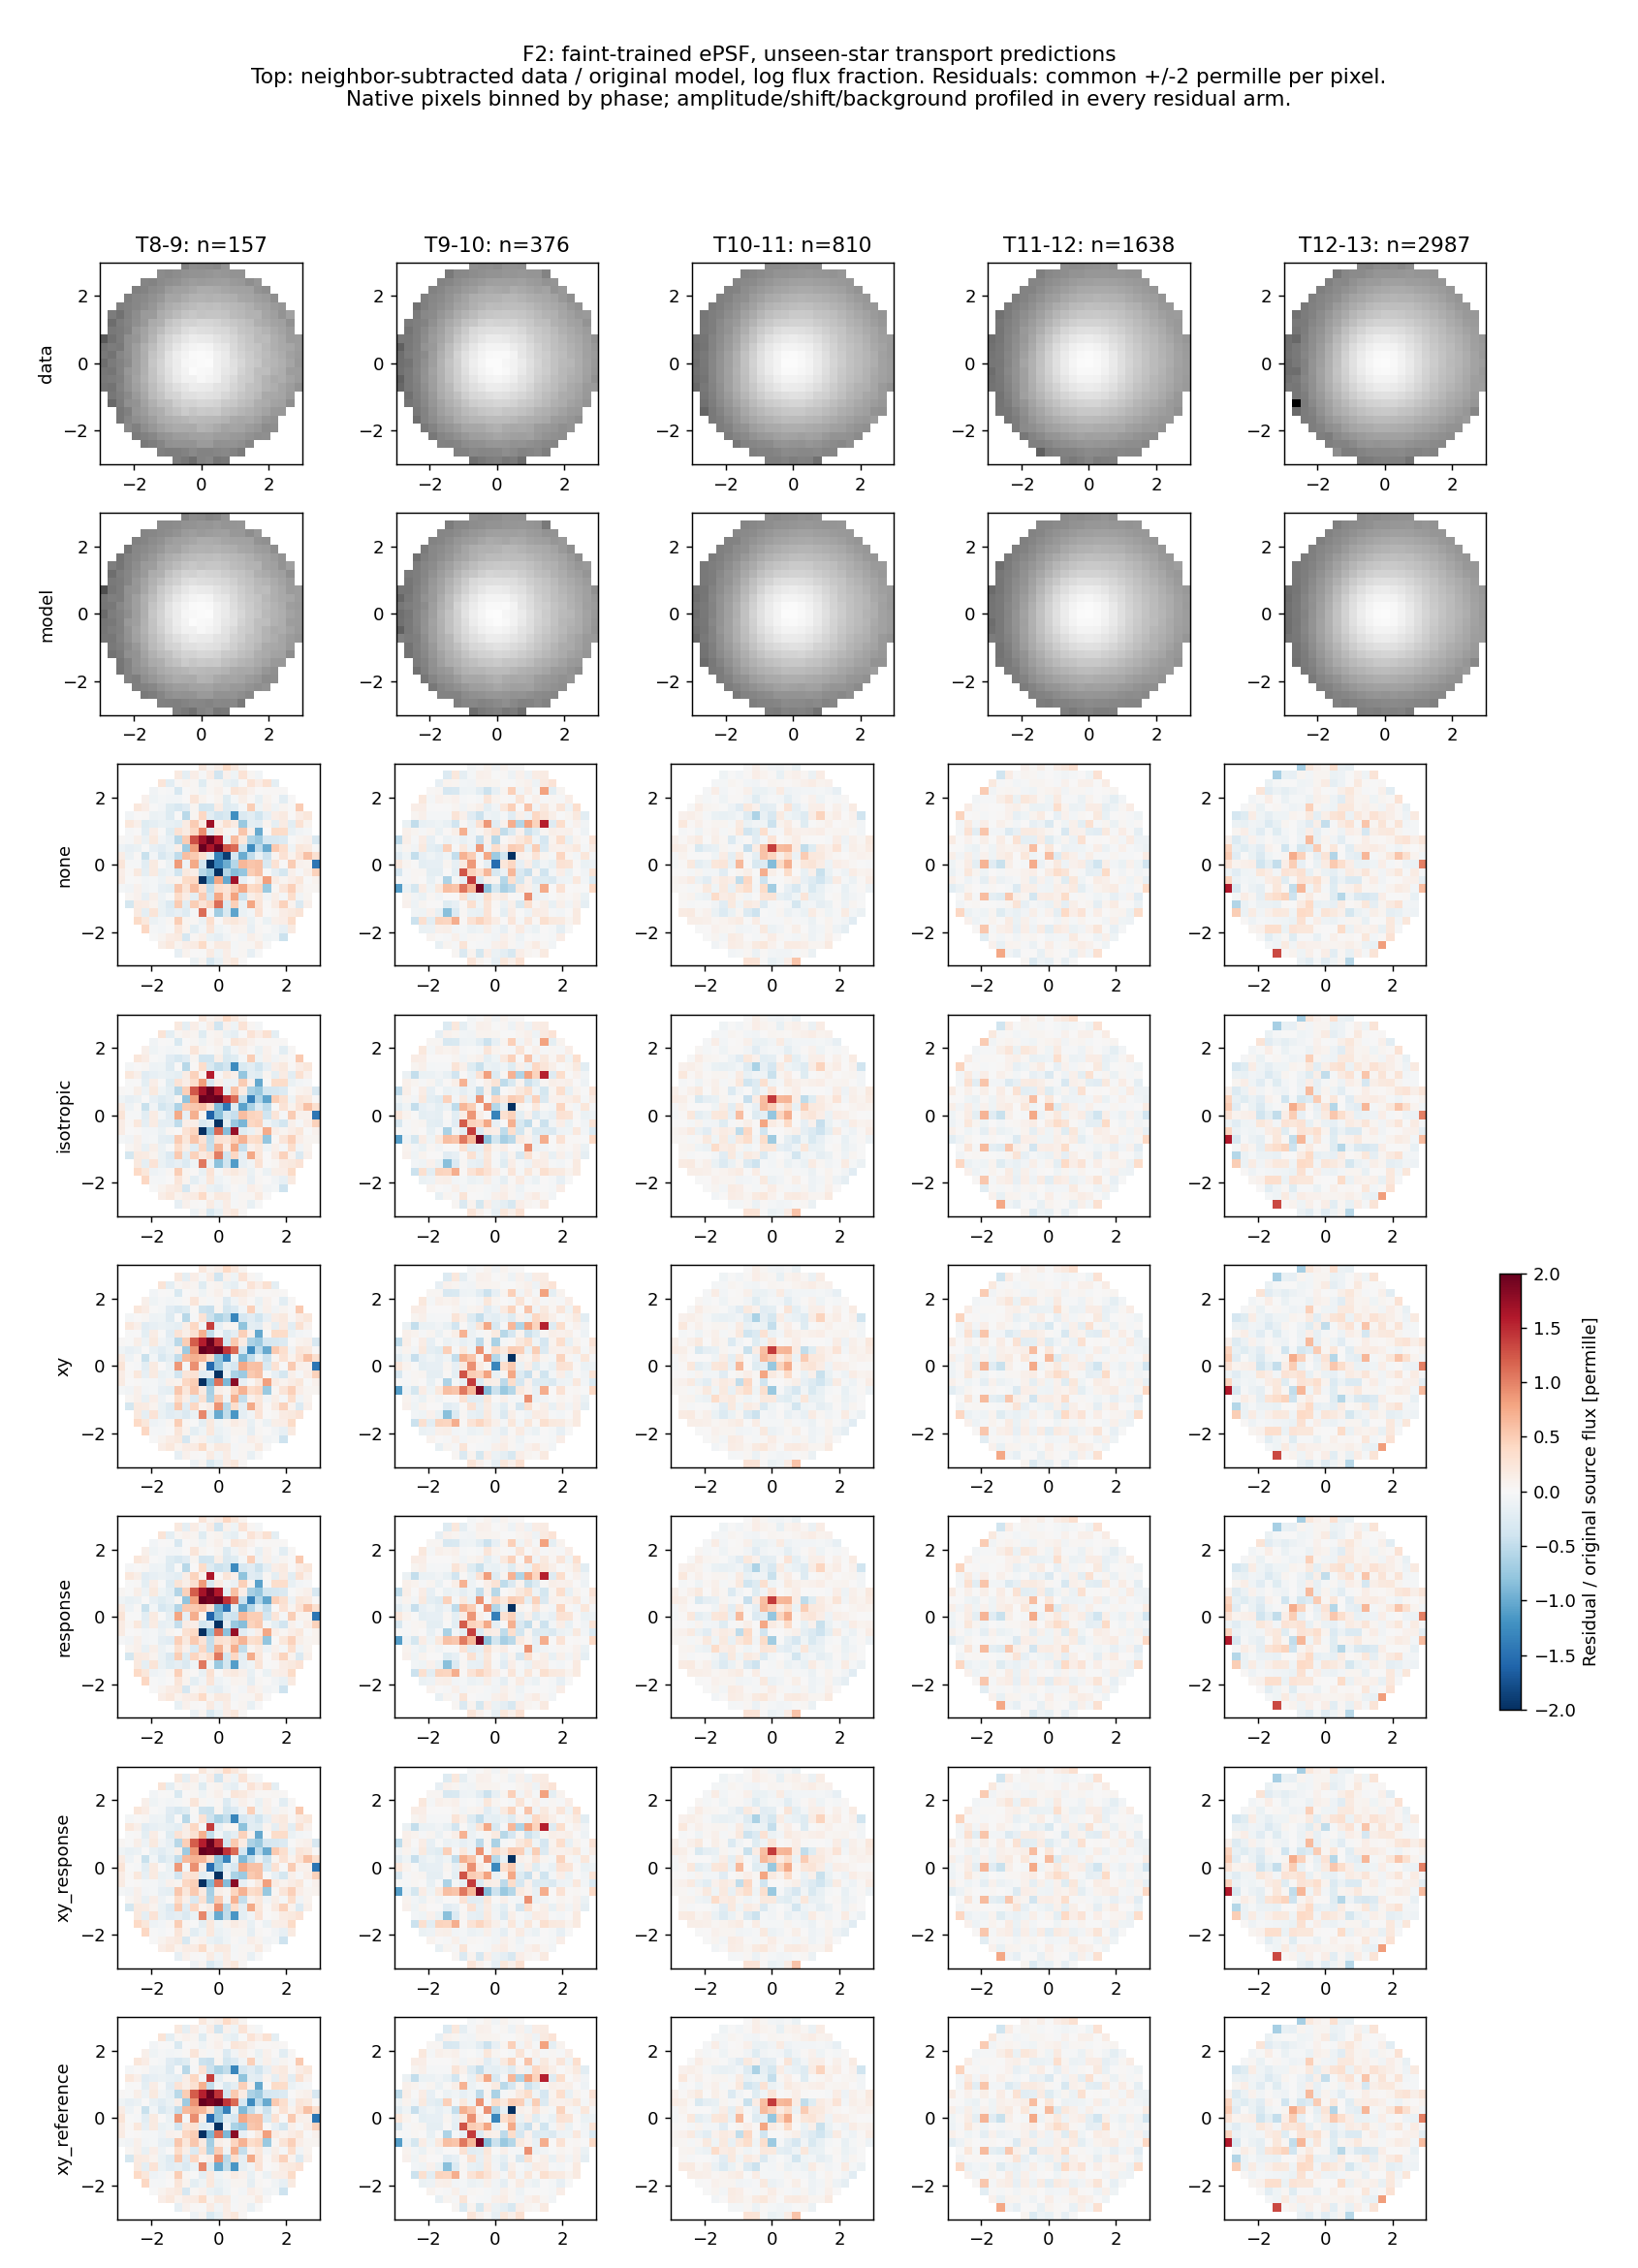
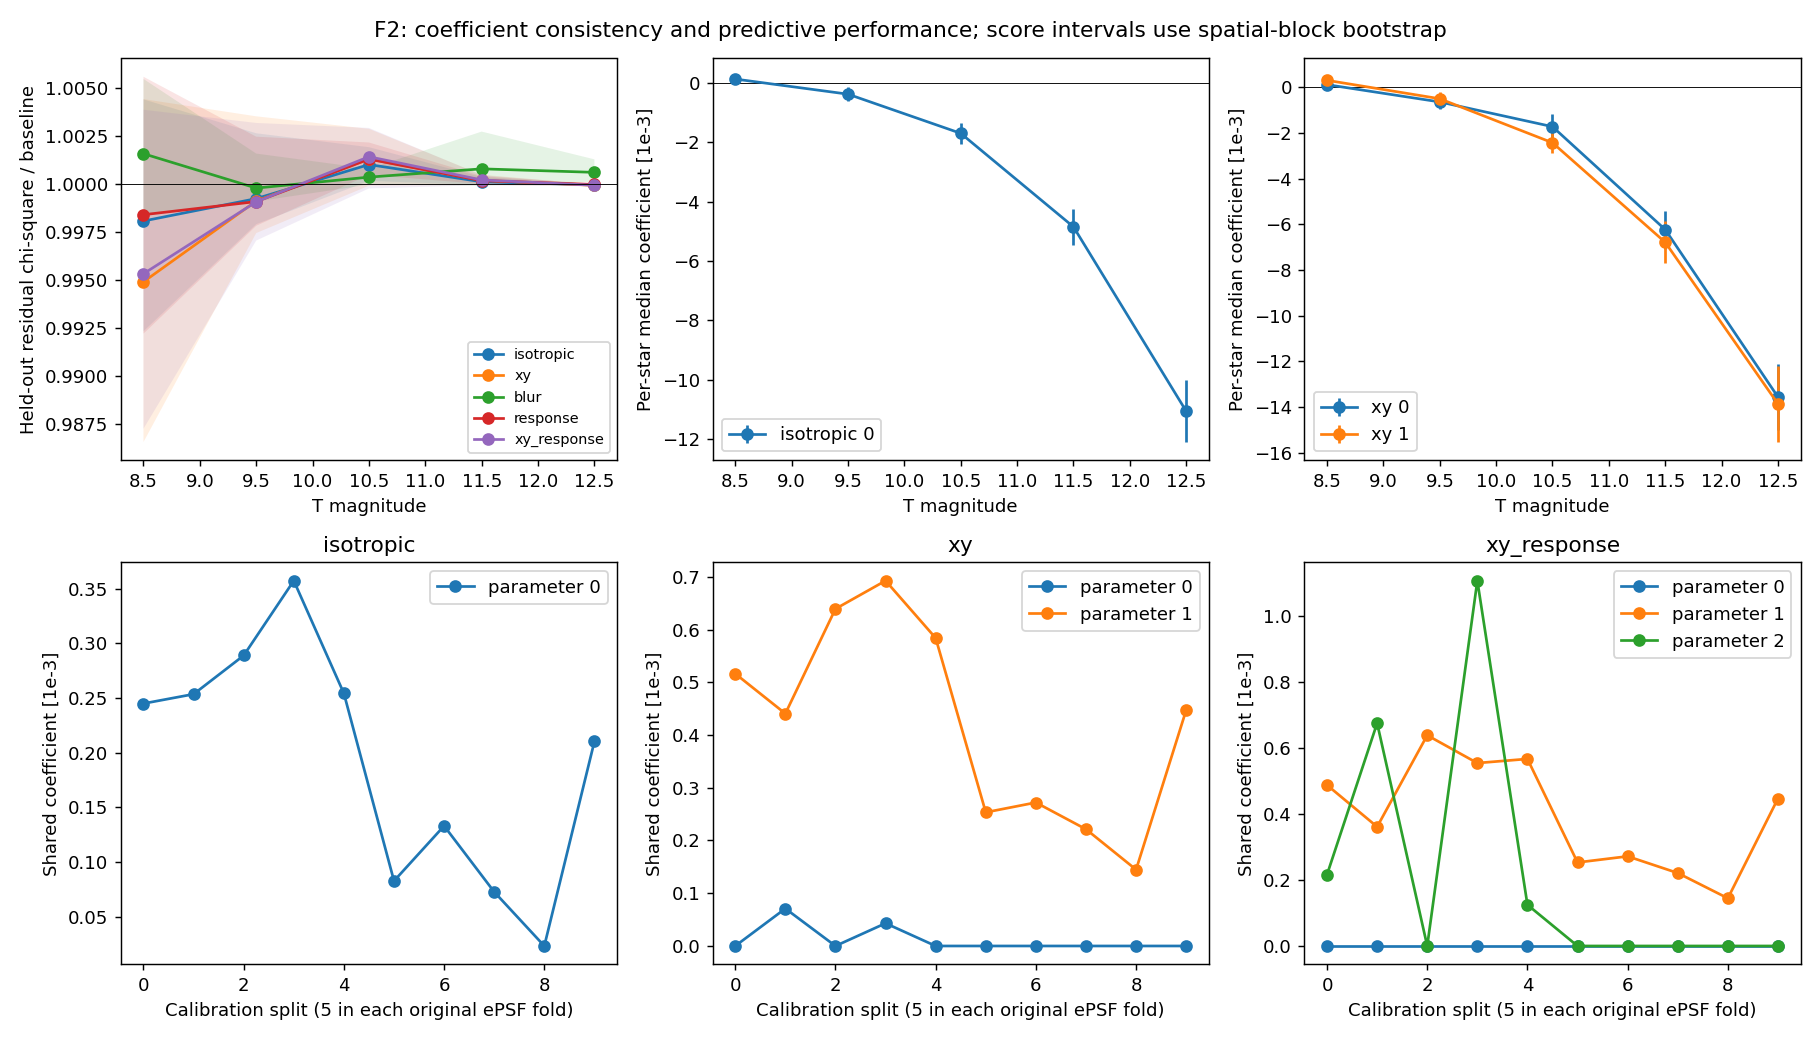
Neither isotropic nor x/y nearest-neighbor quadratic transport gives a reliable held-out improvement across the two fields. Every primary bright-star confidence interval includes no improvement. The visible residual structure remains. This rejects adopting this simple post-hoc correction on these references; it does not exclude physical brighter–fatter transport. The existing faint-trained ePSFs are not certified low-charge truth and leave strong faint-star structure. A calibrated boundary kernel or a jointly fitted, validated faint reference remains a separate test.
| Field | Model | Reduction in held-out bright-star chi-square | Conditional 95% interval |
|---|---|---|---|
| F1 | isotropic | -0.023% | [-0.290, +0.270]% |
| F1 | xy | -0.150% | [-0.452, +0.120]% |
| F2 | isotropic | +0.110% | [-0.240, +0.400]% |
| F2 | xy | +0.250% | [-0.178, +0.668]% |
Positive percentages mean lower chi-square; these are not improvements in flux accuracy. Bright is T8–10.5. F1=S24 C2K2; F2=S20 C3K3.
For a neighboring pixel pair, the proposed transfer is
$$T_{p\rightarrow r}=\kappa_d\,(Q_p^2-Q_r^2)/Q_0.$$
$T_{p\rightarrow r}$ is the signed electron transfer from pixel $p$ to neighbor $r$ in one short exposure. $Q_p,Q_r$ are predicted charges in electrons, constructed from the saved nonnegative modeled scene plus an assumed sky rate. $Q_0=10^4\,\mathrm{e^-}$ is a fixed scaling constant. $\kappa_d$ is the dimensionless fitted coefficient, horizontal ($d=x$) or vertical ($d=y$). Subtract each transfer from its donor and add it to its recipient, simultaneously using the original image. This is a conservative nearest-neighbor nonlinear-diffusion approximation, not a calibrated electrostatic boundary kernel. The saved model rates are multiplied by the historical $2\,\mathrm{s}$ read proxy and the transport increments divided by that time before scoring.
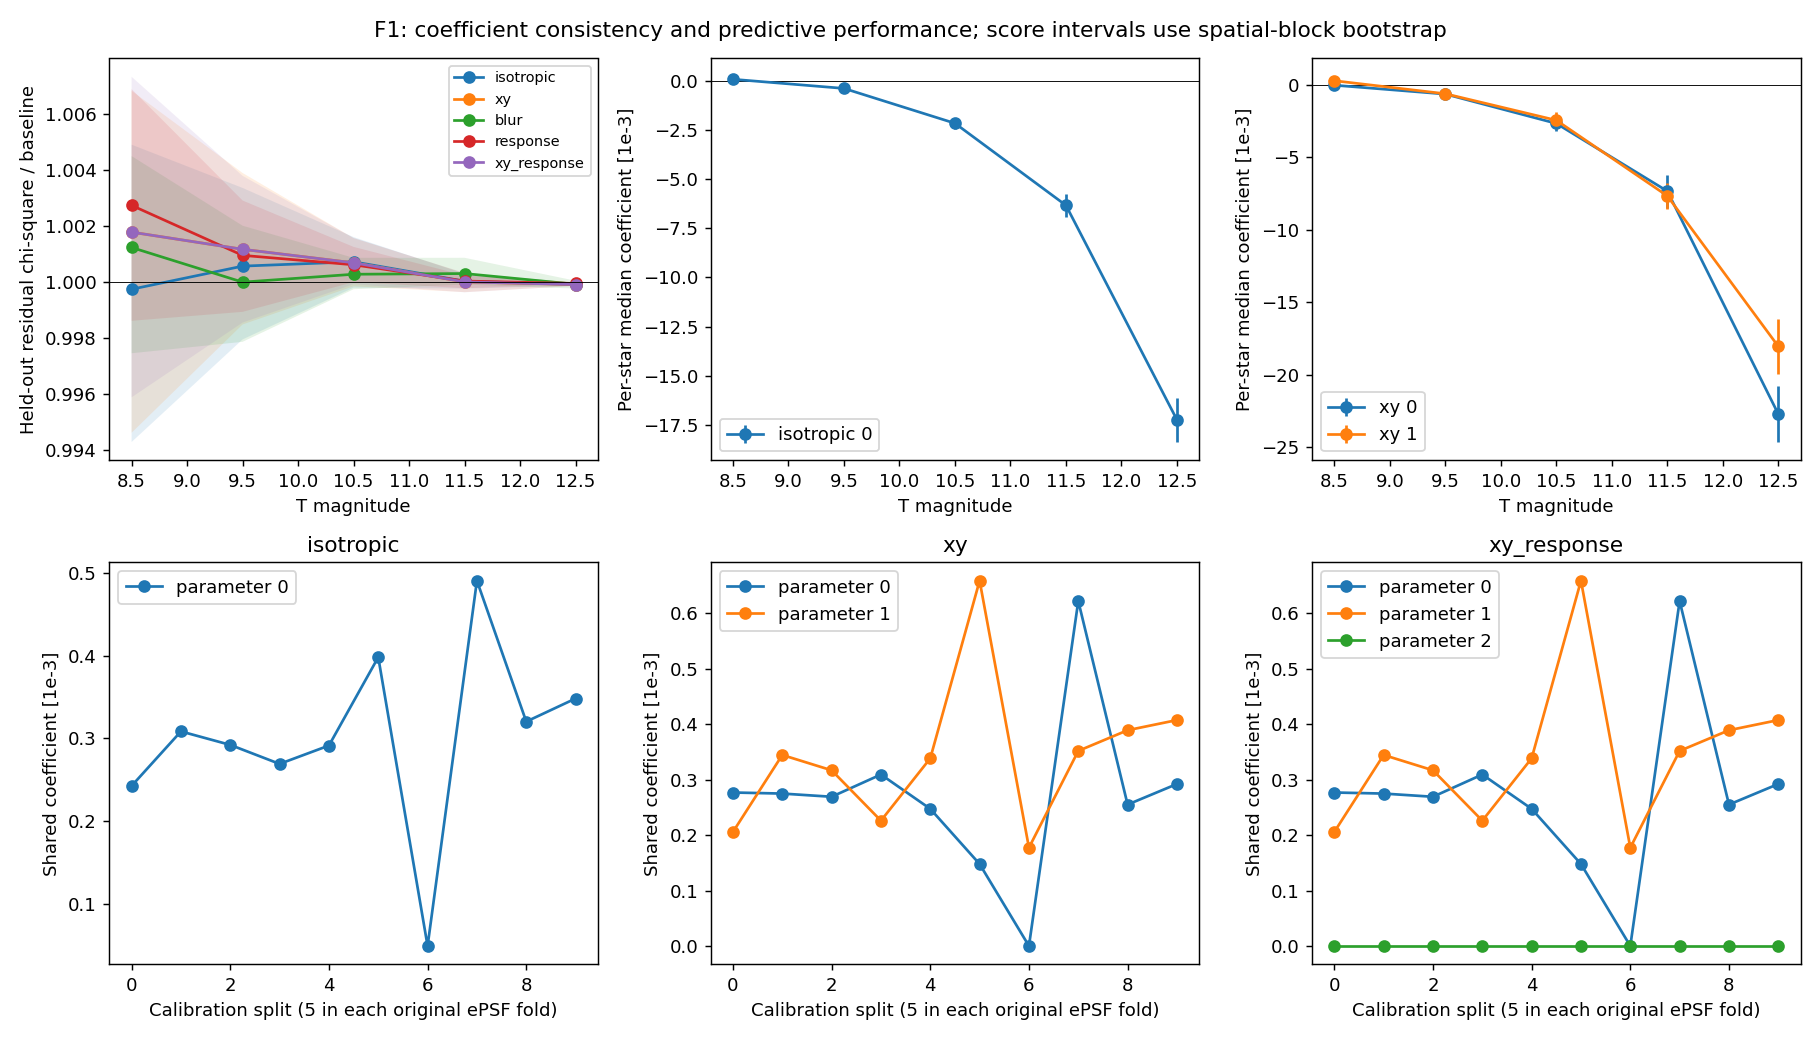
Coefficients in JSON and plots are in units of $10^{-3}$ of $\kappa$. Nonnegative shared coefficients represent outward transport. Per-star coefficients are unconstrained diagnostic measurements; a negative value does not establish physical inward transport.
Every arm fits the same linearized source-amplitude, x/y-displacement and constant-background nuisance basis on the same native pixels inside 3 pixels of the source. Centroid derivatives use a five-point native stencil; a three-point sensitivity is included. Charges and transport shapes are model-derived, not calculated from noisy data. This is a first-order residual fit: it does not perform a full nonlinear rerender at updated flux/position, nor a new scene/ePSF fit.
Each original ePSF fold's held-out stars are divided into five deterministic spatial calibration groups, defined from 128-pixel detector tiles. Transport coefficients are learned from T8–10.5 stars in four groups and applied to the fifth, using the same frozen ePSF. The fitted ePSF itself is not retrained. Scores are summed inverse-noise-weighted squared residuals. Intervals resample spatial blocks with correction predictions fixed; they omit calibration-refit and reference-ePSF uncertainty. They are not photometric-precision estimates.
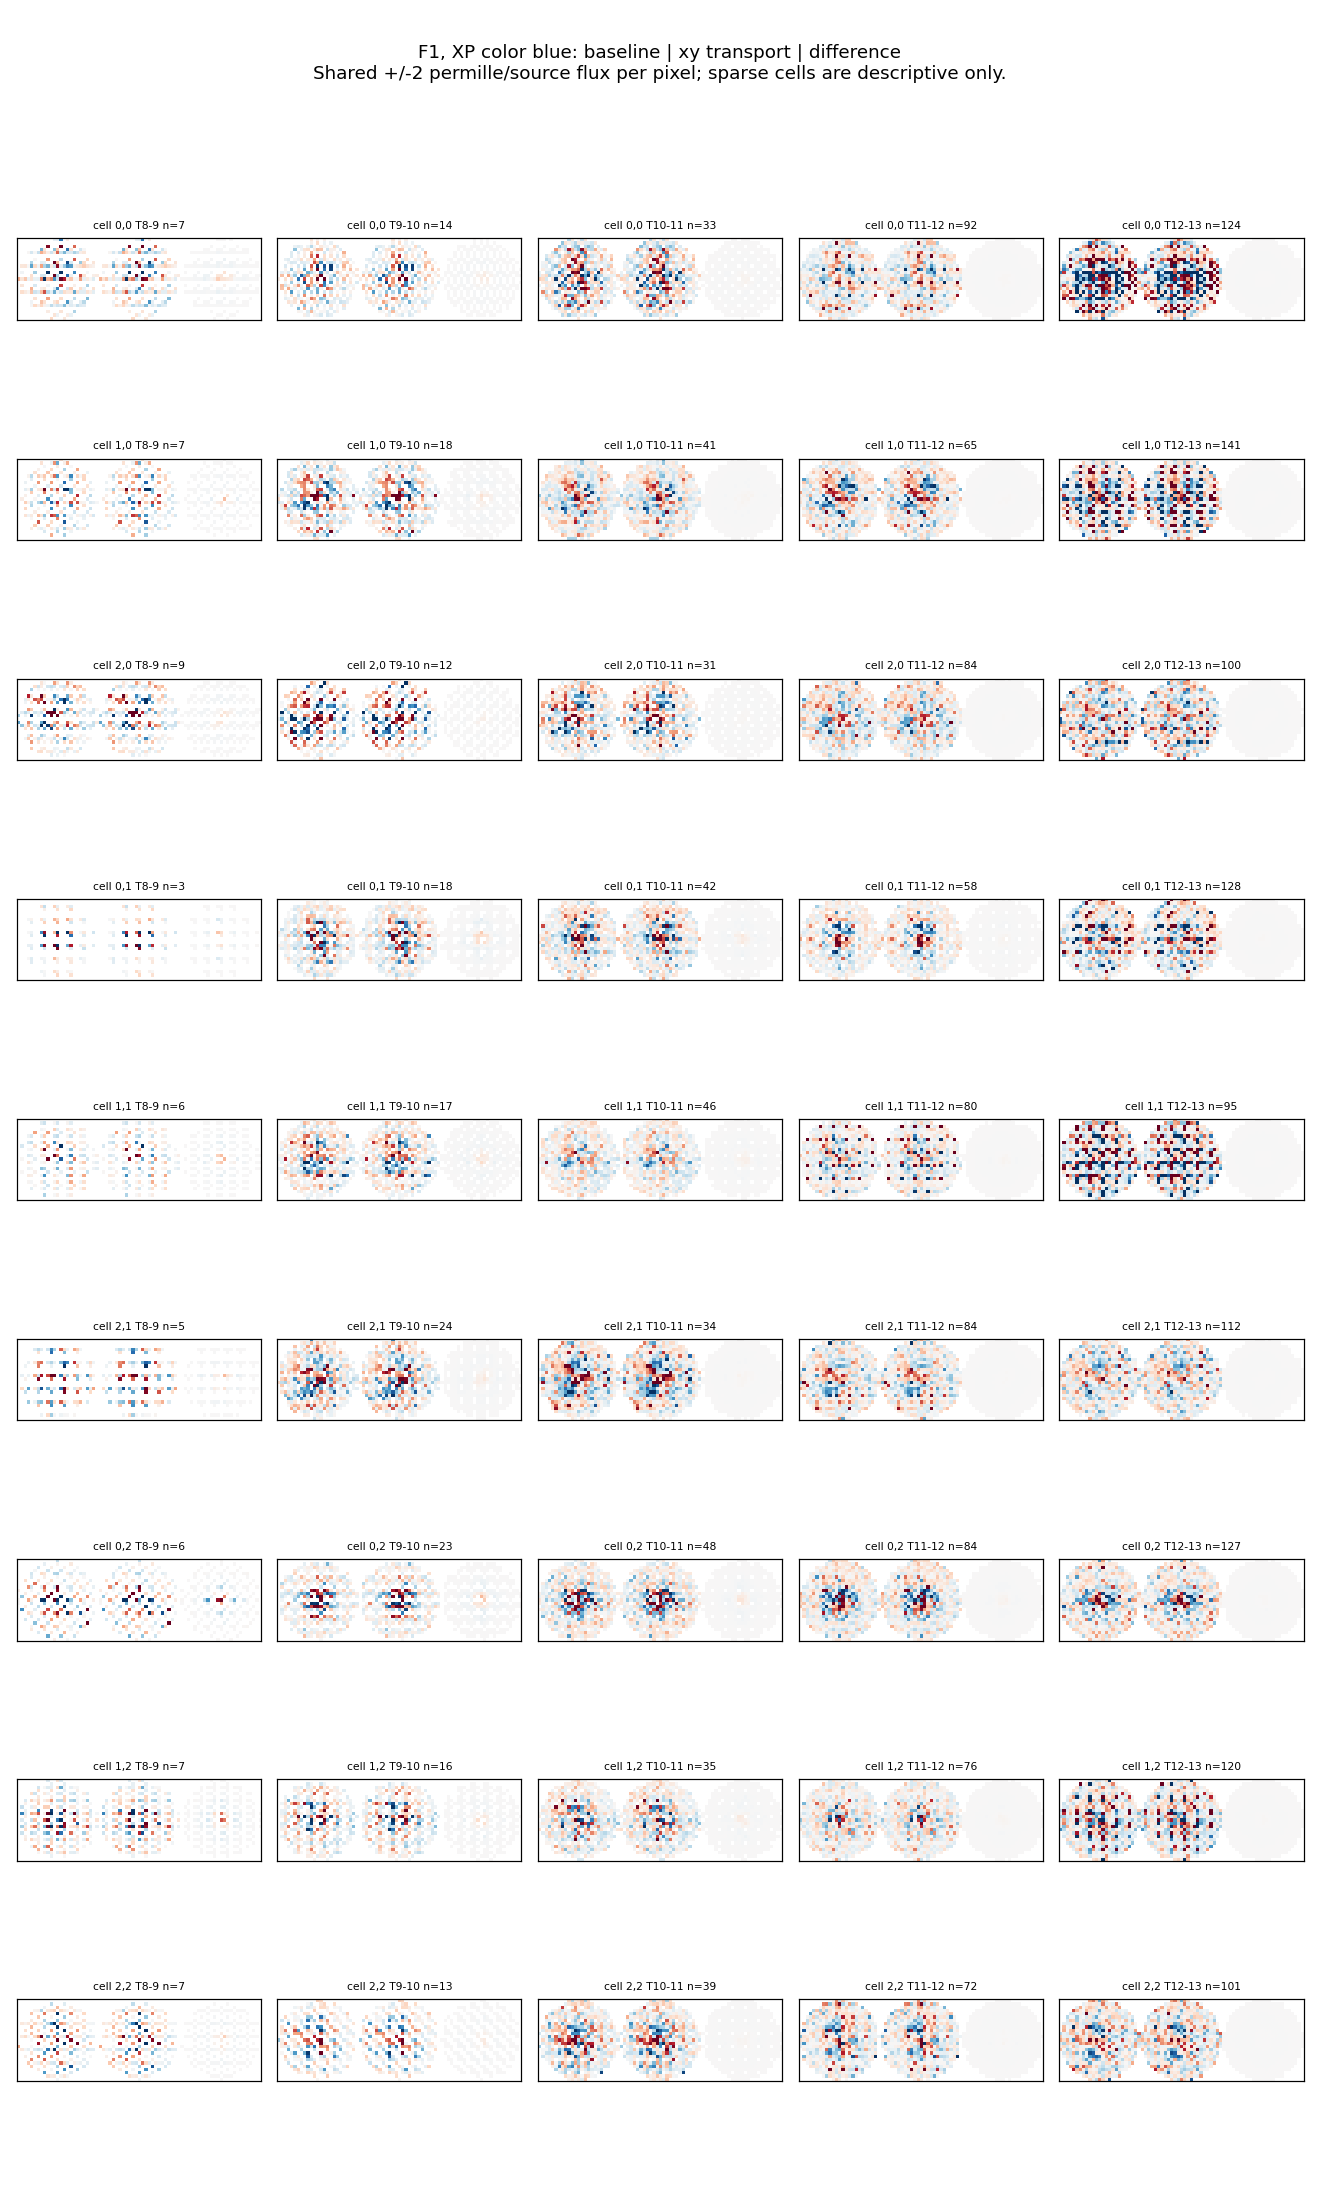
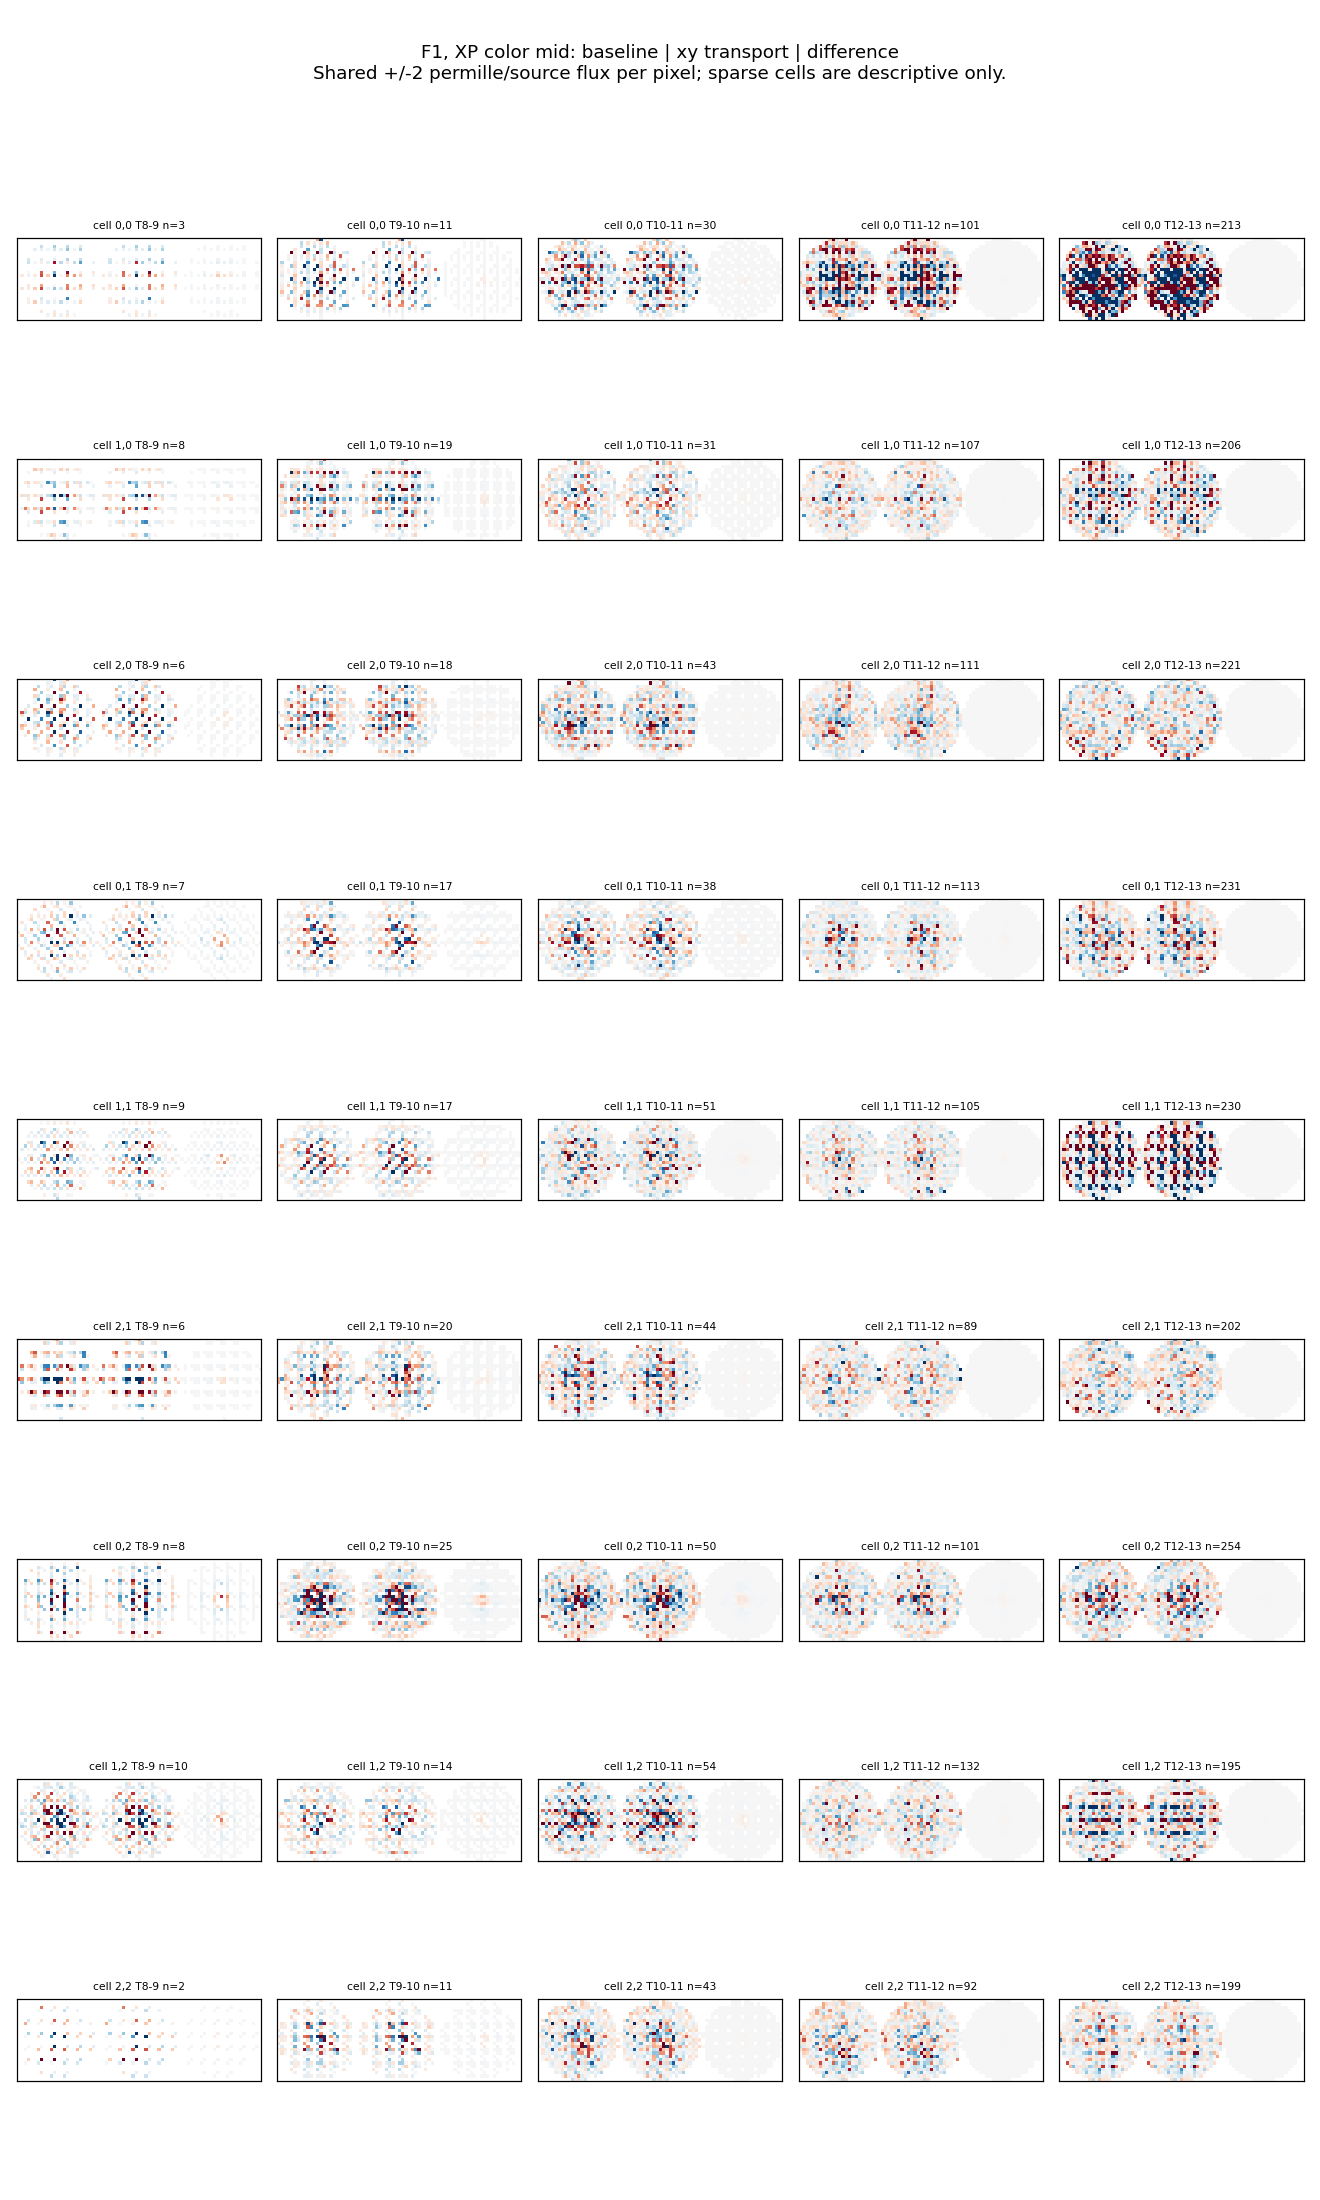
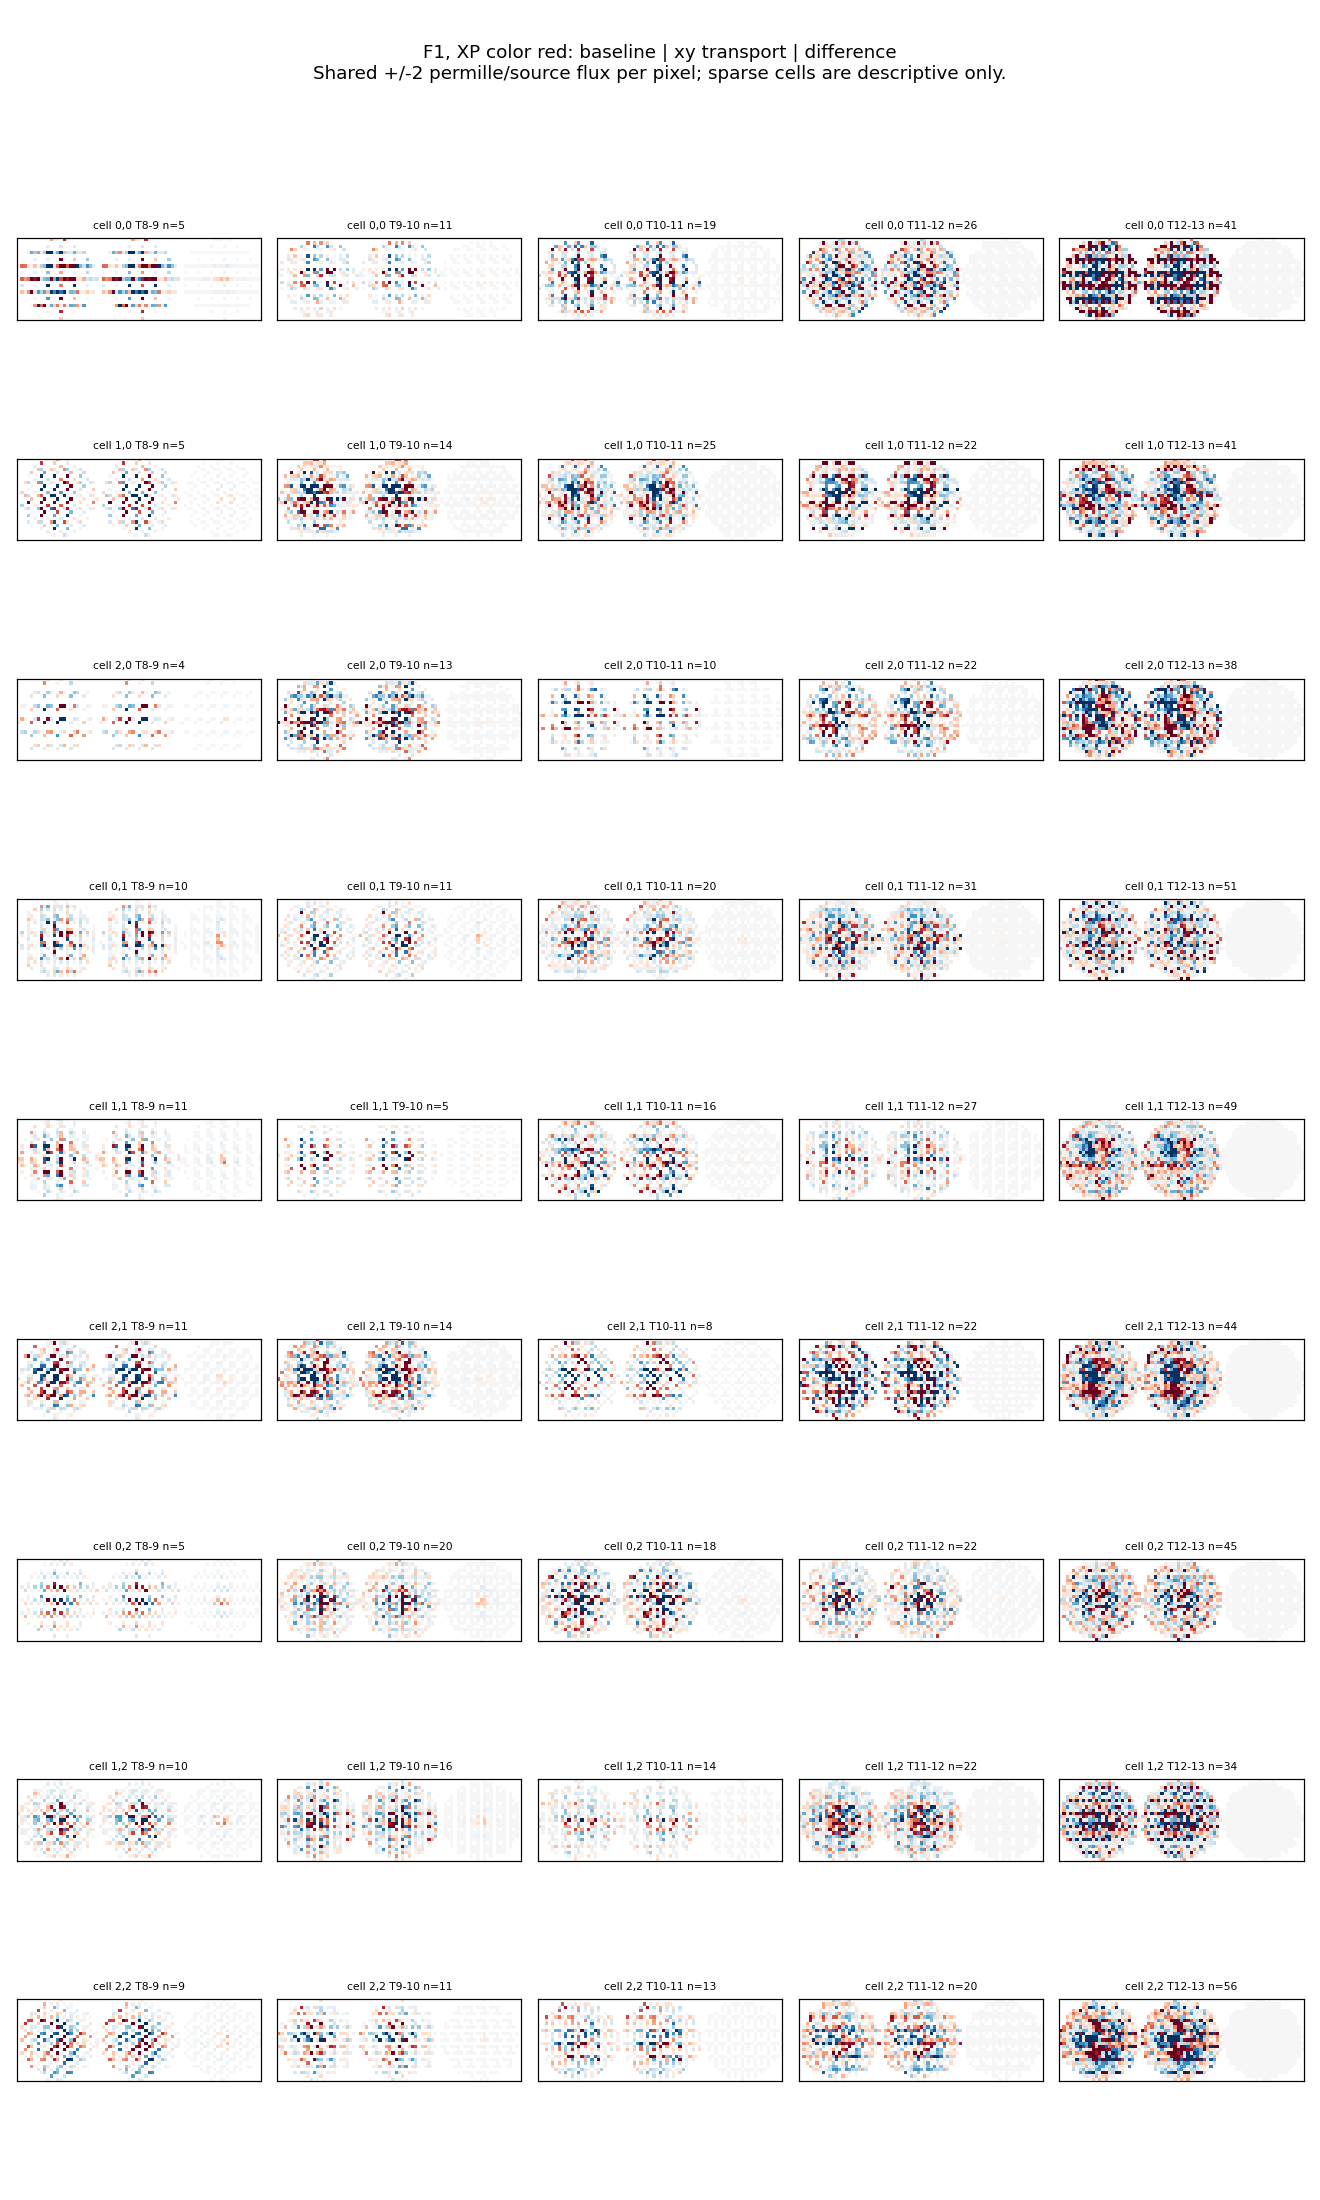
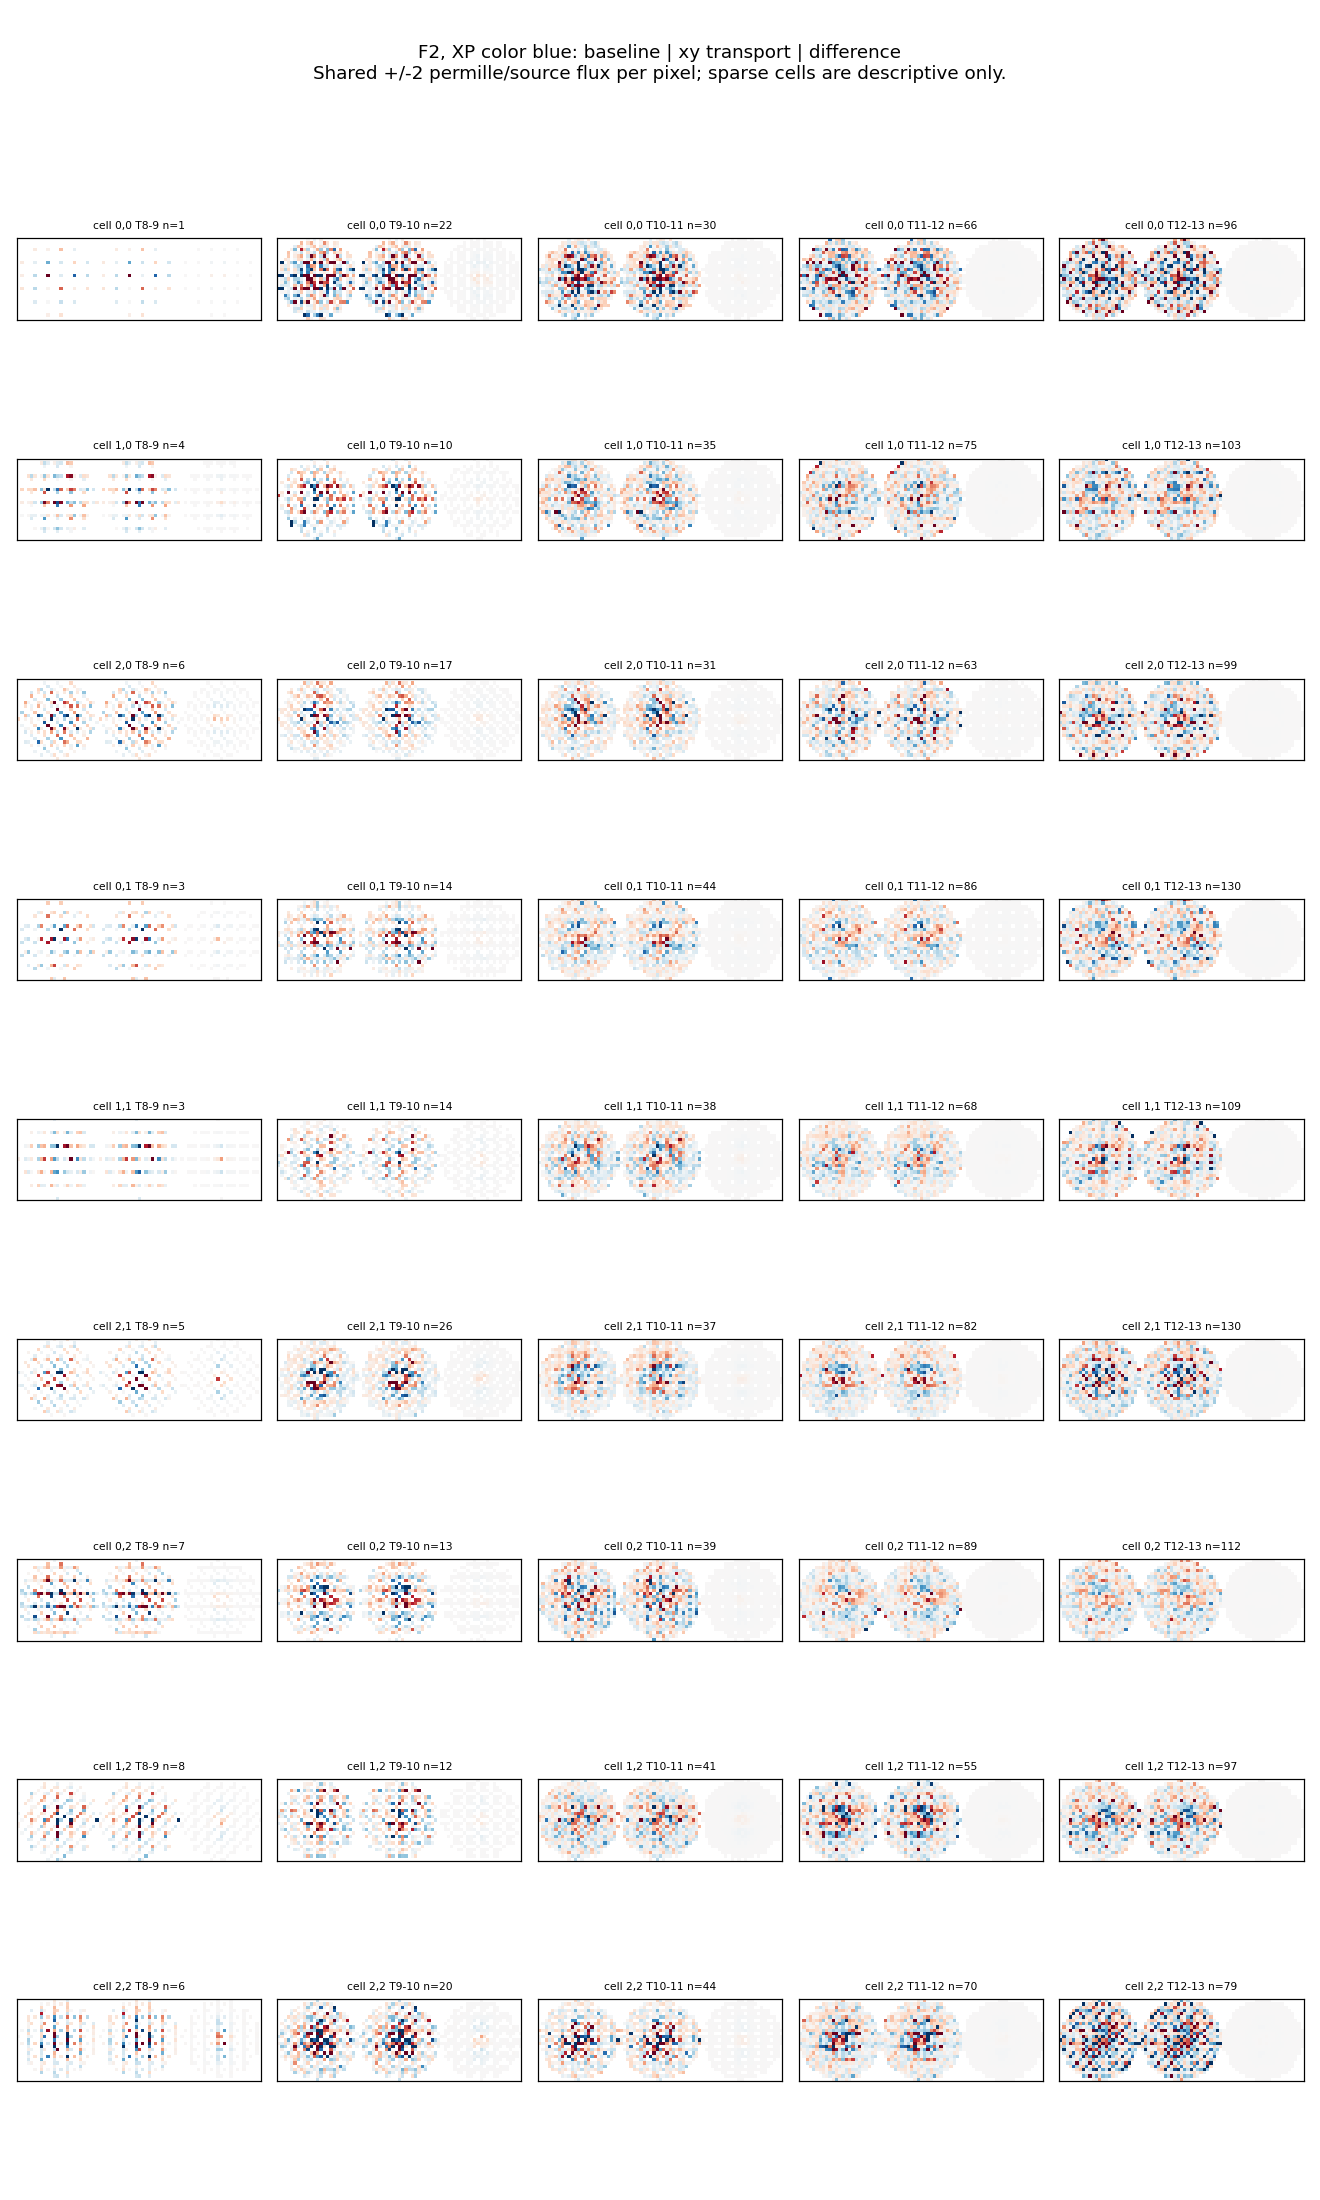
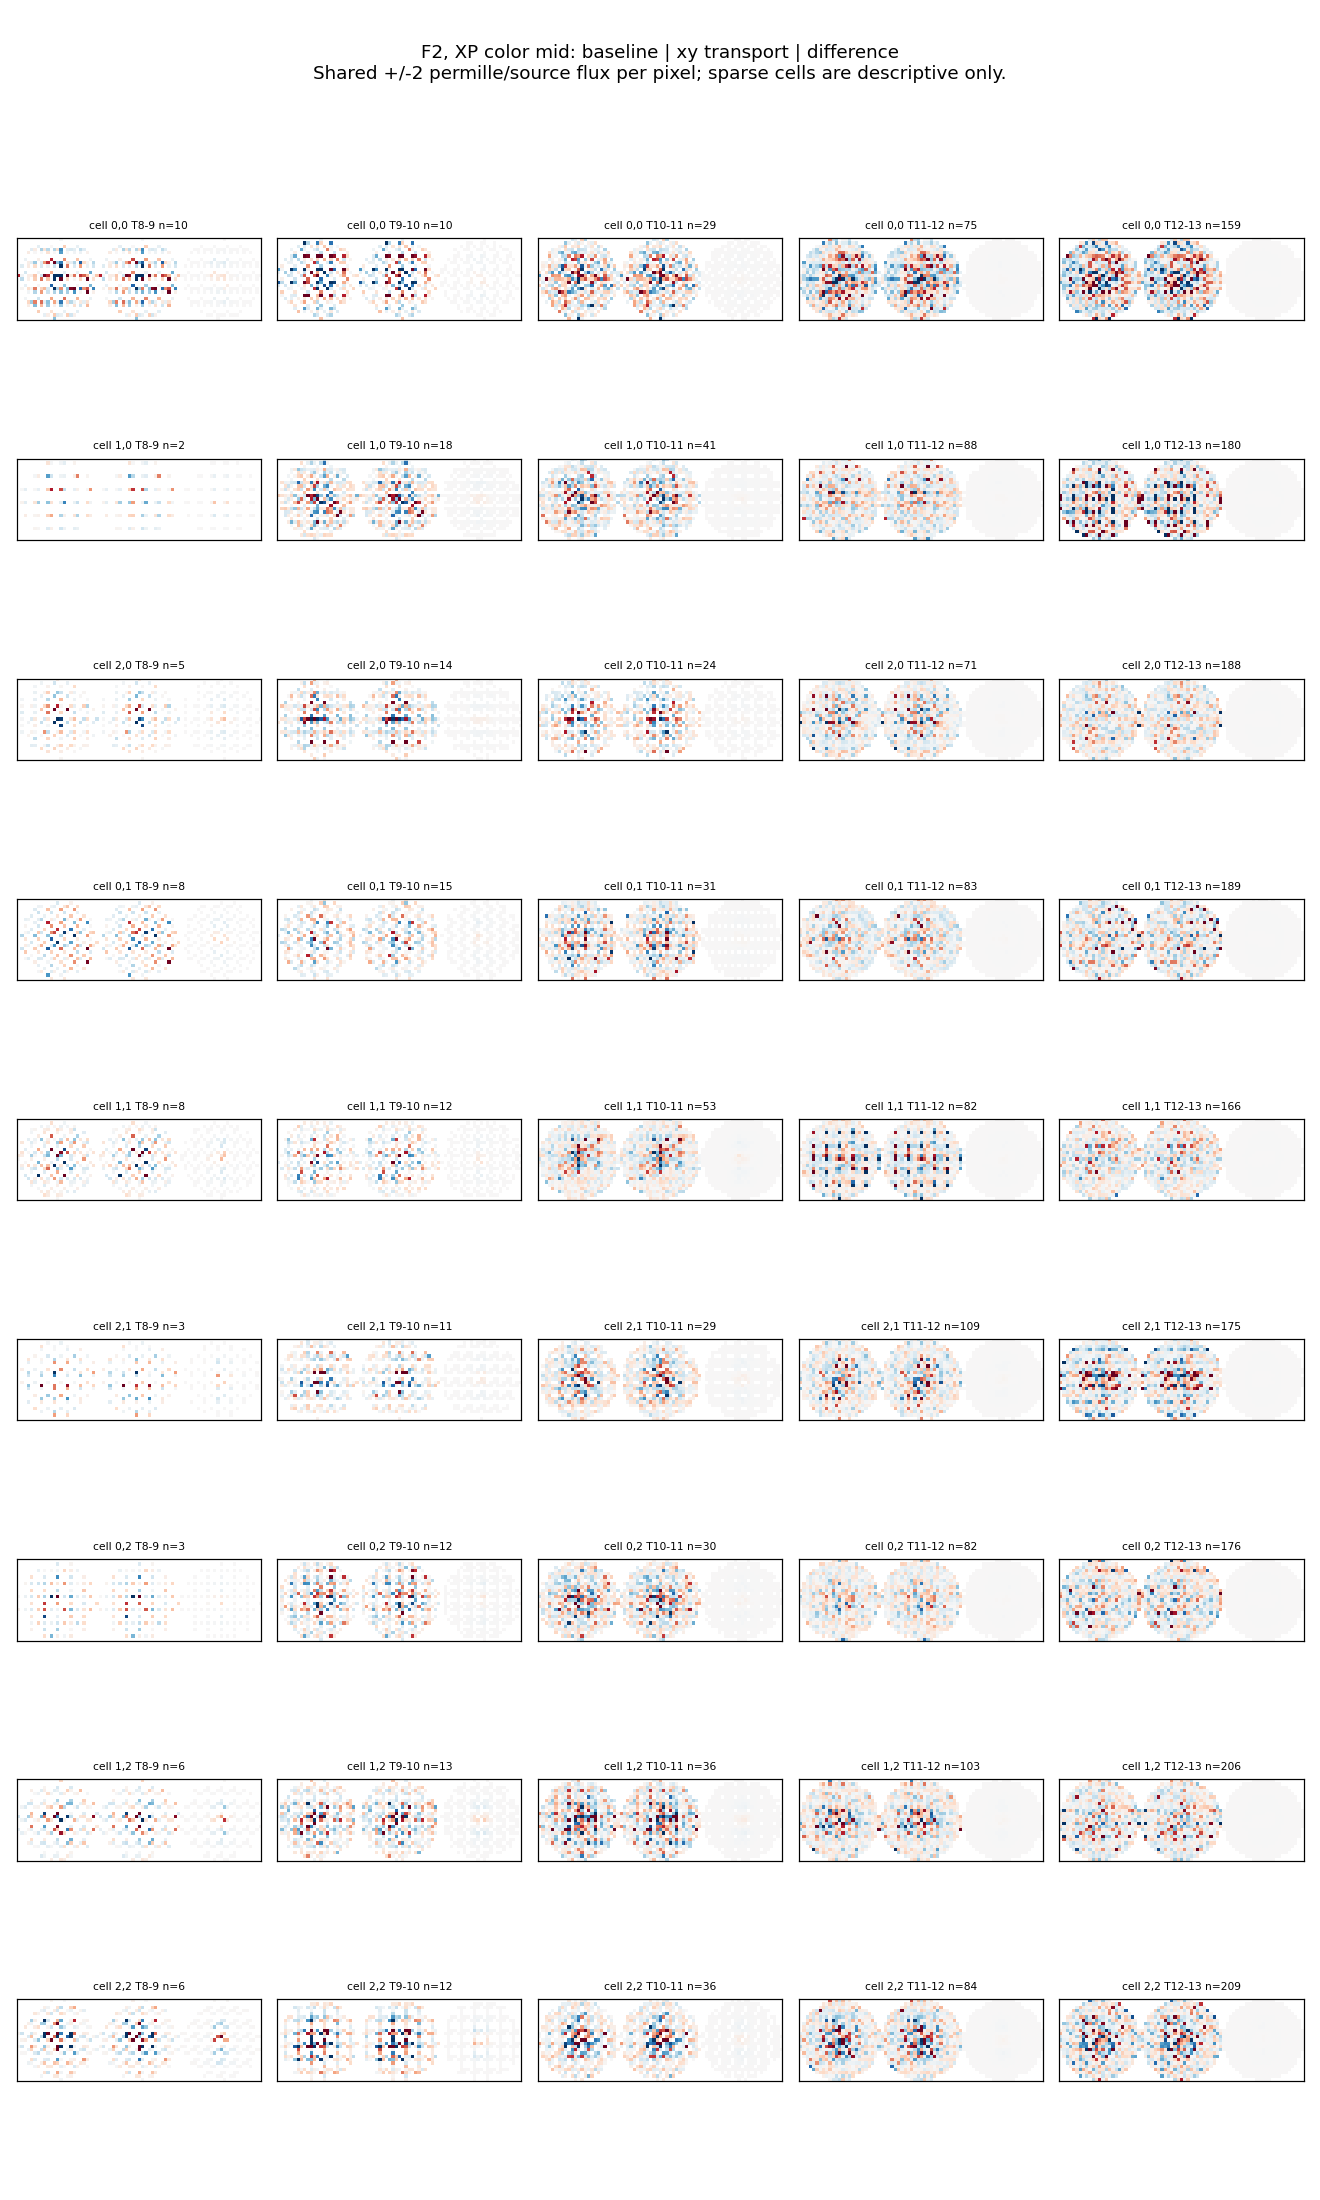
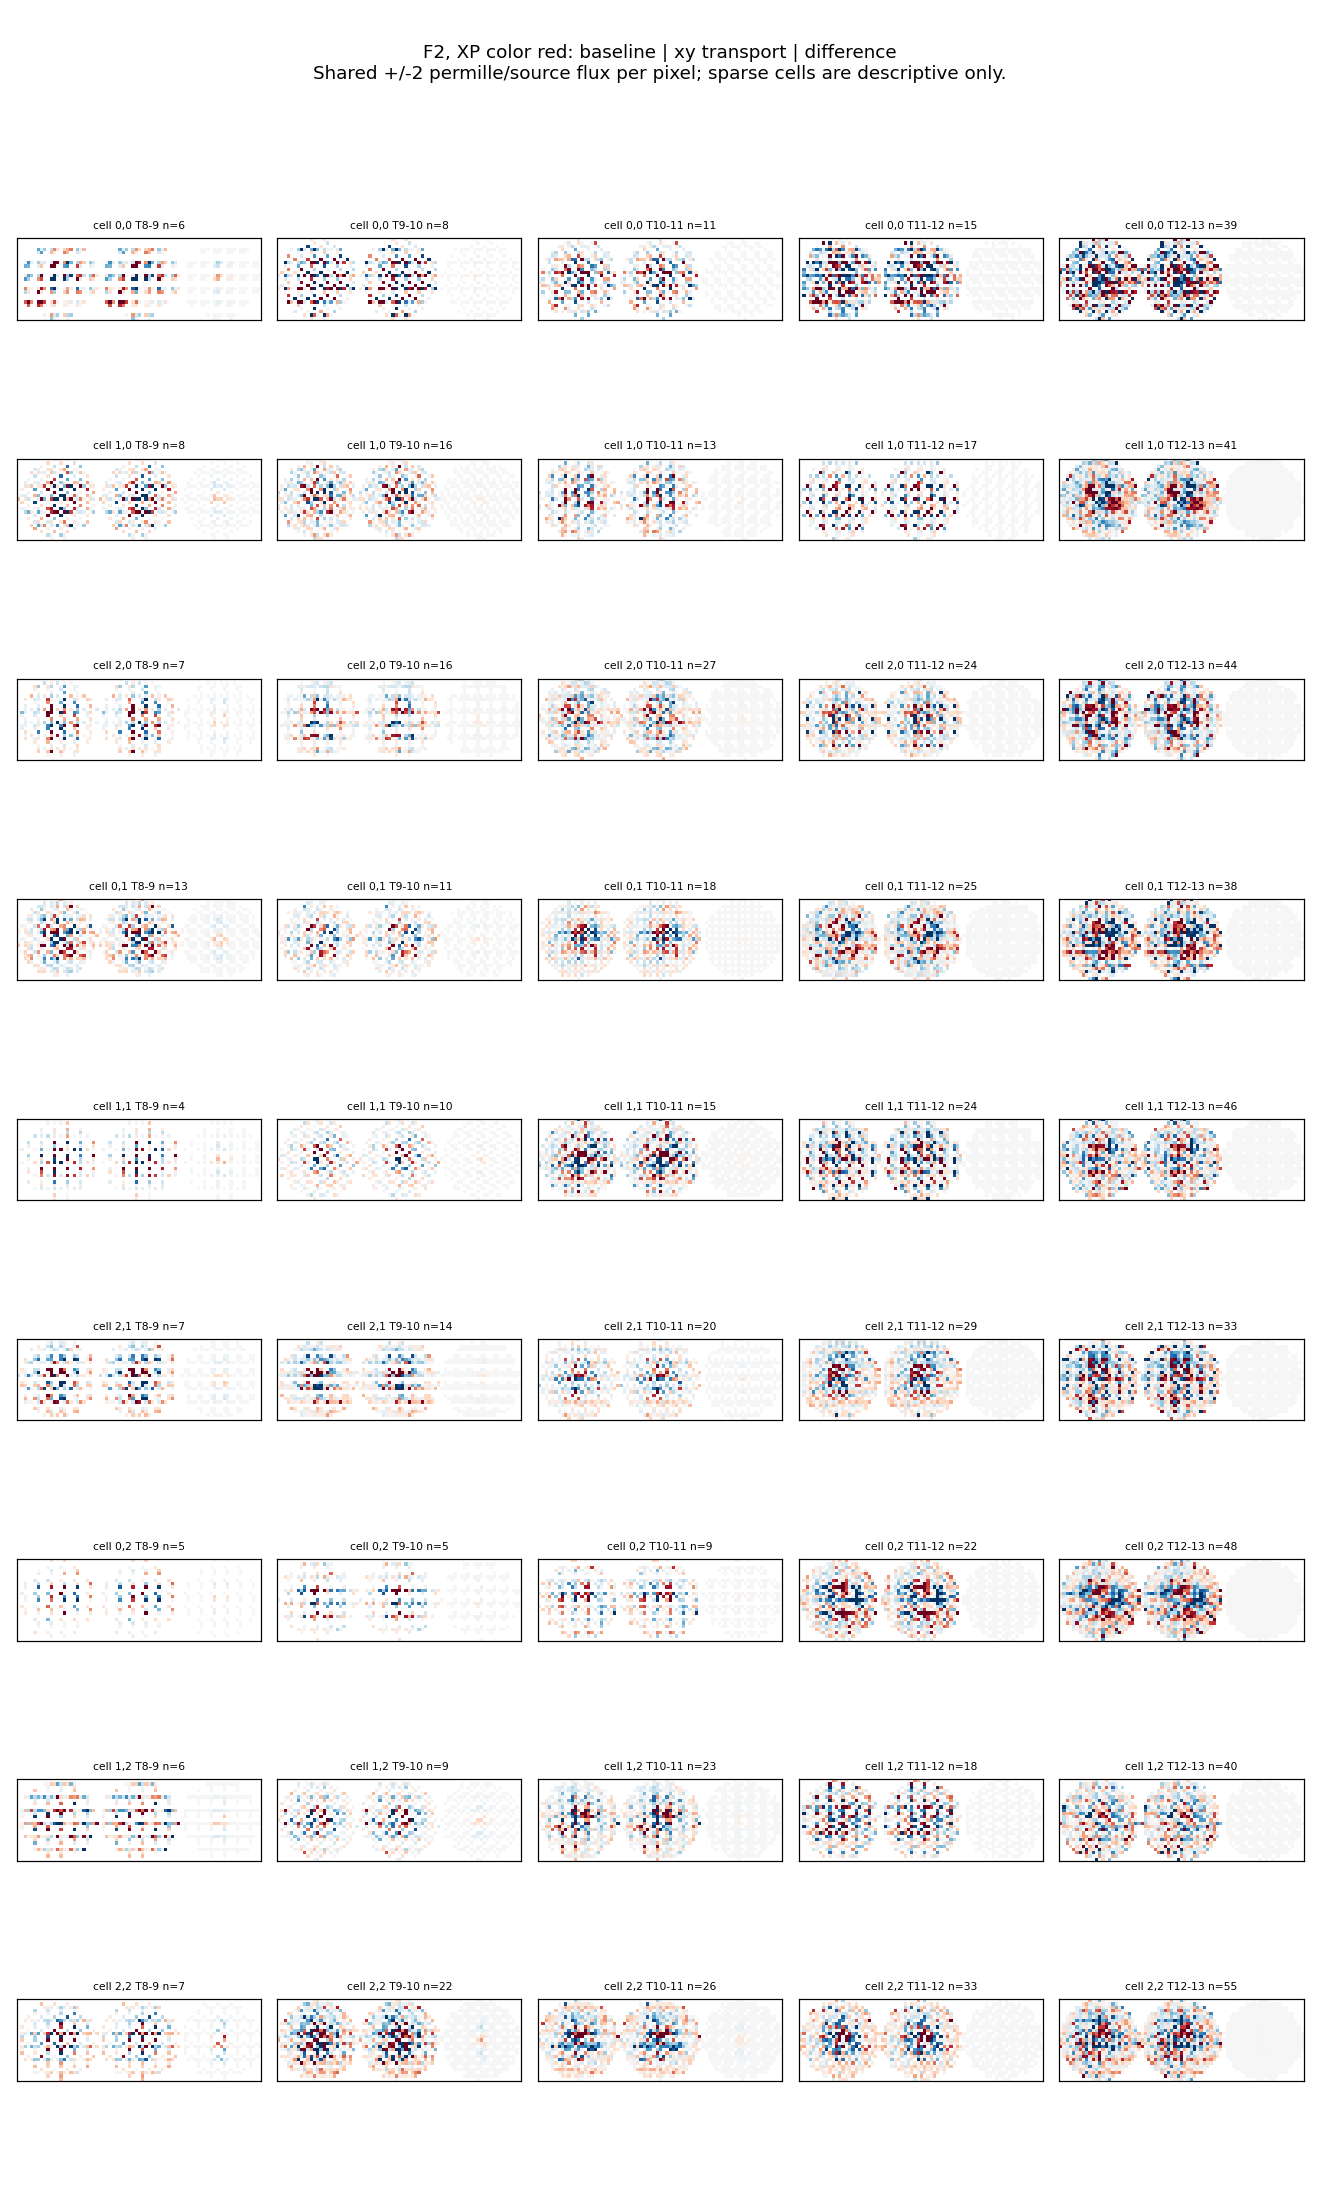
Selection is fixed before fitting: T8–13, positive flux, at least 20 valid core pixels, no masked pixel inside radius 2 pixels, modeled neighbor contamination below 1% inside radius 4 pixels. Missing or removed sources cannot be assessed by that modeled-contamination statistic. Pixel samples are binned into a quarter-pixel display grid using their recorded phase; numerical scores always use native pixels. Display stacks are arithmetic means, and sparse cells remain visibly incomplete.
F1: 6742 fixed clean evaluation stars, 955 bright calibration/evaluation stars. Charge-conservation residual 9e-16; quadratic scaling exact in this test. Injected coefficients (1.0, 0.6) recovered as (0.9986, 0.5971) in units of 1e-3. Noise-null coefficients (0.0002, -0.0005); formal errors (0.0019, 0.0019).
F1: finite-faint-charge reference sensitivity uses fold medians [817.0, 817.0] electrons; held-out bright chi-square ratio 1.001424, conditional interval [0.998626, 1.004318].
F1: faint-reference gate fails to establish noise-only residuals: median core reduced chi-square 32.71 at T11–12 and 11.47 at T12–13, after four nuisance parameters. See the actual faint residual images; these numbers alone cannot separate reference error, noise miscalibration and scene omissions.
F2: 5968 fixed clean evaluation stars, 868 bright calibration/evaluation stars. Charge-conservation residual 1.3e-15; quadratic scaling exact in this test. Injected coefficients (1.0, 0.6) recovered as (0.9986, 0.6004) in units of 1e-3. Noise-null coefficients (-0.0034, 0.0022); formal errors (0.0016, 0.0016).
F2: finite-faint-charge reference sensitivity uses fold medians [933.0, 961.0] electrons; held-out bright chi-square ratio 0.997452, conditional interval [0.993154, 1.002335].
F2: faint-reference gate fails to establish noise-only residuals: median core reduced chi-square 25.20 at T11–12 and 7.29 at T12–13, after four nuisance parameters. See the actual faint residual images; these numbers alone cannot separate reference error, noise miscalibration and scene omissions.
The conditional null/injection tests reuse each star's saved profile. They validate the algebra and solver, not the physical correctness of the base ePSF or the observed noise model. F2's one noise-null realization has an x coefficient about 2.2 formal sigma from zero; it is not an exact-zero result.
Joint noiseless transport-only and response-only injections recover their intended coefficients to floating-point precision. A constant, brightness-independent blur leaks into the transport coefficient, demonstrating that imperfect reference shapes can mimic a transport signal.
Background sensitivities of 20 and 100 e-/s/pixel do not reverse the primary conclusion. These are assumed backgrounds, not reconstructed sky measurements. Three-point versus five-point centroid derivatives likewise do not reverse it.
Fixed normalized shape weights give no improvement in either field. Strong dependence on color, phase and magnitude prevents treating the per-star coefficients as a stable physical detector calibration. Only numerical values, not statistical significance for all such exploratory splits, are claimed.
The faint-charge pivot sensitivity subtracts the transport contribution corresponding to each fold's median T11–13 peak charge. It is an approximate reference convention, not an independent zero-charge reconstruction. It does not rescue the predictive result.
Historical data are hp_d difference images. The complete incident sky and removed-source scene are not represented. The primary transport uses the summed saved model as a scene proxy and low modeled crowding. No direct calibration of physical charge transport follows.
No stellar-variability preservation or absolute flux-truth test was performed. No full nonlinear fit, new ePSF training, or physical boundary-shift simulation was run. The colour/magnitude/CCD figures are diagnostic residual grids, not newly trained entries in the standard training-comparison registry.
Existing files are untouched. Inputs are bfwidth_prod_20260930/validation/renders/{F1,F2}_r2_A0_final.npz, their JSON provenance, and the referenced checkpoints. The September 30/October 1 A0 run changed ePSF contributors to T11–13; bright stars were astrometric/flux anchors, so they were not wholly absent from the original fitting process. Initialization was the recorded cross-section initial ePSF, not a newly generated faint-only initialization. The original results already documented incomplete faint-star modeling.
Code branch: codex/bf-transport-20261008, in /home/kshukawa/syndiff_pipeline/dev/.claude/worktrees/bf-transport-20261008; scripts under tools/bf_transport_20261008/. See provenance.json for input/checkpoint/code SHA256 identities.
Exact analysis commands (after activating syndiff; one CPU per process):
OPENBLAS_NUM_THREADS=1 OMP_NUM_THREADS=1 MPLCONFIGDIR=/tmp/bf_transport_mpl PYTHONDONTWRITEBYTECODE=1 python tools/bf_transport_20261008/diagnose.py --field F1
OPENBLAS_NUM_THREADS=1 OMP_NUM_THREADS=1 MPLCONFIGDIR=/tmp/bf_transport_mpl PYTHONDONTWRITEBYTECODE=1 python tools/bf_transport_20261008/diagnose.py --field F2
MPLCONFIGDIR=/tmp/bf_transport_mpl PYTHONDONTWRITEBYTECODE=1 python tools/bf_transport_20261008/report.py
Conclusion: the implemented transport approximation is numerically sound but not predictively supported by this test. Improve/validate the reference and full illumination model before interpreting fitted coefficients as CCD physics.