Training fixes residual grids
Every training run from the stop-rule, noise-floor and memorisation tests on F1 (S24 C2K2) and F2 (S20 C3K3). The table compares each run with the fresh baseline on the same held-out stars; click a row to see its residual grids below. Runs still training show as running; combinations that were never run show as not run.
Final run: STEP 1 colour model, template shift, new background
All five fields rerun end to end with the STEP 1 radial/coma colour model (no brightness width), the per-node template shift for the PS1 stack offset, the approved background (red_floor5) with saturation-bleed and bad-column masks, adopted band weights, and the bootstrap side rerun on the new background. Templates are reused from the earlier run, so they come from that run's WCS, not this fit's. C4 (and F1's refit) trained on Colab T4; a CPU twin of one C4 fold agrees (held-out χ² ratio 0.9995 ± 0.0003).
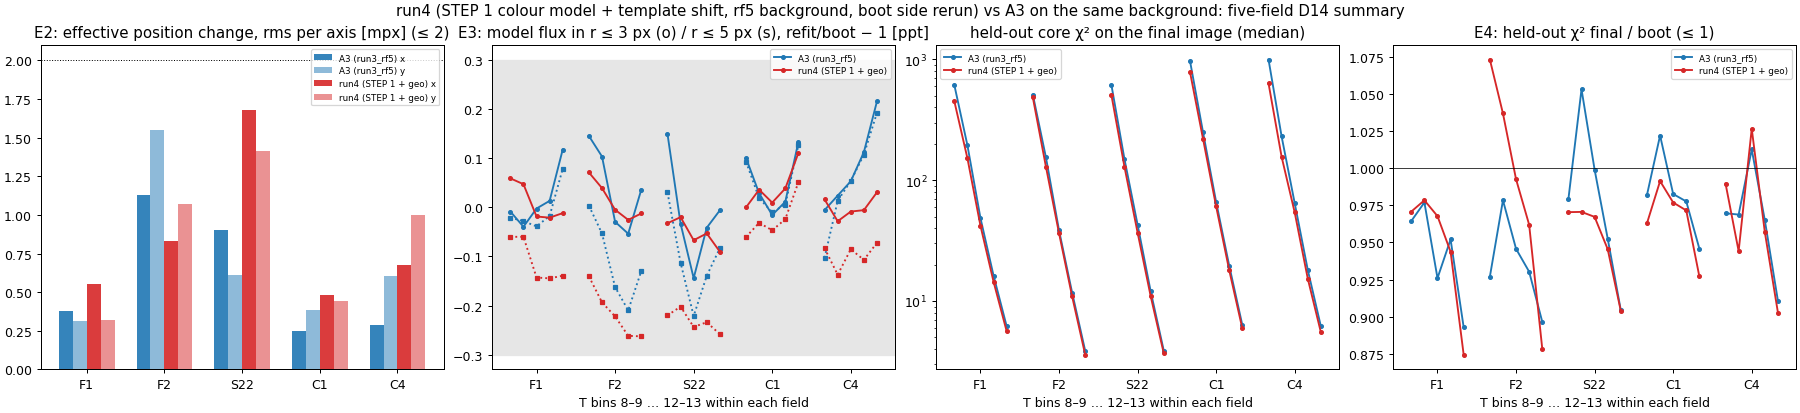
- G4 passes on all five fields, including C4 (which failed with the earlier A3 model): red-star χ² 8.38 → 4.99 and the red−blue dipole +19.2 → +1.3 mpx on C4.
- Held-out core χ² on the final image is lower than A3 in every field and magnitude bin (5–37 %).
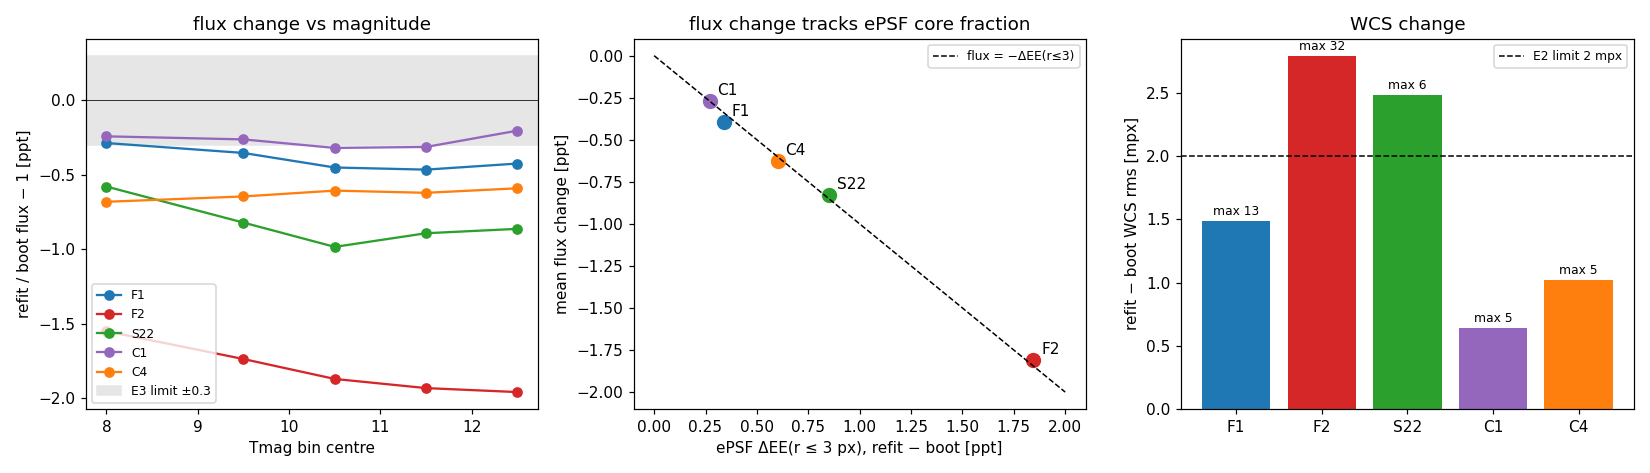
- E2 (rms per axis ≤ 2 mpx on effective positions, as pre-registered and signed off) and E3 (flux within ±0.3 ppt at a fixed aperture) pass on every field. Total-flux offsets (−0.2 to −1.05 ppt, flat in magnitude) are the ePSF wing normalisation.
- E5, the bright-star memorisation gap (pre-registered: median held-out / median in-fold core χ² at T8–9 ≤ 1.3 on both images, in every fold), still fails on every field, as with A3; fold medians 1.09–1.41, folds scatter 0.9–1.8. E4 fails in two bright F2 bins only because F2's bootstrap fit improved more than its final fit.
| field | E2 effective x / y [mpx] (WCS) | E3 r≤3 / r≤5 max |Δ| [ppt] (total) | E4 | held-out χ² final: run4 / A3, T8–9…12–13 | E5 T8–9 gap, fold median (min–max); boot; A3 (≤ 1.3, every fold, both images) | E6 axis final / boot | G4 (A3) | G4 H χ² / red χ² / dipole, run4 (A3) |
|---|---|---|---|---|---|---|---|---|
| F1 | 0.55 / 0.32 ✓ (0.90 / 0.74) | 0.06 / 0.14 ✓ (-0.58…-0.43) | 5/5 ✓ | 452 152 41.9 14.4 5.6 / 616 195 48.5 16.2 6.2 | 1.09 (0.92–1.77); boot 1.10; A3 1.25 ✗ | -0.57 / -0.56 ≈ | PASS (PASS) | 2.13 / 3.81 / +16.1 (2.46 / 4.82 / +18.9) |
| F2 | 0.83 / 1.07 ✓ (1.38 / 1.38) | 0.07 / 0.26 ✓ (-1.05…-0.77) | 3/5 ✗ | 484 129 36.4 10.9 3.6 / 510 154 38.4 11.7 3.9 | 1.37 (1.14–1.44); boot 1.28; A3 1.18 ✗ | -0.41 / -0.42 ✓ | PASS (PASS) | 1.41 / 2.84 / +12.5 (1.45 / 3.93 / +17.2) |
| S22 | 1.68 / 1.41 ✓ (2.96 / 2.69) | 0.09 / 0.26 ✓ (-1.02…-0.98) | 5/5 ✓ | 507 129 36.8 10.9 3.7 / 614 149 42.8 12.0 3.9 | 1.41 (0.94–1.79); boot 1.46; A3 1.41 ✗ | -0.40 / -0.42 ✓ | PASS (PASS) | 1.37 / 3.05 / +2.2 (1.44 / 4.18 / +6.7) |
| C1 | 0.48 / 0.44 ✓ (0.91 / 0.50) | 0.11 / 0.06 ✓ (-0.27…-0.17) | 5/5 ✓ | 788 219 60.6 18.0 5.9 / 974 249 65.9 19.5 6.3 | 1.33 (1.10–1.83); boot 1.38; A3 1.39 ✗ | -0.42 / -0.42 ≈ | PASS (PASS) | 1.74 / 3.24 / +10.5 (2.04 / 4.17 / +11.7) |
| C4 | 0.67 / 1.00 ✓ (0.99 / 1.09) | 0.03 / 0.14 ✓ (-0.55…-0.46) | 4/5 ✗ | 633 156 54.0 15.3 5.5 / 997 230 64.5 18.0 6.2 | 1.29 (1.13–1.39); boot 1.26; A3 1.26 ✗ | -0.18 / -0.19 ✓ | PASS (FAIL) | 2.89 / 4.99 / +1.3 (3.19 / 8.38 / +19.2) |
Record: /astro/armin/koji/syndiff/dev_runs/e2e_final_recipe_20261007/README.md ("run4 RESULTS"); branch claude/paper1-final-v2-20261009 (not merged).
Final runs: residual grids
Pick a field, the image the recipe was trained on, the stars to stack and the fold. Each fold fit trains on 4/5 of the stars; its held-out fifth is never seen by that fit. The table shows that fold's median core χ² per magnitude bin; in the Final image view the last row gives the final/boot ratio for the same held-out stars' bin medians.
End-to-end check of the final recipe
The final recipe (neighbours from the verified removal ledger, per-star weight cap at T 10.5, T 11–13 stars training the shape, smoothed stop rule) was moved onto the main branch. On each field the pipeline fits the bootstrap image, builds new per-band templates from that fit's WCS, makes the final de-crowded image with kernels from the same fit, and trains the same recipe again on it. Every fit has a 5-fold held-out check. The refit is compared with the bootstrap fit (D14).
| field | E2 WCS rms x / y [mpx] | effective position x / y | E3 total flux −1 [ppt] | flux in r ≤ 3 / r ≤ 5 px [ppt] | E4 held χ² lower | E5 T8–9 gap | G4 |
|---|---|---|---|---|---|---|---|
| F1 | 0.57 / 1.37 | 0.38 / 0.48 | −0.29…−0.47 | ±0.05 / ≤0.12 | 5/5 | 0.91–1.47 | PASS |
| F2 | 1.40 / 2.41 | 1.11 / 1.87 | −1.55…−1.96 | ≤0.24 / ≤0.29 | 5/5 | 1.06–1.49 | PASS |
| S22 | 1.53 / 1.96 | 0.81 / 0.98 | −0.58…−0.98 | ≤0.17 / ≤0.28 | 4/5 | 1.08–2.00 | PASS |
| C1 | 0.42 / 0.48 | 0.27 / 0.39 | −0.20…−0.32 | ≤0.10 / ≤0.07 | 4/5 | 1.09–2.04 | PASS |
| C4 | 0.57 / 0.85 | 0.34 / 0.61 | −0.59…−0.68 | ≤0.07 / ≤0.22 | 4/5 | 0.91–1.71 | FAIL* |
Limits: E2 ≤ 2 mpx per axis, E3 |Δ| ≤ 0.3 ppt in every T bin, E5 ≤ 1.3. The E5 gap is the same on the bootstrap image. *C4's G4 fail comes from a bright-template-core deficit (T < 13.6) plus a smaller red-star gain; the user chose to continue.
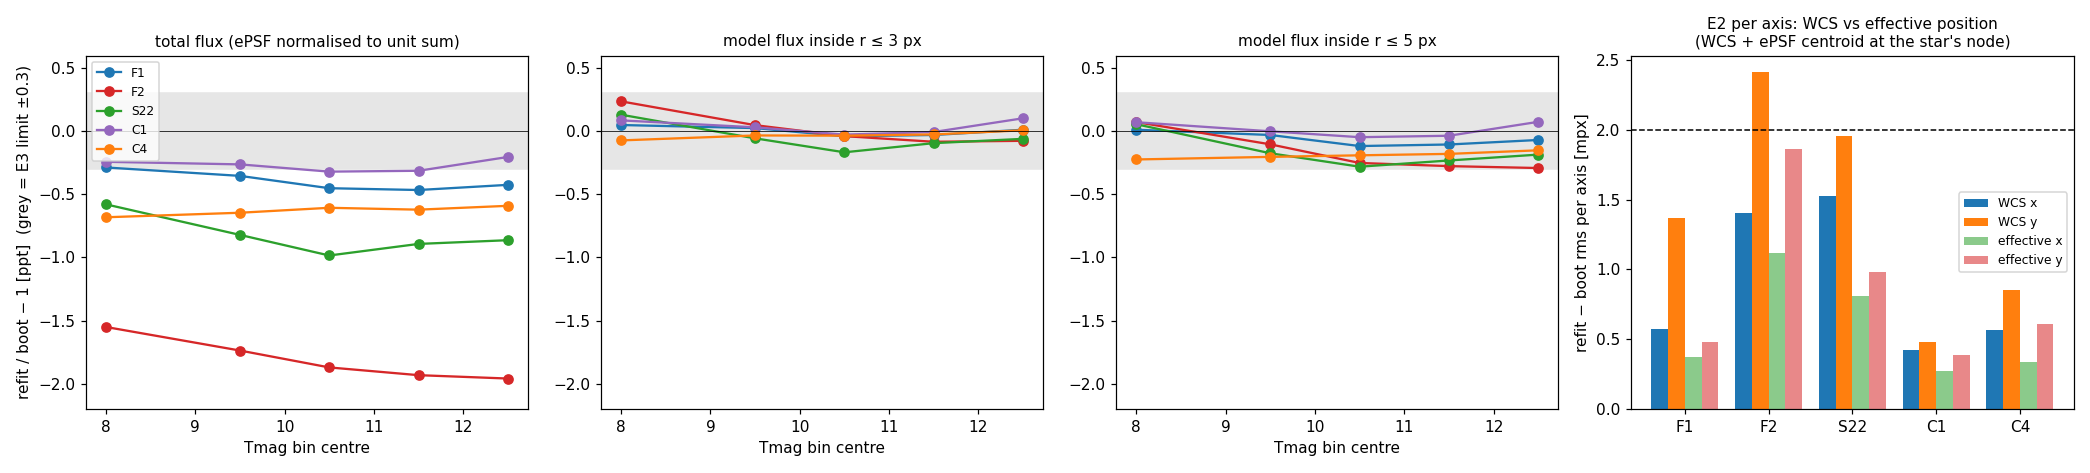
- Flux. The total-flux offset equals the change in the ePSF's core fraction: flux − 1 = −0.96 × ΔEE(r ≤ 3) − 0.04 ppt across the five fields (r = −0.999). The refit ePSF carries less light in its wings, and normalising it to unit sum moves every solved flux. Model flux inside a fixed aperture agrees to within ±0.3 ppt on every field and magnitude bin. The data themselves do not change. The wing study below shows the refit's fainter wing is the better one (user signed off E2/E3 on 10-09).
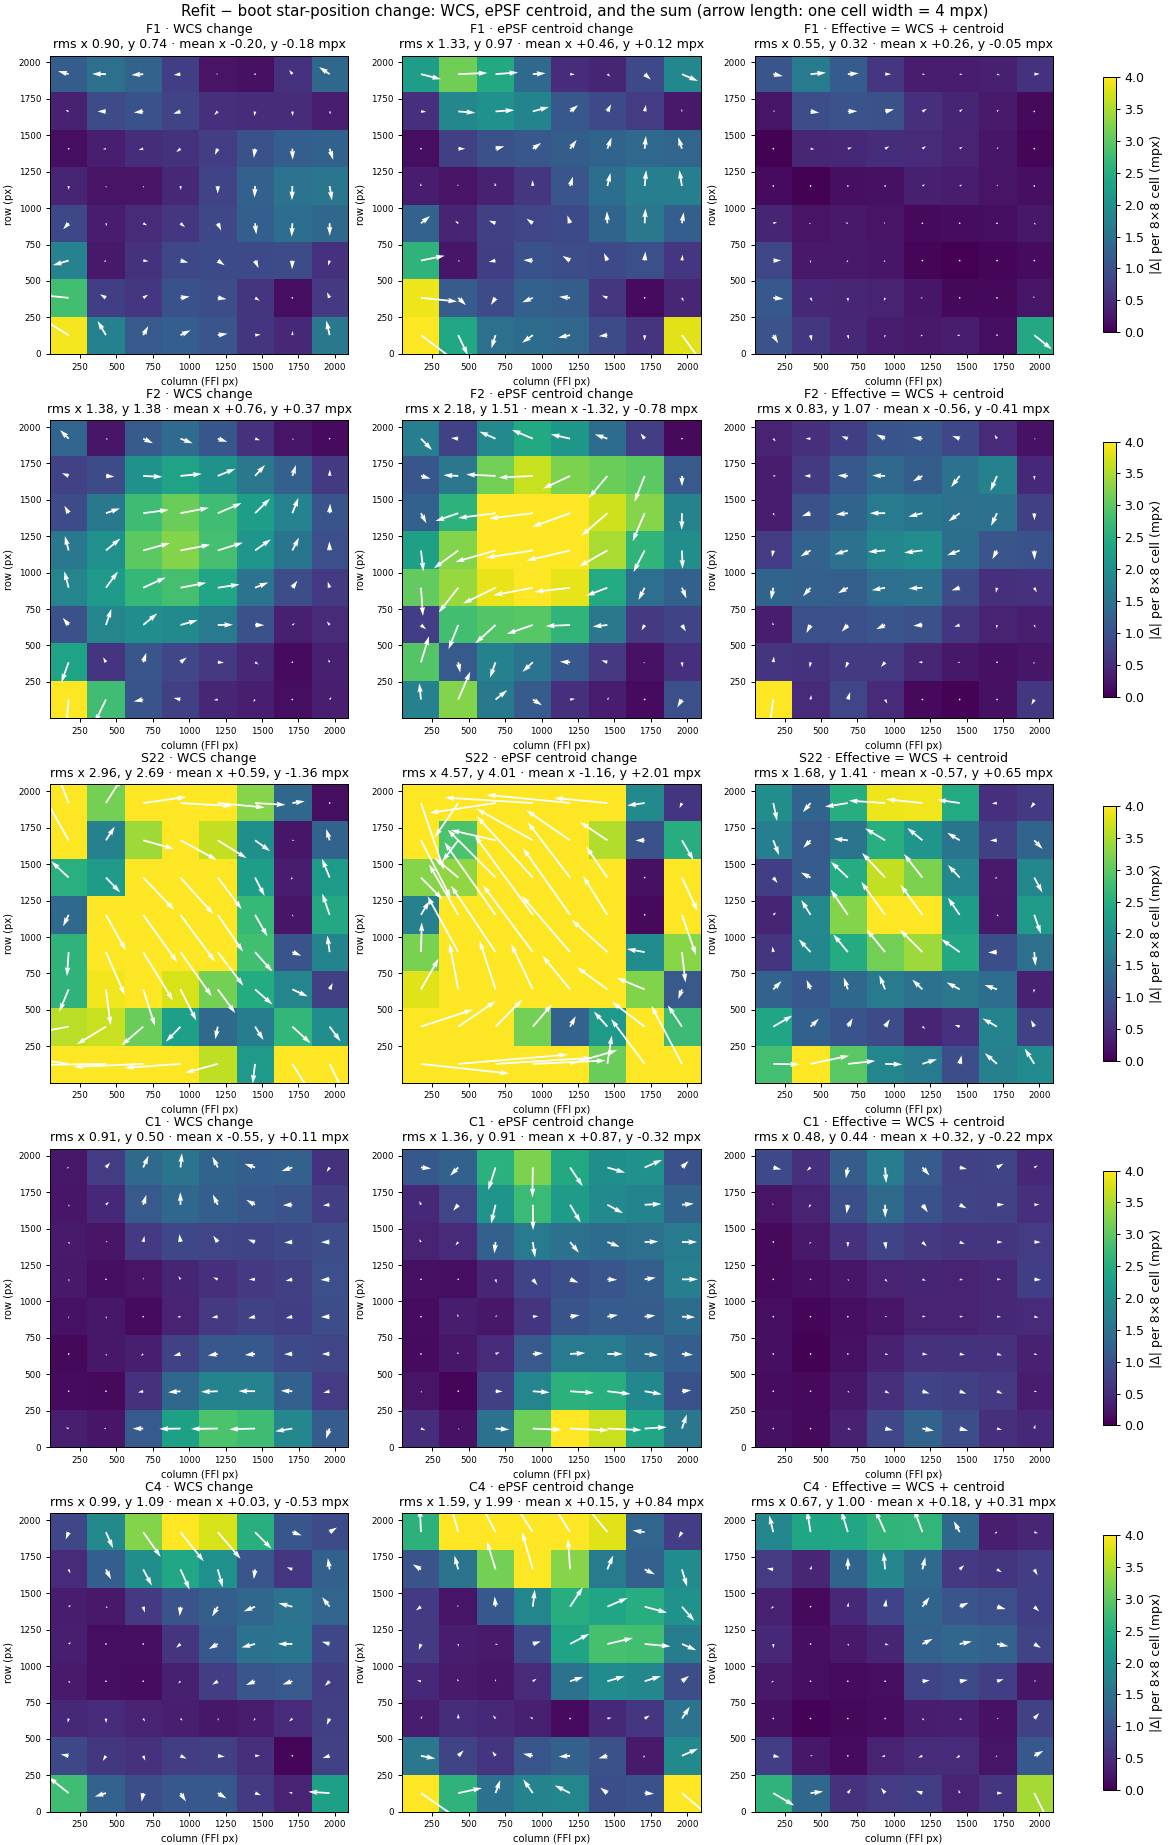
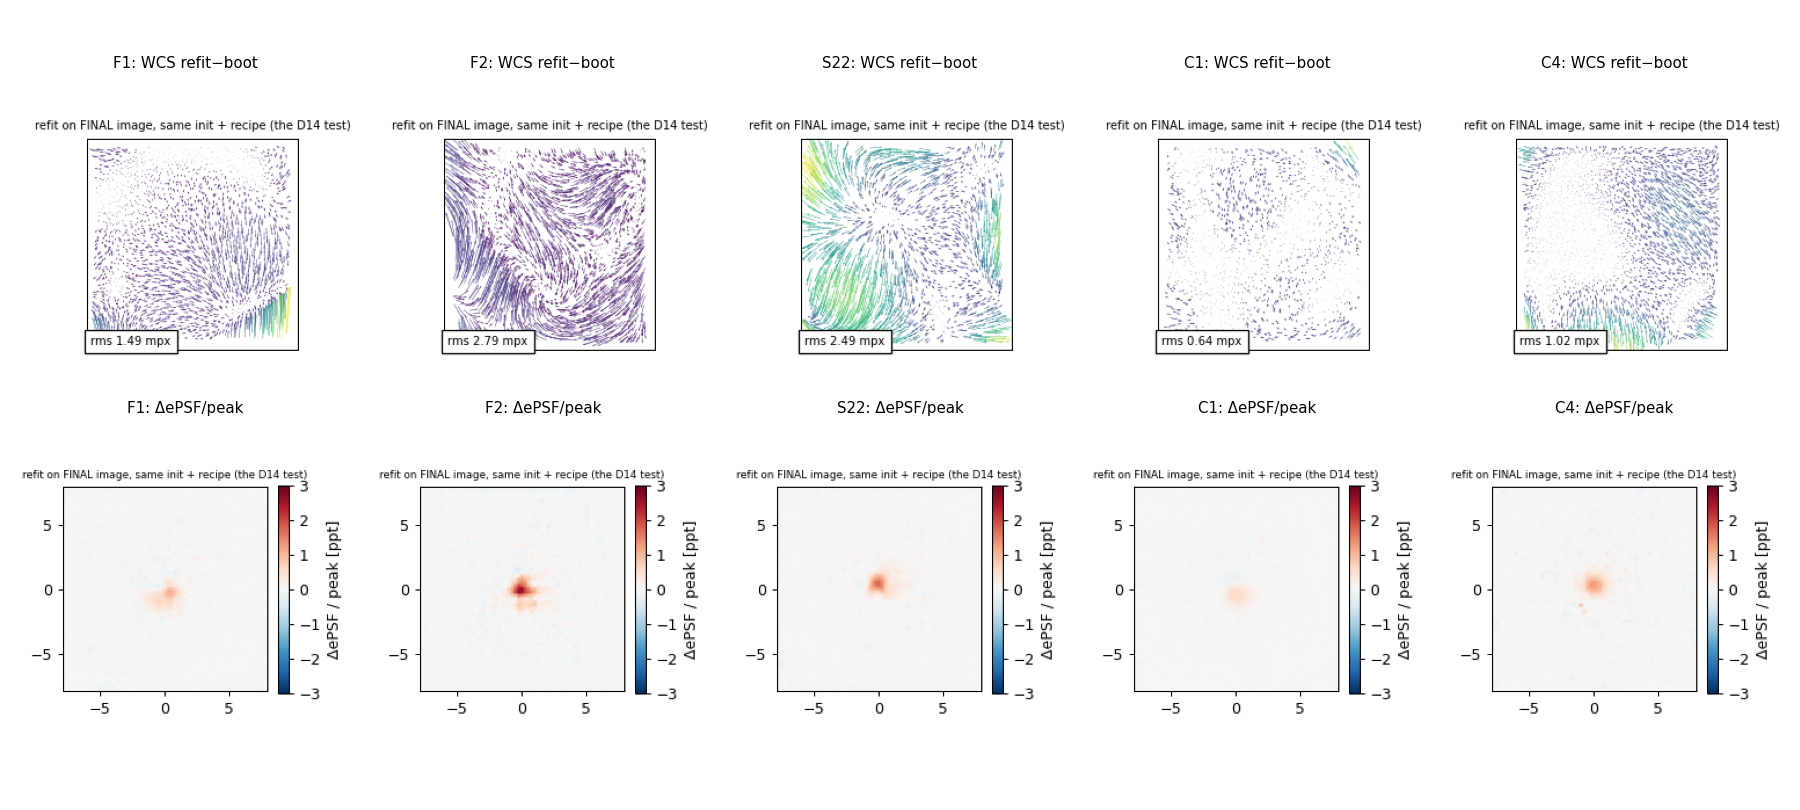
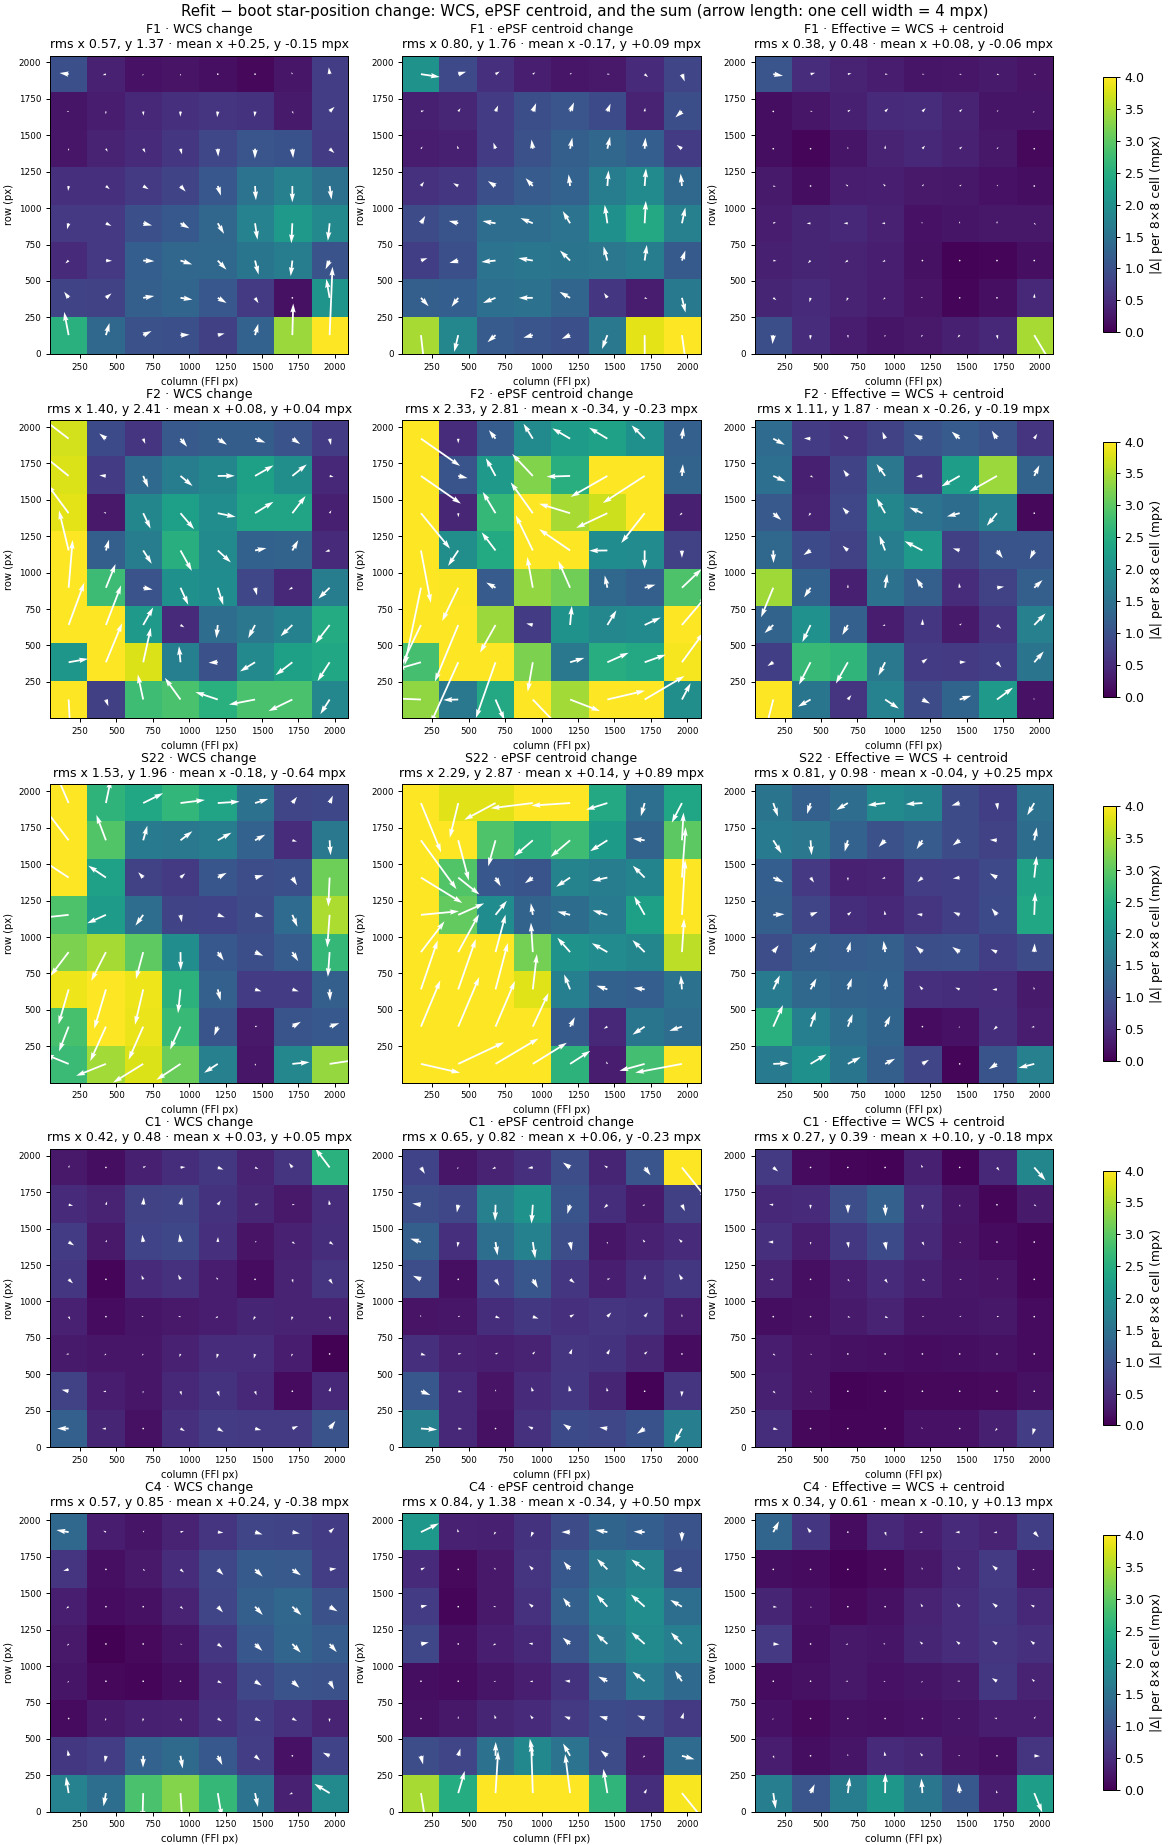
- WCS. Only F2's y axis exceeds 2 mpx on the WCS alone. Effective star positions (WCS plus the ePSF centroid at each star's node) move at most 1.87 mpx per axis. Most of the swirl is a trade between the WCS polynomial and the ePSF node centroids; the rest is largest at CCD edges and corners.
- Held-out χ². The final image gives lower held-out core χ² in 22 of 25 field × magnitude bins.
Final images on the new background: G4
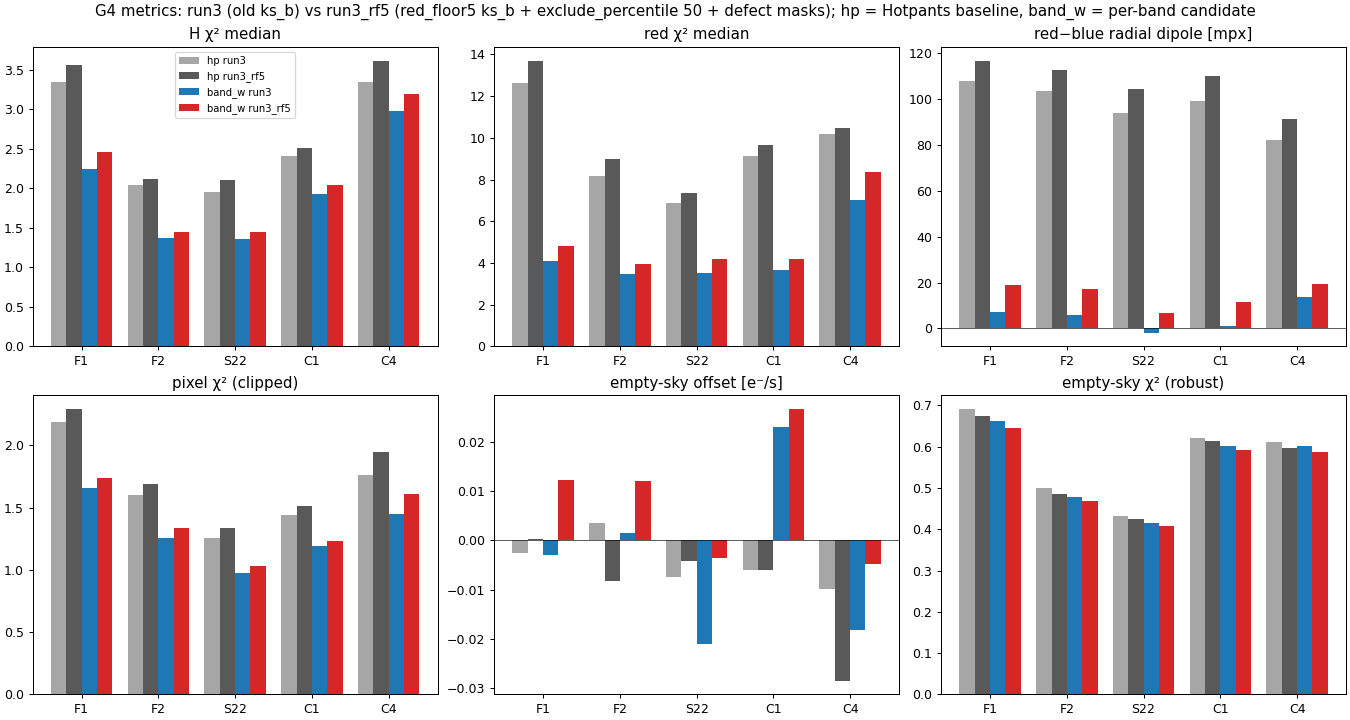
Hotpants, the final images and G4 rerun on the user-approved background; saturation bleeds and bad columns are masked in the final images (kernel fit, match, output mask, scorer, training scene). Verdicts are unchanged: F1, F2, S22, C1 PASS; C4 FAIL as before. Every metric moves slightly the wrong way on every field, for both the Hotpants baseline and the per-band image: H χ² +3–10%, red χ² +6–20%, red−blue radial dipole +5…+11 mpx (σ ≈ 2.4 mpx).
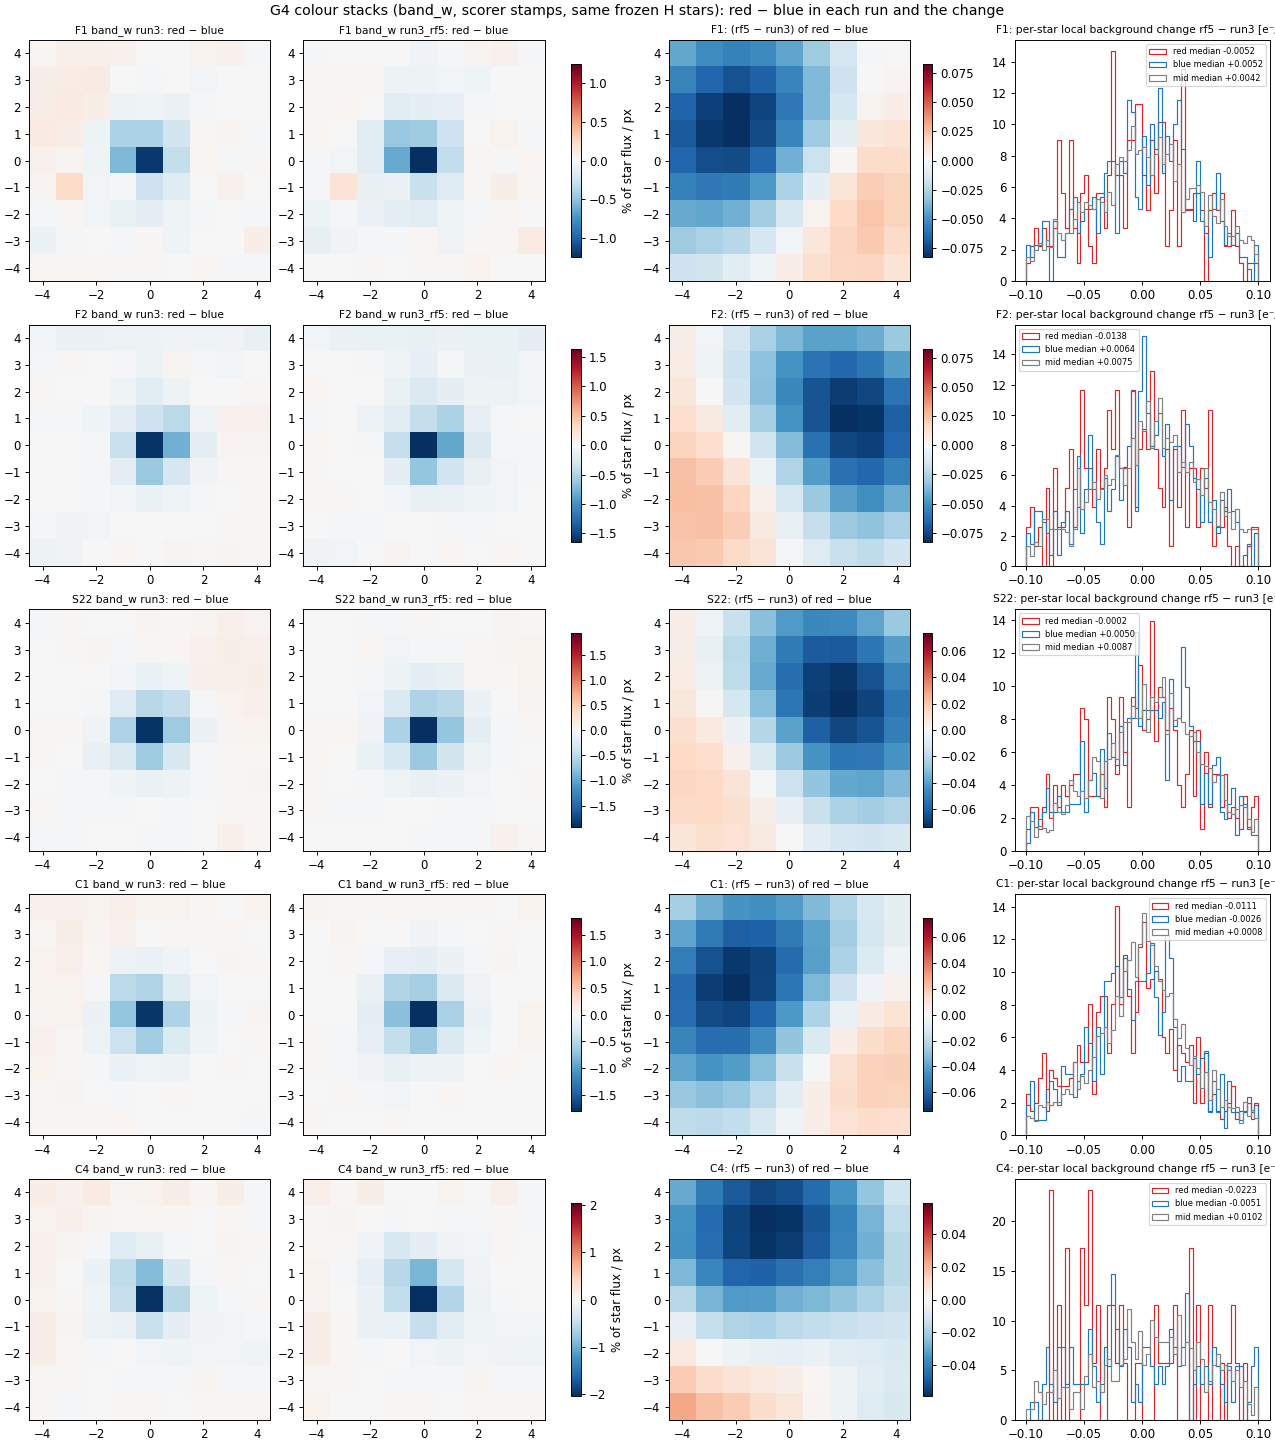
The scorer's own stamps show why: the change in the red − blue stack is a smooth tilt across the whole 9×9 stamp (±0.05–0.08% of flux per px) along the away-from-axis direction, with unchanged cores, and the local background around red stars drops (median −0.005…−0.022 e⁻/s) while blue and mid-colour stars rise. This is the red stars' own lateral-colour residual, now unmasked: the old background carried a negative lobe about 3 px toward the optical axis at red stars, which the new one does not, and the raw FFI minus the convolved template shows the same dipole at red stars while empty decoy positions show nothing (background session's test, checked here). The lobe directions follow each CCD's optical axis on all five fields. The old background was hiding part of the red-star residual, so the paper should quote these numbers.
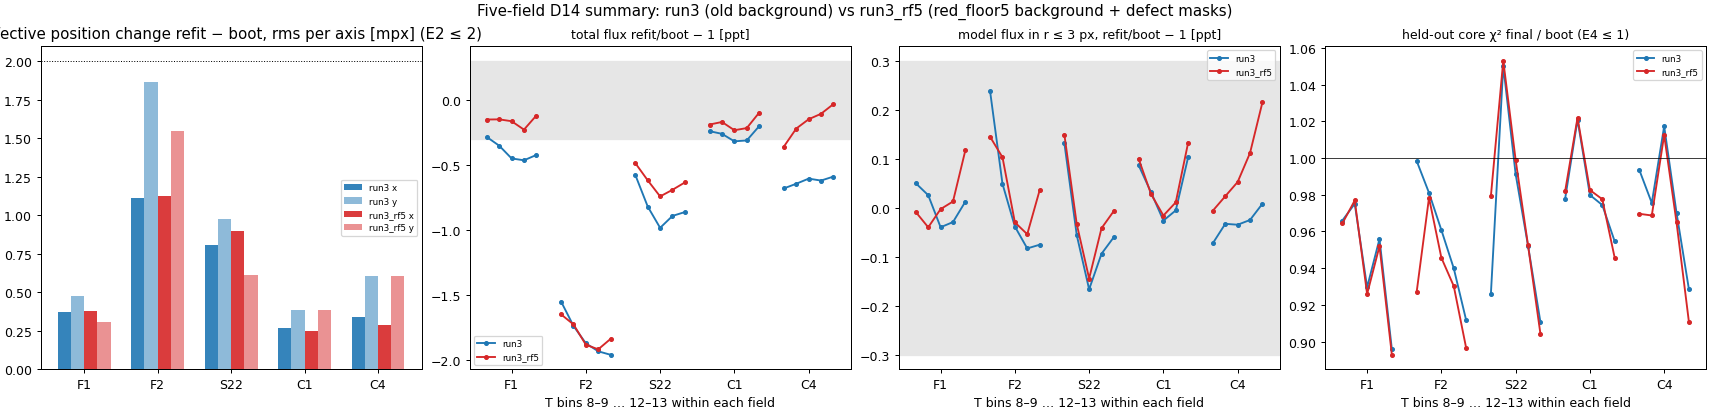
Refit on these images (D14), all five fields: the same picture as on the old background, slightly better where it moved. Effective star positions move ≤ 1.55 mpx per axis; total-flux offsets shrink on F1, S22, C1 and C4 (C4 −0.68 → −0.36…−0.03 ppt) and stay at −1.7…−1.9 ppt on F2 (its ePSF wing); flux in a fixed r ≤ 3 or 5 px aperture agrees within ±0.21 ppt everywhere; held-out χ² is lower on the final image in 22 of 25 bins, the same three exceptions as before. These are pre-fix numbers: per-band template stars were found 104–236 mas north of the Gaia positions, and the fix will be followed by a rerun.
Record: /astro/armin/koji/syndiff/dev_runs/e2e_final_recipe_20261007/README.md ("run3_rf5 G4").
Wing study: which ePSF wing is right?
The refit on the final image has more light in its core and less at 3–8 px than the bootstrap fit, most of all on F2, so its fluxes are 1.5–2 ppt lower there. Three tests:
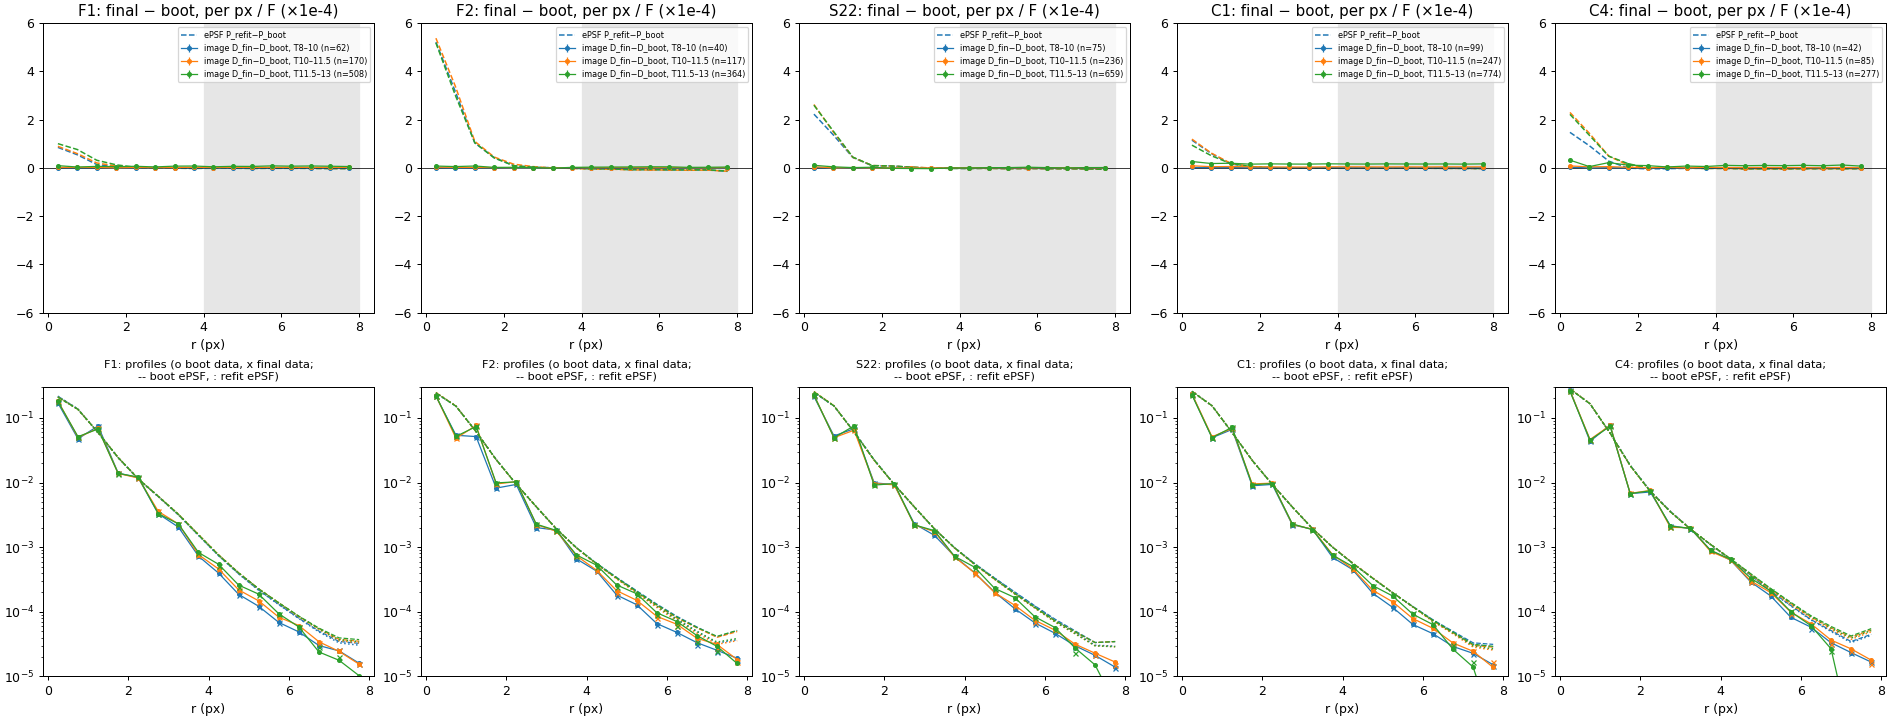
- The image near bright stars did not change. Stacking (Dfinal − Dboot)/F around T8–10 stars gives ≤ 0.003×10⁻⁴ per pixel at 4–8 px; the fitted wing moved 20–40× that. Faint stars show only a flat background-level difference.
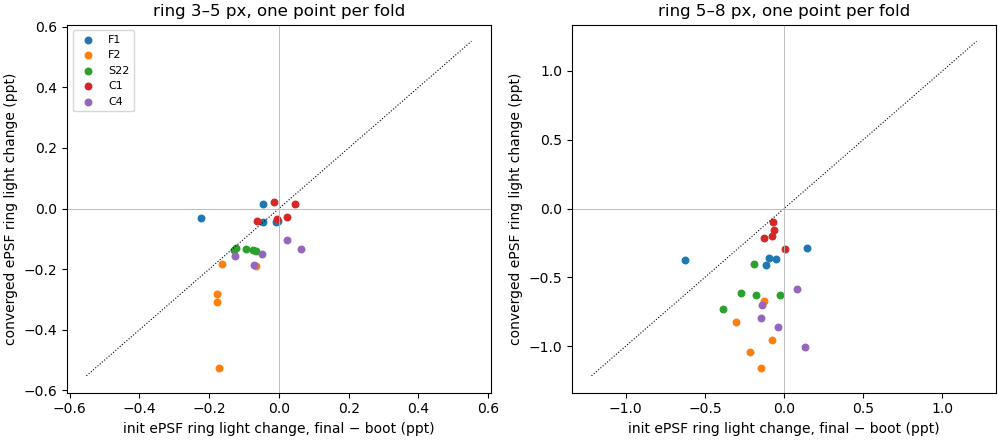
- It is not the starting point. The strict photutils inits of the two images differ little and with random sign; after training the final-image ePSF has less 5–8 px light on all 25 field × fold fits.
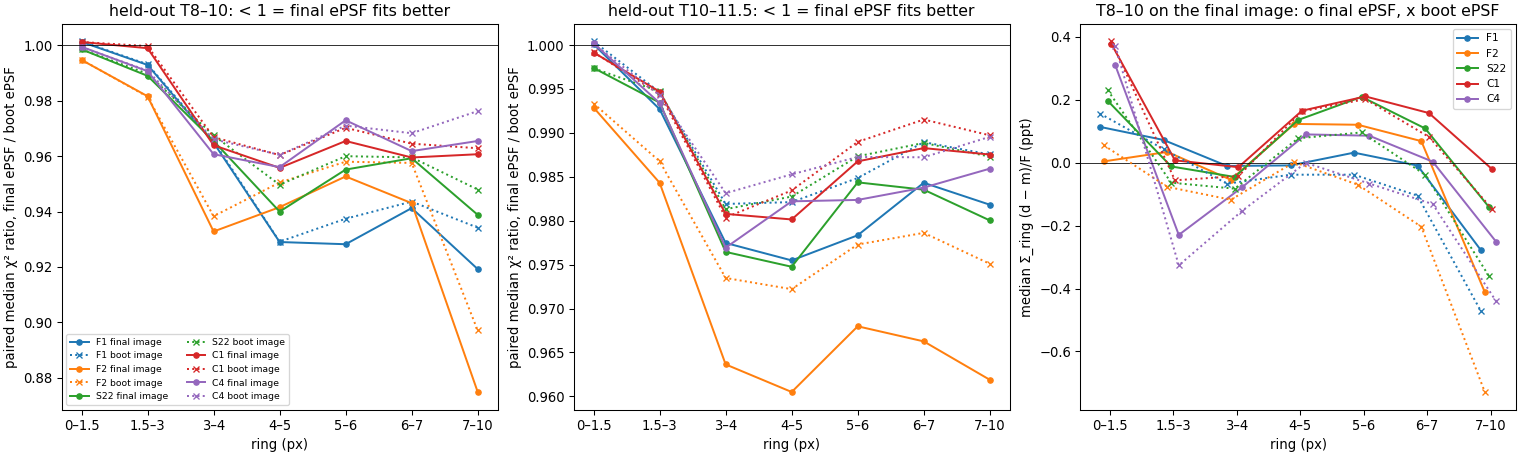
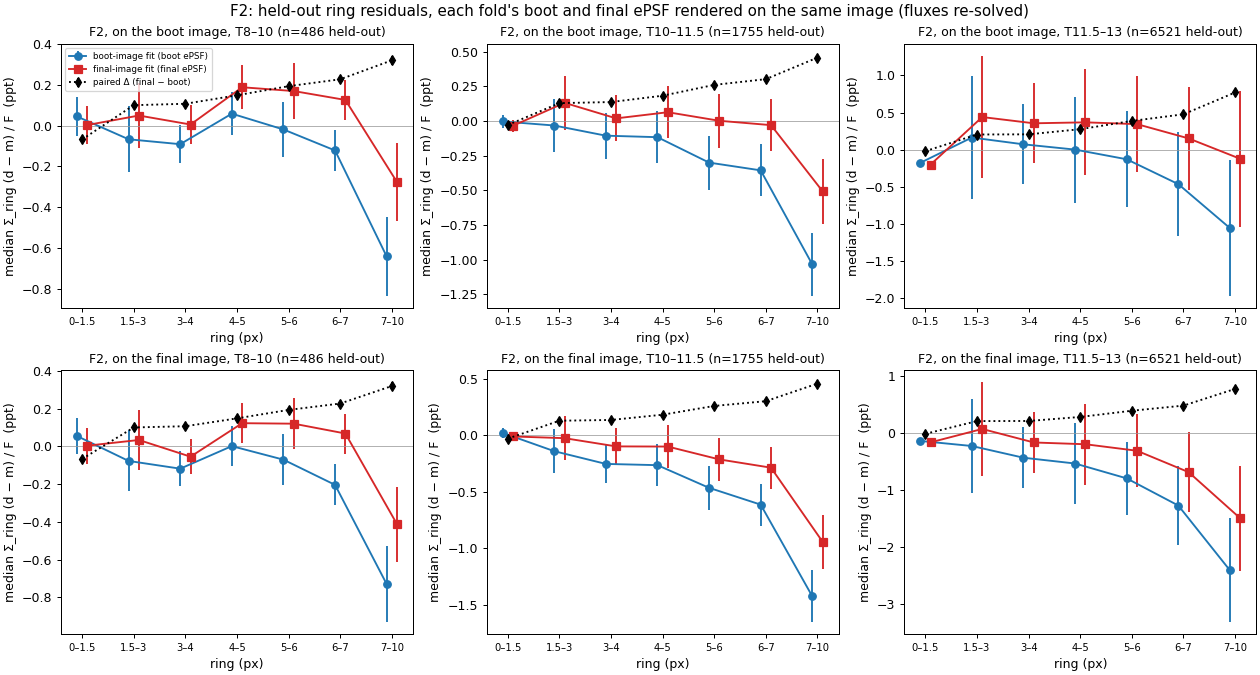
- Held-out test. Each fold's bootstrap ePSF and final ePSF were rendered on the same image, fluxes re-solved, and scored on that fold's held-out stars in rings: si(R) = Σp∈R(dp − mp)/Fi and the ring χ². The final ePSF lowers the 3–10 px ring χ² by 3–8% for T8–10 (F2 up to 12%) and 1–4% for T10–11.5, on both images and all fields. Cores are unchanged.
Conclusion. The final-image wing is the better one; the bootstrap ePSF over-predicts light at 6–10 px, and the paper takes fluxes and the ePSF from the final-image refit. Still open: the final ePSF leaves +0.1–0.2 ppt per ring at 4–7 px (slightly too little wing, inside the ±0.3 ppt E3 band), both leave a negative 7–10 px ring, and why the bootstrap image pushes the wing up (the faint-star background level is the suspect). These are to be rechecked on the new background once it passes validation.
Record: /astro/armin/koji/syndiff/dev_runs/f2_wing_20261009/README.md.
Findings so far
- Best run on both fields: recorded faint neighbours modelled + per-star weight cap at T 10.5 + T 11–13 stars training the shape. Held-out core χ² falls to about 0.55× the baseline (F1 0.54/0.55/0.50/0.56/0.65, F2 0.52/0.50/0.48/0.56/0.64 from T 8–9 to 12–13), every CCD cell improves, and the bright-star memorisation gap disappears (T 8–9: F1 5.9 → 0.9, F2 22.8 → 1.0).
- The optical-axis bullseye. The strong bullseye came only from the data floor (axis-cell width −33 at λ 3e8, −11 at λ 3e7, in 10⁻³ px²). Runs without the floor sit at −1.4 to −2.1. The best run brings the axis cell to −0.7 (F1) and −0.6 (F2), close to the far corner (−0.5, −0.4). The measurement's noise level is roughly ±0.2.
- Not adopted: the data floor (worse at every λ), coarser ePSF tiles (3×3 and 4×4 much worse), the moment-blind neighbour-tile prior (no change).
- Open before adoption: F2's far-corner tile in the best run has a wing about 10× the baseline beyond 3 px. The core score covers only r ≤ 3 px, so a held-out wing test is still needed. The neighbour list is unverified (the removal gate was overridden), and every test so far is fold 0 only.
All runs against the fresh baseline
Left block: median paired ratio of held-out core χ² to the baseline, same stars (below 1 = better prediction). Right block: memorisation gap, held-out ÷ in-fold median core χ² (1 = no gap). Last column: width residual in the CCD cell at the optical axis, blue and mid-colour T 10–13 stars, all stars, 10⁻³ px² (negative = data sharper than the model, i.e. the bullseye). Columns are catalogue Tmag bins.
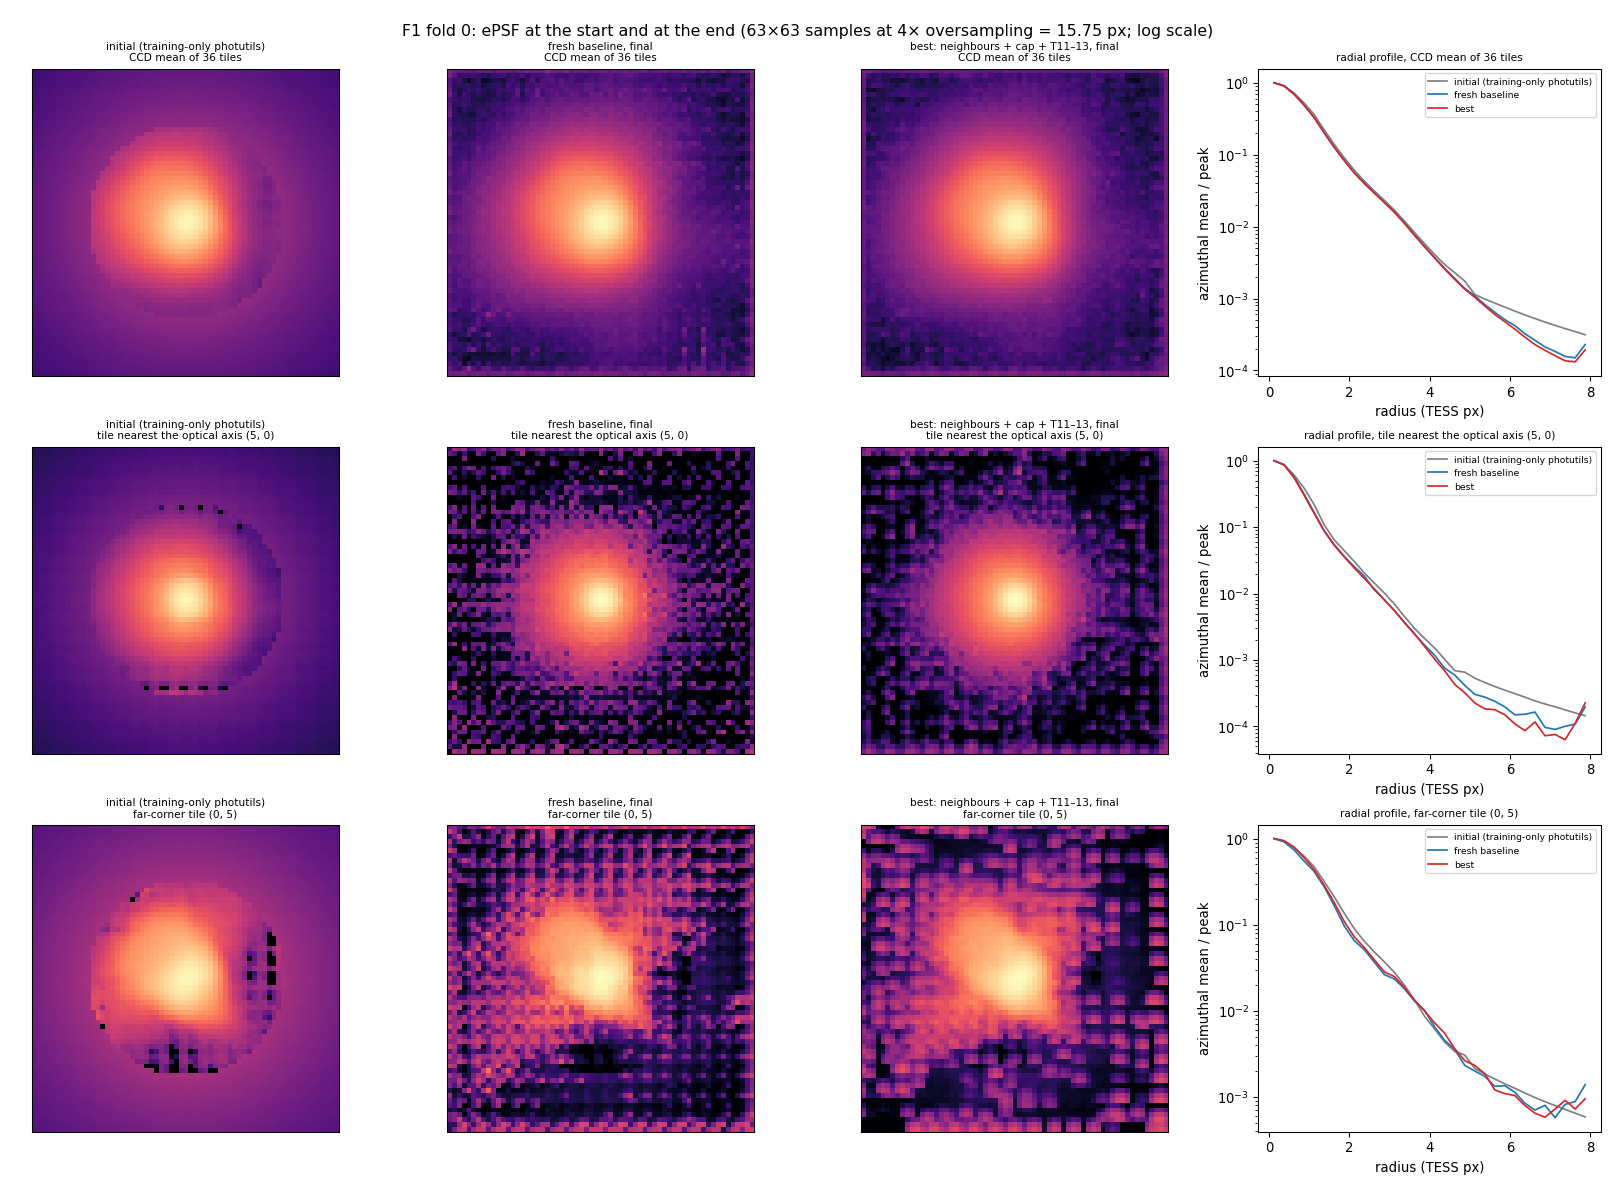
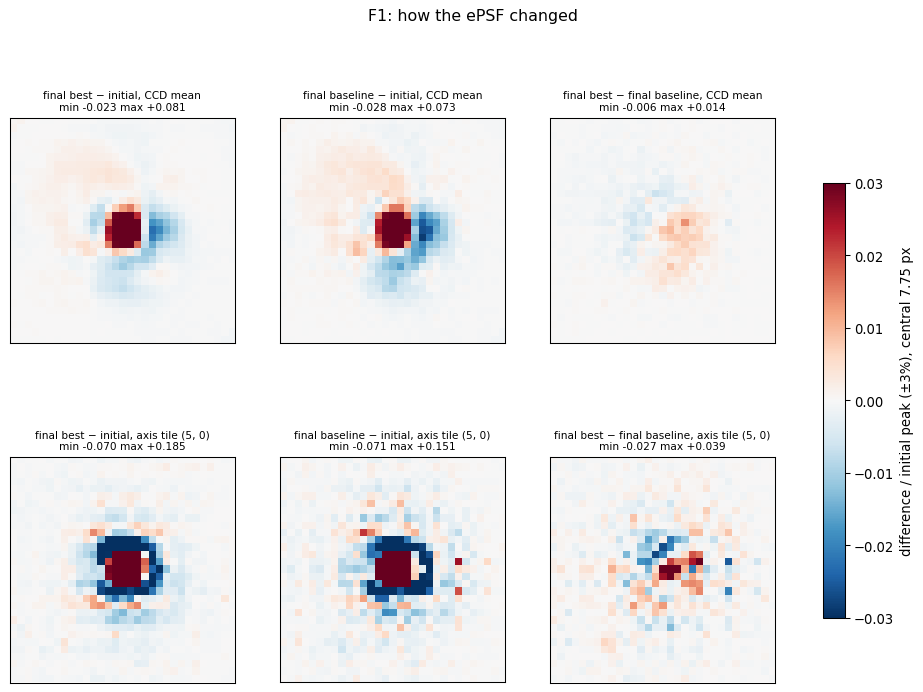
ePSF at the start and at the end
Best run vs the fresh baseline, starting from the training-only photutils ePSF. Rows: CCD mean of the 36 tiles, the tile nearest the optical axis, the far-corner tile. Log scale; 63×63 samples at 4× oversampling.
How to read a grid
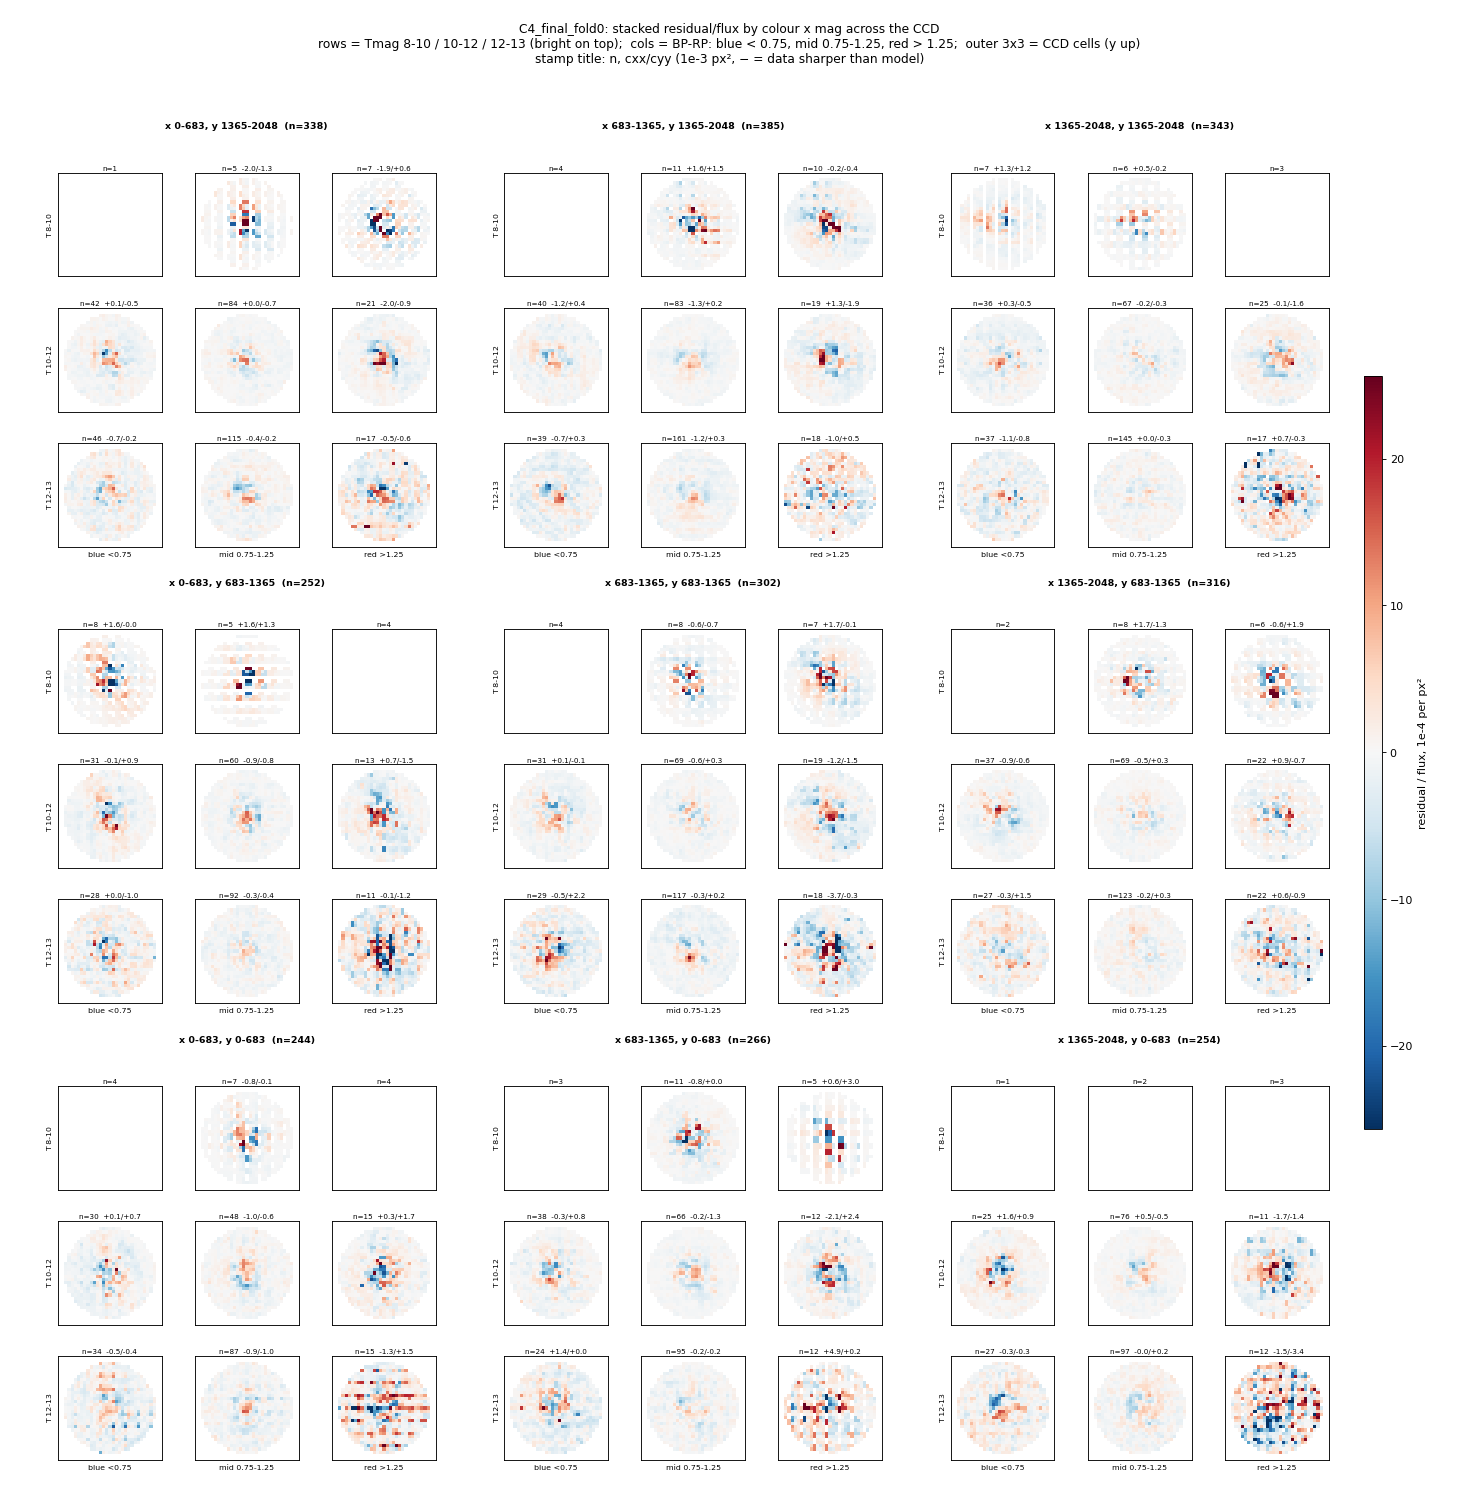
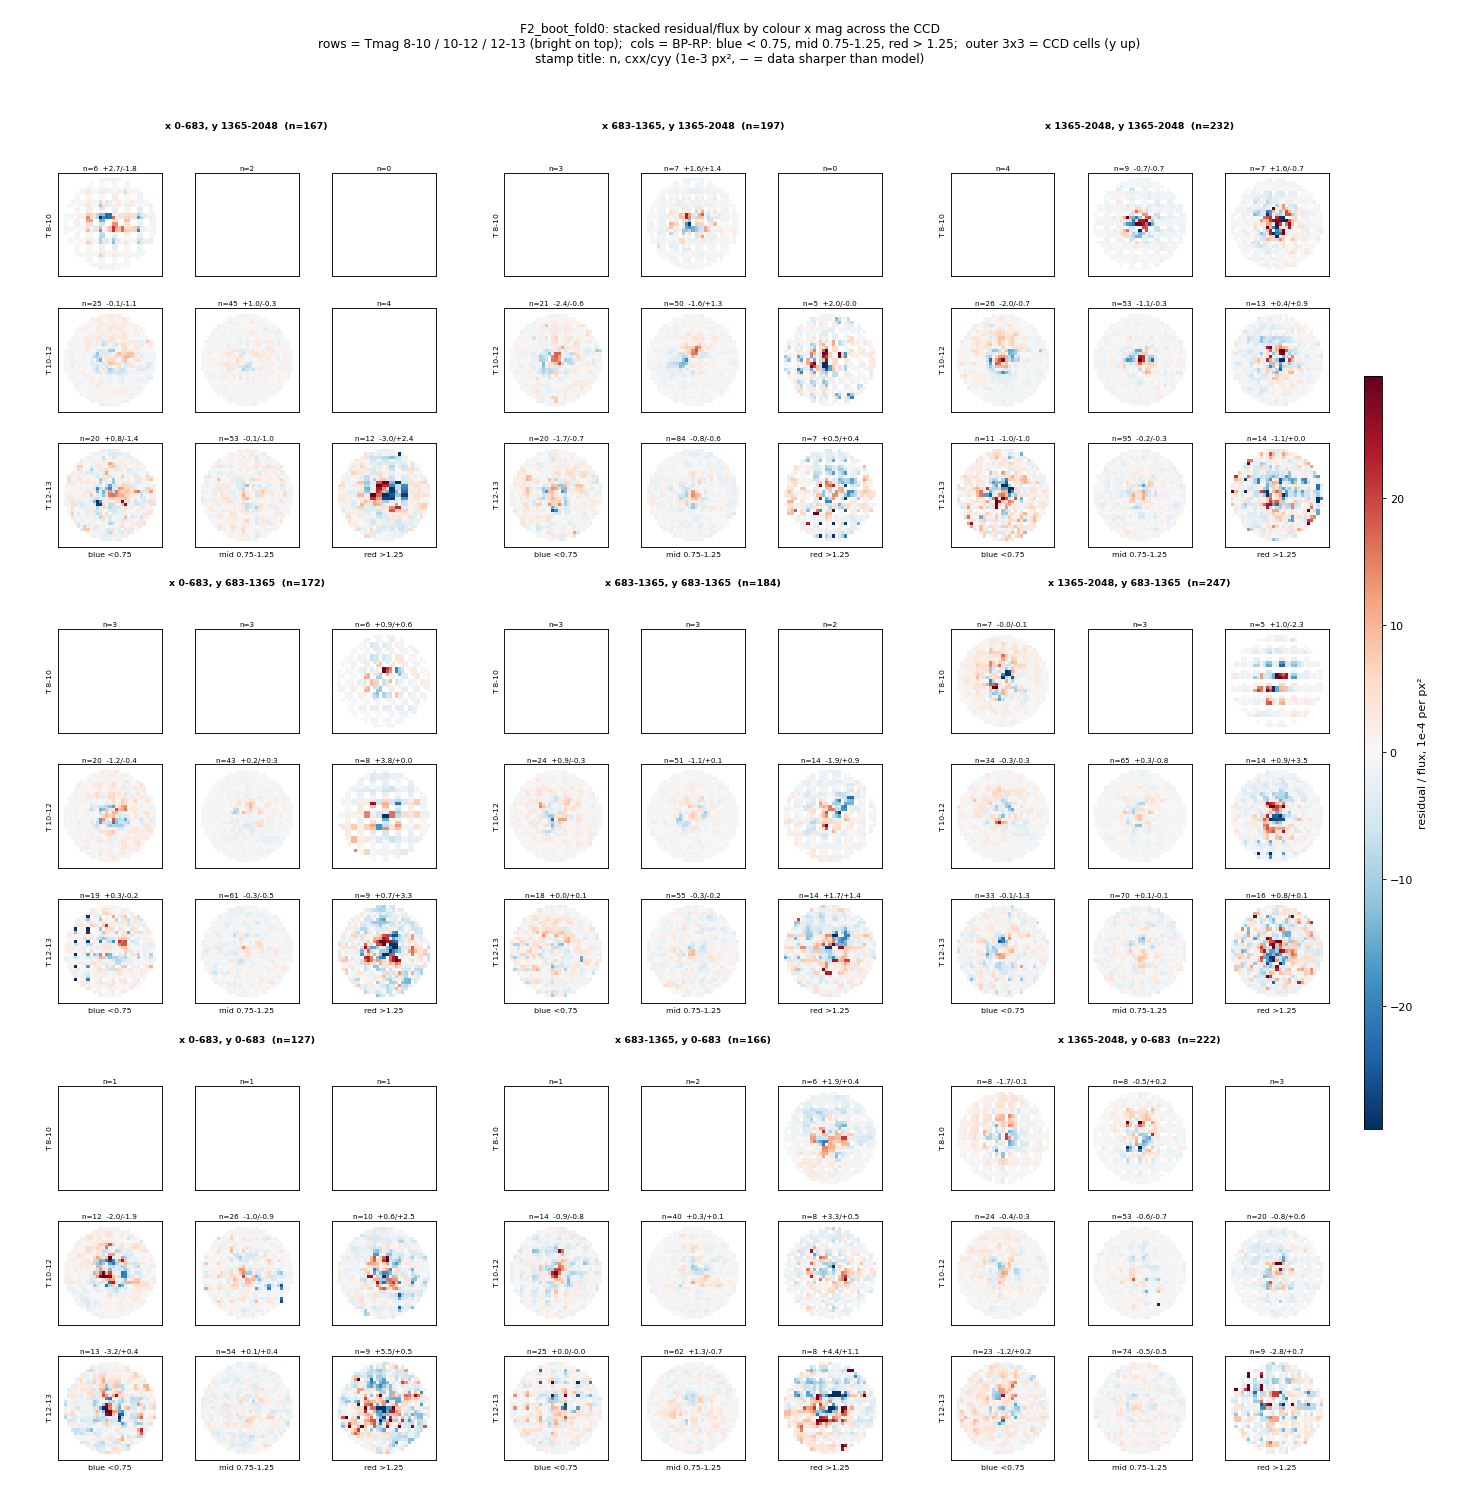
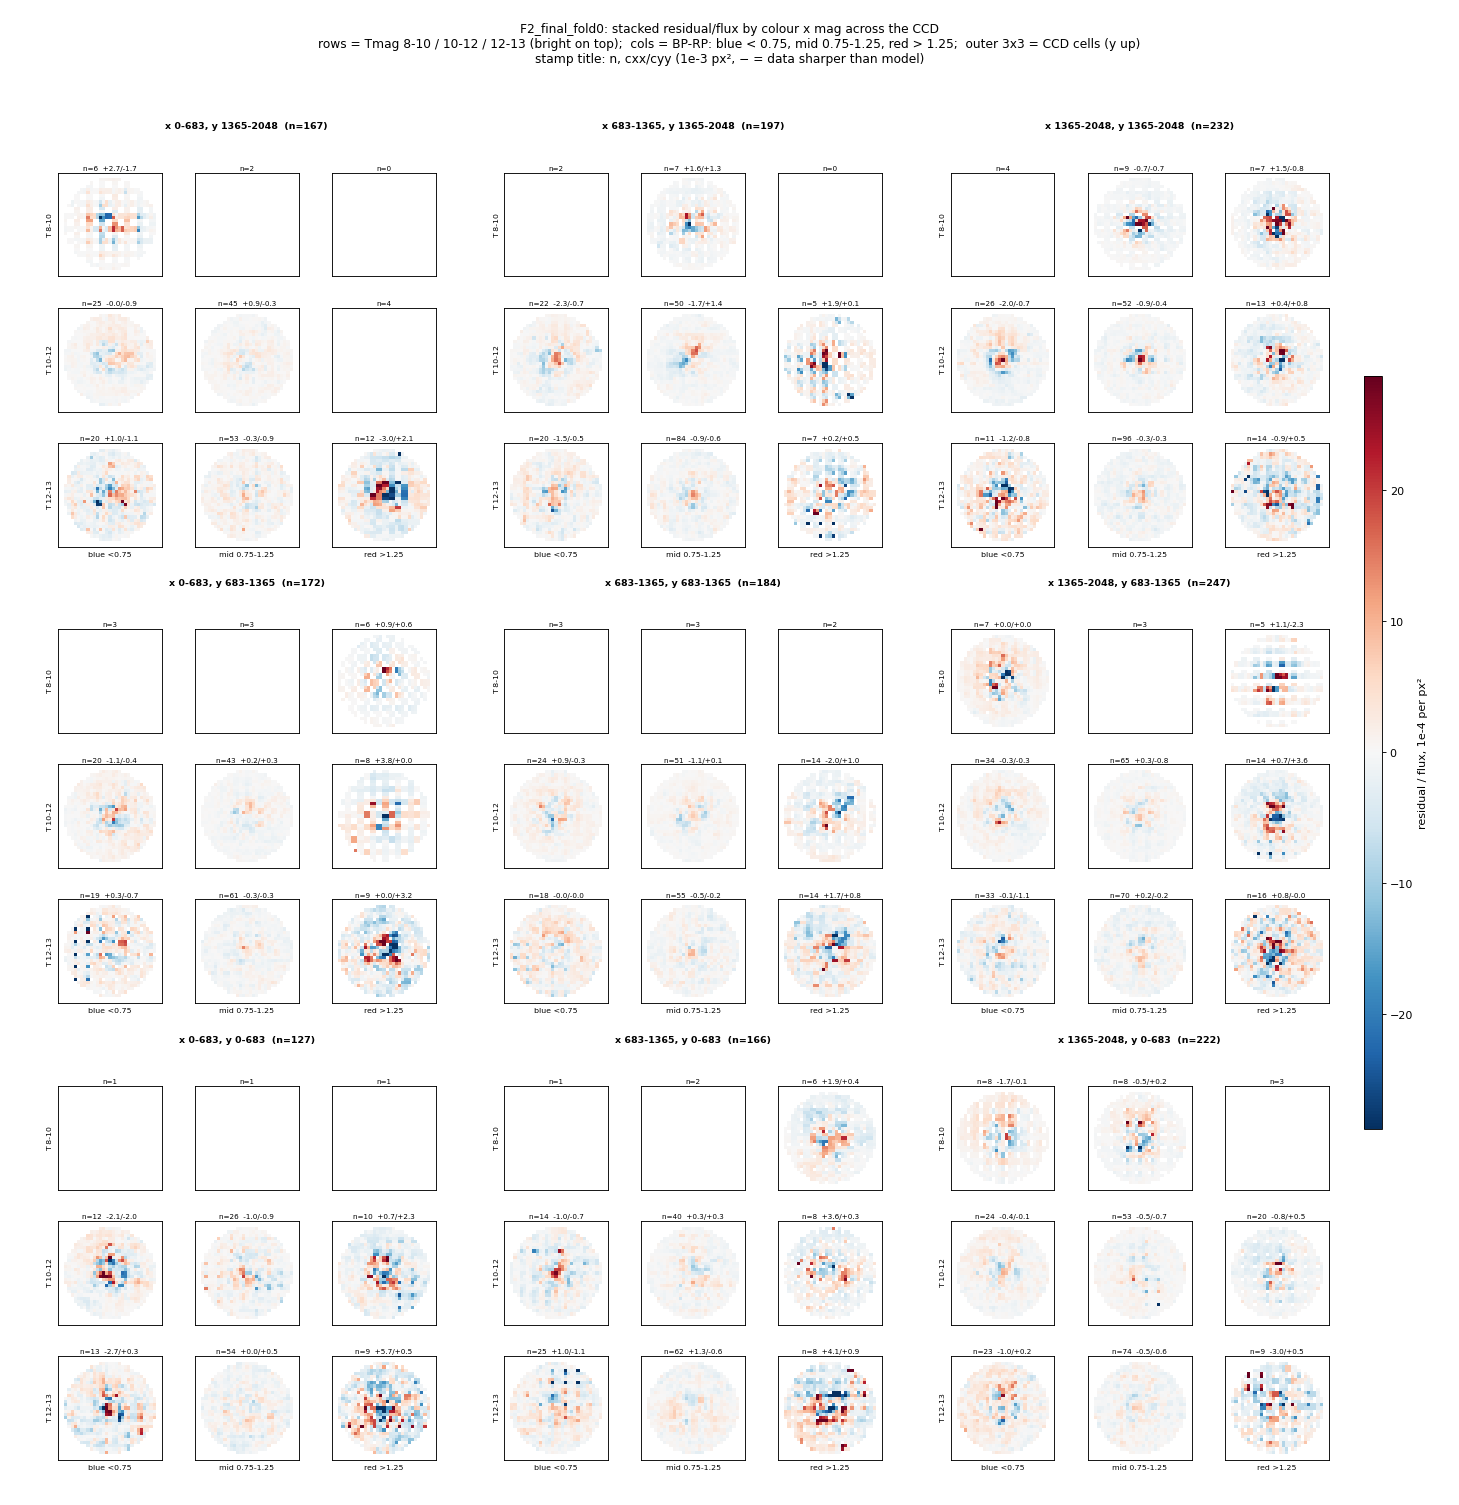
- The outer 3×3 blocks are CCD cells (y up). Inside each block, rows are Tmag 8–10 / 10–12 / 12–13 (bright on top) and columns are BP−RP < 0.75 / 0.75–1.25 / > 1.25.
- Each stamp is the clipped mean of (data − model) / flux, in units of 10⁻⁴ per px², on the grid's own colour scale. Compare the numbers in the stamp titles across grids, not the colours.
- Stamp titles give n and cxx/cyy in 10⁻³ px². Negative means the data is sharper than the model. A positive core inside a negative ring is a model that is too broad.
- Held-out: stars whose pixels the fit never saw (the honest test). In-fold training: stars the fit trained on. All combined: both.
Record: /astro/armin/koji/syndiff/dev_runs/training_fixes_20261005/README.md. Grids: eval/<run>/ under the same directory.