TESS bandpass vs Gaia XP
How the measured TESS flux of stars on five CCDs in four cameras compares with Gaia XP spectra integrated through the POC v2.0 response. The page asks whether red stars are really fainter in TESS than v2.0 predicts, or whether their light is only spread outside the aperture.
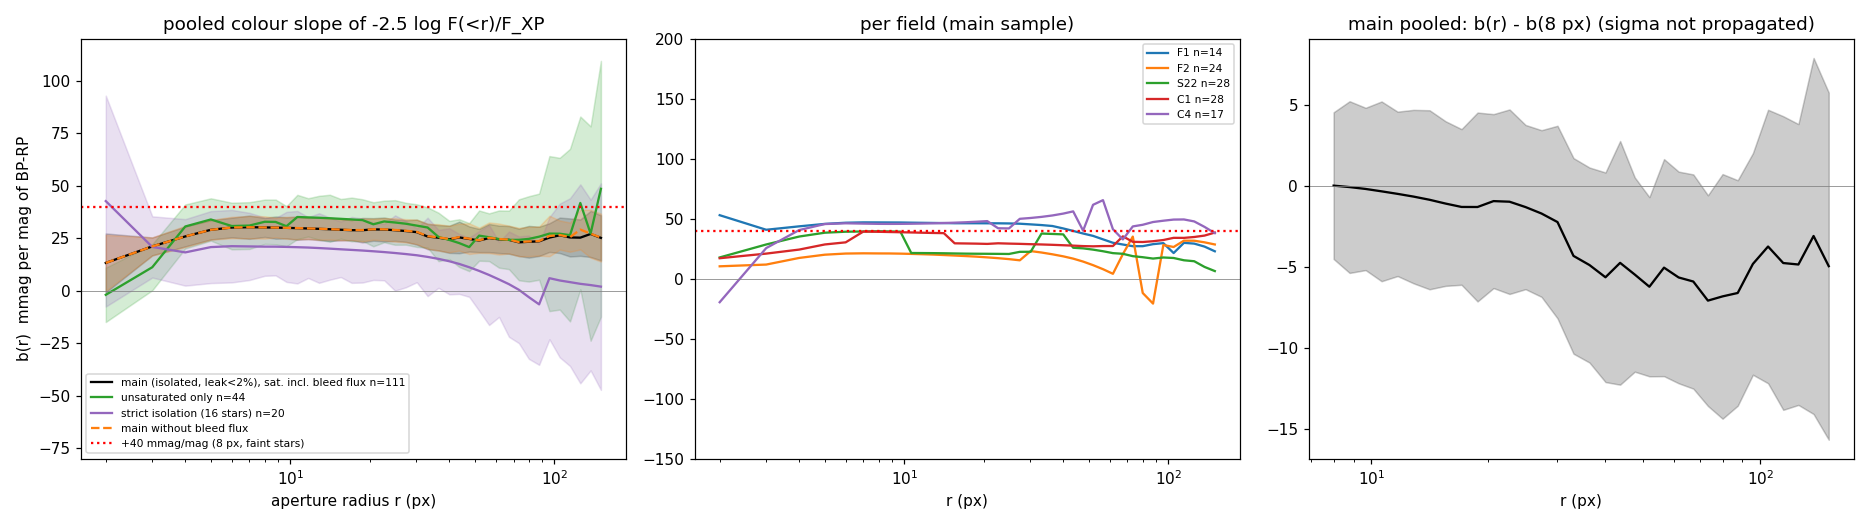
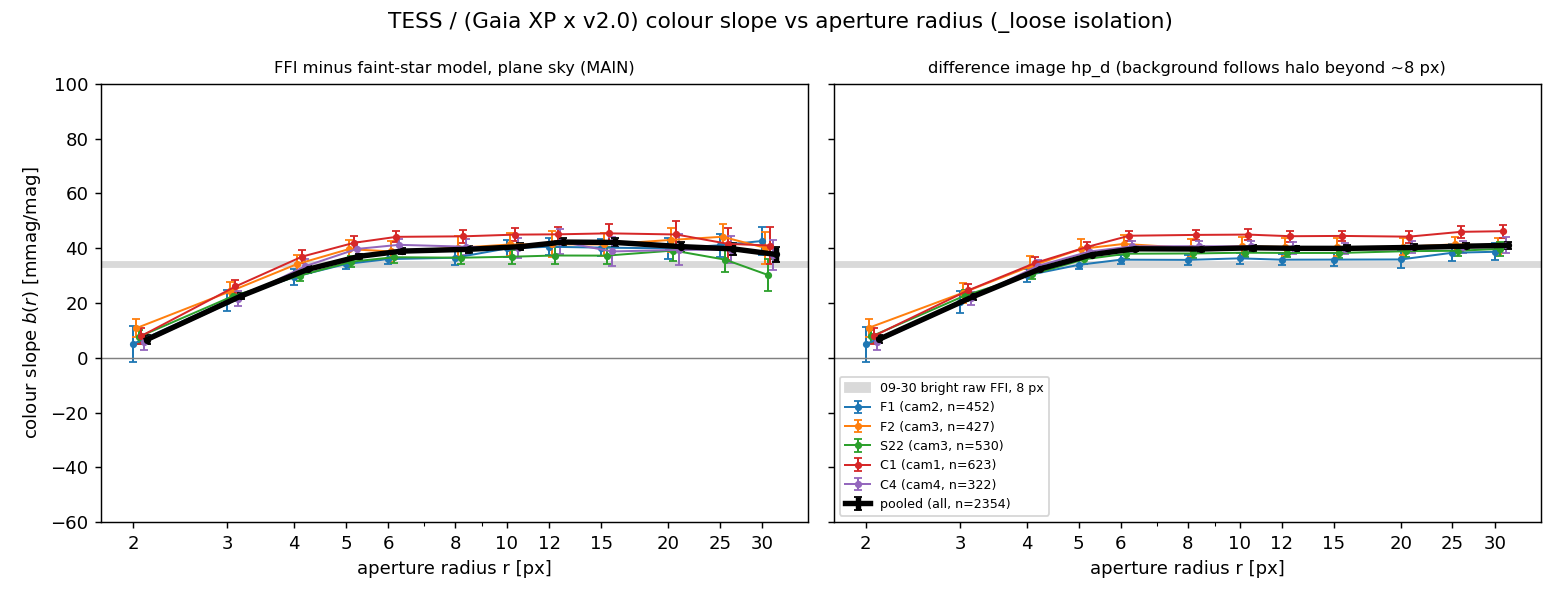
Red stars give less total TESS flux than Gaia XP × v2.0 predicts, by +40 ± 1 mmag per mag of BP−RP. This is pooled over F1, F2, S22, C1 and C4, which cover all four cameras. The deficit is fully in place by 6 px, and the colour slope stays flat from 6 to 30 px on every field (section A).
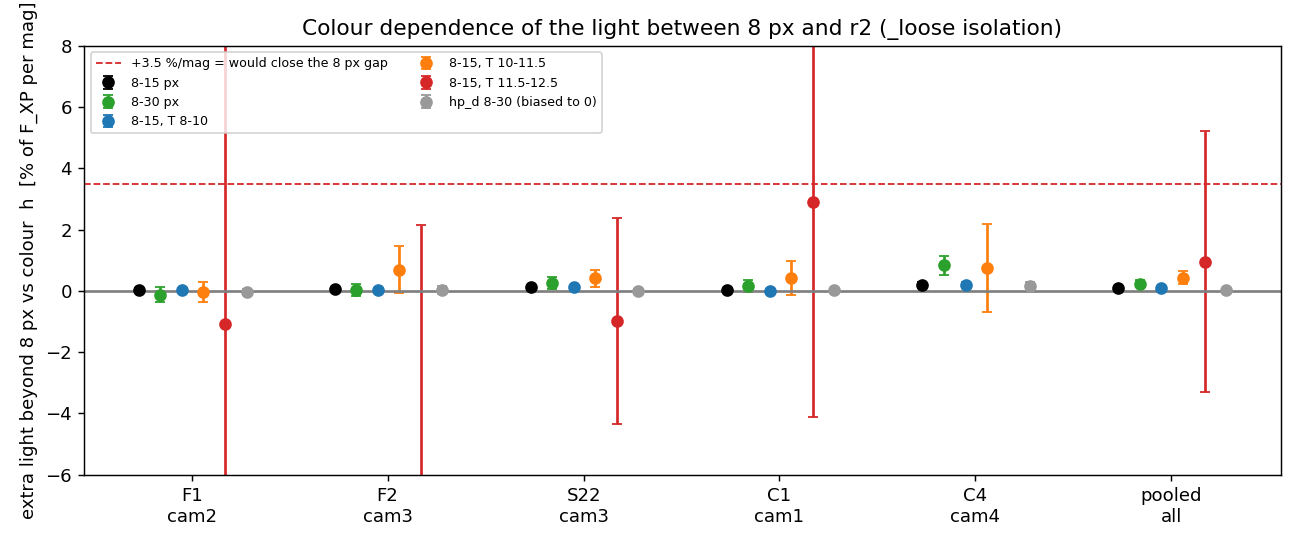
It is not red light spread beyond the aperture. The colour dependence of the light between 8 and 30 px is $h = +0.23 \pm 0.12$ %/mag. A red halo would need +3.5 %/mag to hide the deficit, so that explanation is excluded at more than 25σ. No camera reaches a quarter of that; the largest is C4, +0.84 ± 0.31.
So the light is missing from the detector, not misplaced. Template convolution cannot cause it, because the target star is never convolved in this measurement.
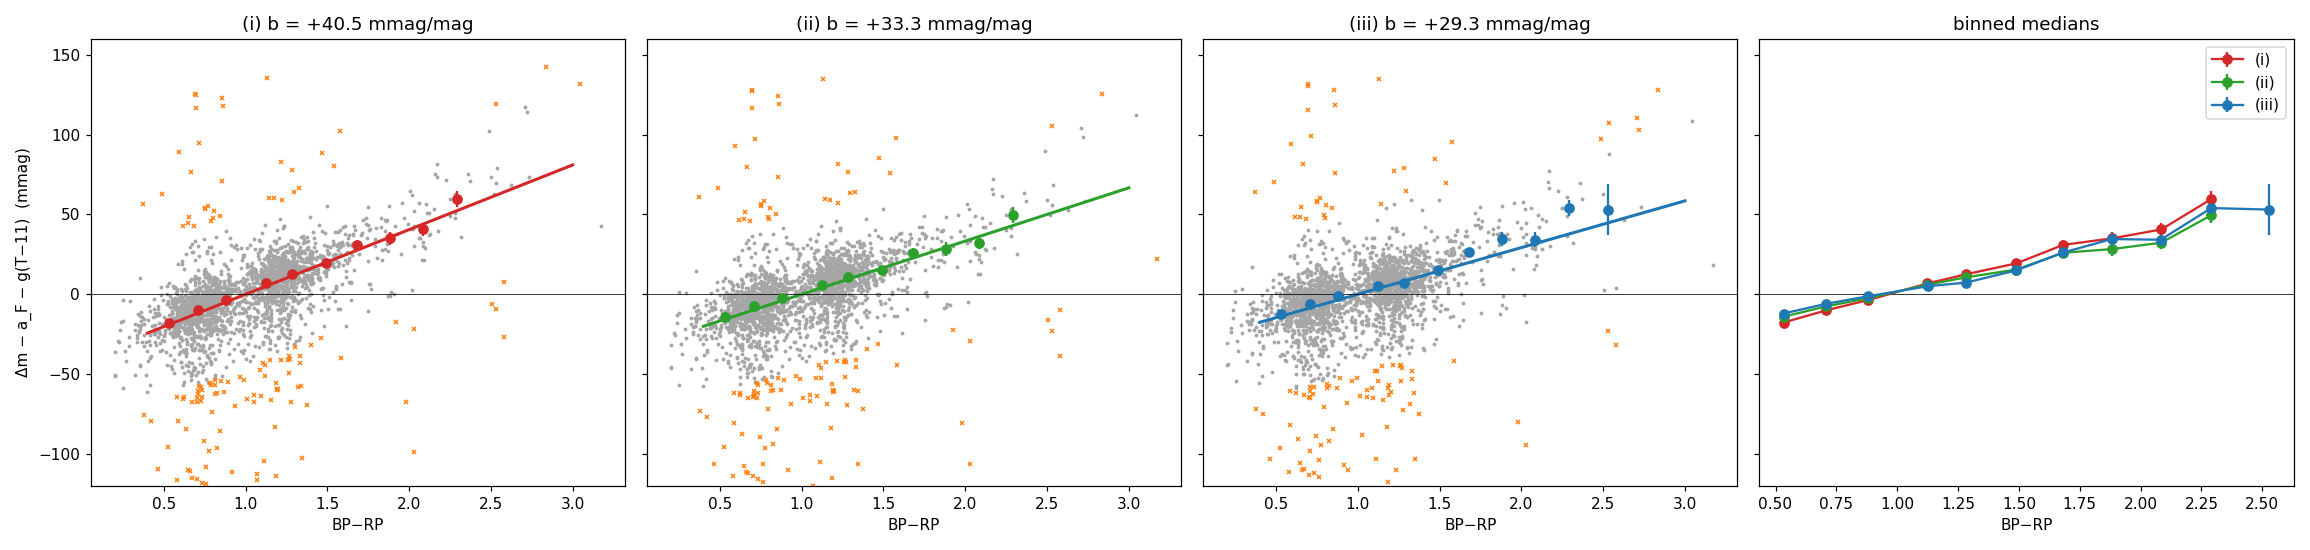
Cause (section C, five tests). Part of the +40 came from extending XP past 1020 nm with a power-law tail. With a 2MASS-anchored red end the deficit is +29 ± 2 mmag/mag. It persists in a prediction that uses no XP, it is not light out to 150 px or in streaks, and it is the same on all cameras. That points to a red response below v2.0. Its spectral shape is not measurable from these data, and a flat-field or strap effect is not yet tested.
The tilt values $k$ in the older sections below are only a compact way to quote the size of the colour term. They are not a physical measurement of the response.
C · What causes the deficit? Five tests (2026-10-12)
All five tests use the same model. It is fitted per field, with robust least squares and bootstrap errors:
- $F_{8,s}$: measured 8 px flux of star $s$ on the FFI minus the faint-star template (section A), e⁻/s.
- $F_{\mathrm{pred},s}$: predicted TESS flux. Each test builds it differently.
- $c_s$: BP−RP.
- $T_s$: TESS magnitude.
- $a_F$: an intercept for each field.
- $g$: a magnitude term.
- $b$: colour slope in mmag/mag. Positive means red stars are fainter than predicted.
The cause is on the detector side, most likely a red response below v2.0. It is not the predicted spectra, and not light outside the aperture.
- Size. With the red end of the spectrum anchored to 2MASS J, red stars are $+29 \pm 2$ mmag/mag fainter than predicted. Even if every star had zero flux above 1000 nm, the deficit would still be +25.5.
- Not XP. It persists when the prediction uses no XP data at all (+26 ± 5 with BOSZ models, +39 ± 5 with PHOENIX models).
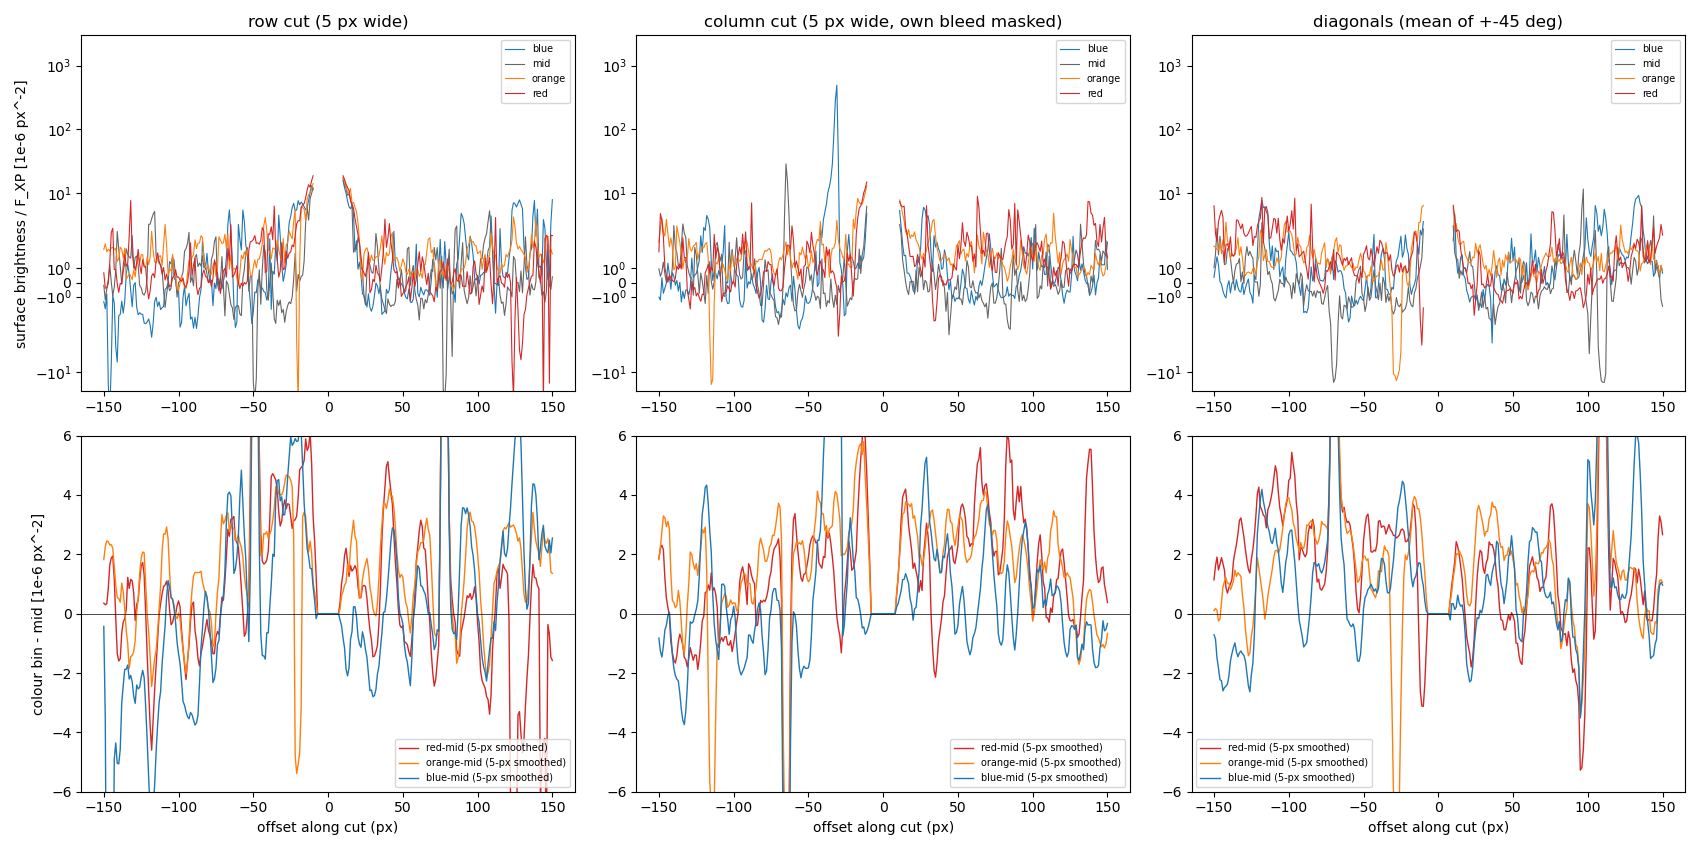
- Not large-radius light. Nothing comes back between 8 and 150 px or in streaks along rows and columns.
- Same everywhere. All four cameras agree, and the same CCD agrees across two sectors.
Not established. The shape of the missing response cannot be measured: with BP−RP as the only lever, a response change and a plain colour term fit equally well. A flat-field or strap effect is untested; the flat field was taken at 780 nm.
p2 · The XP red end, and XP y on every field
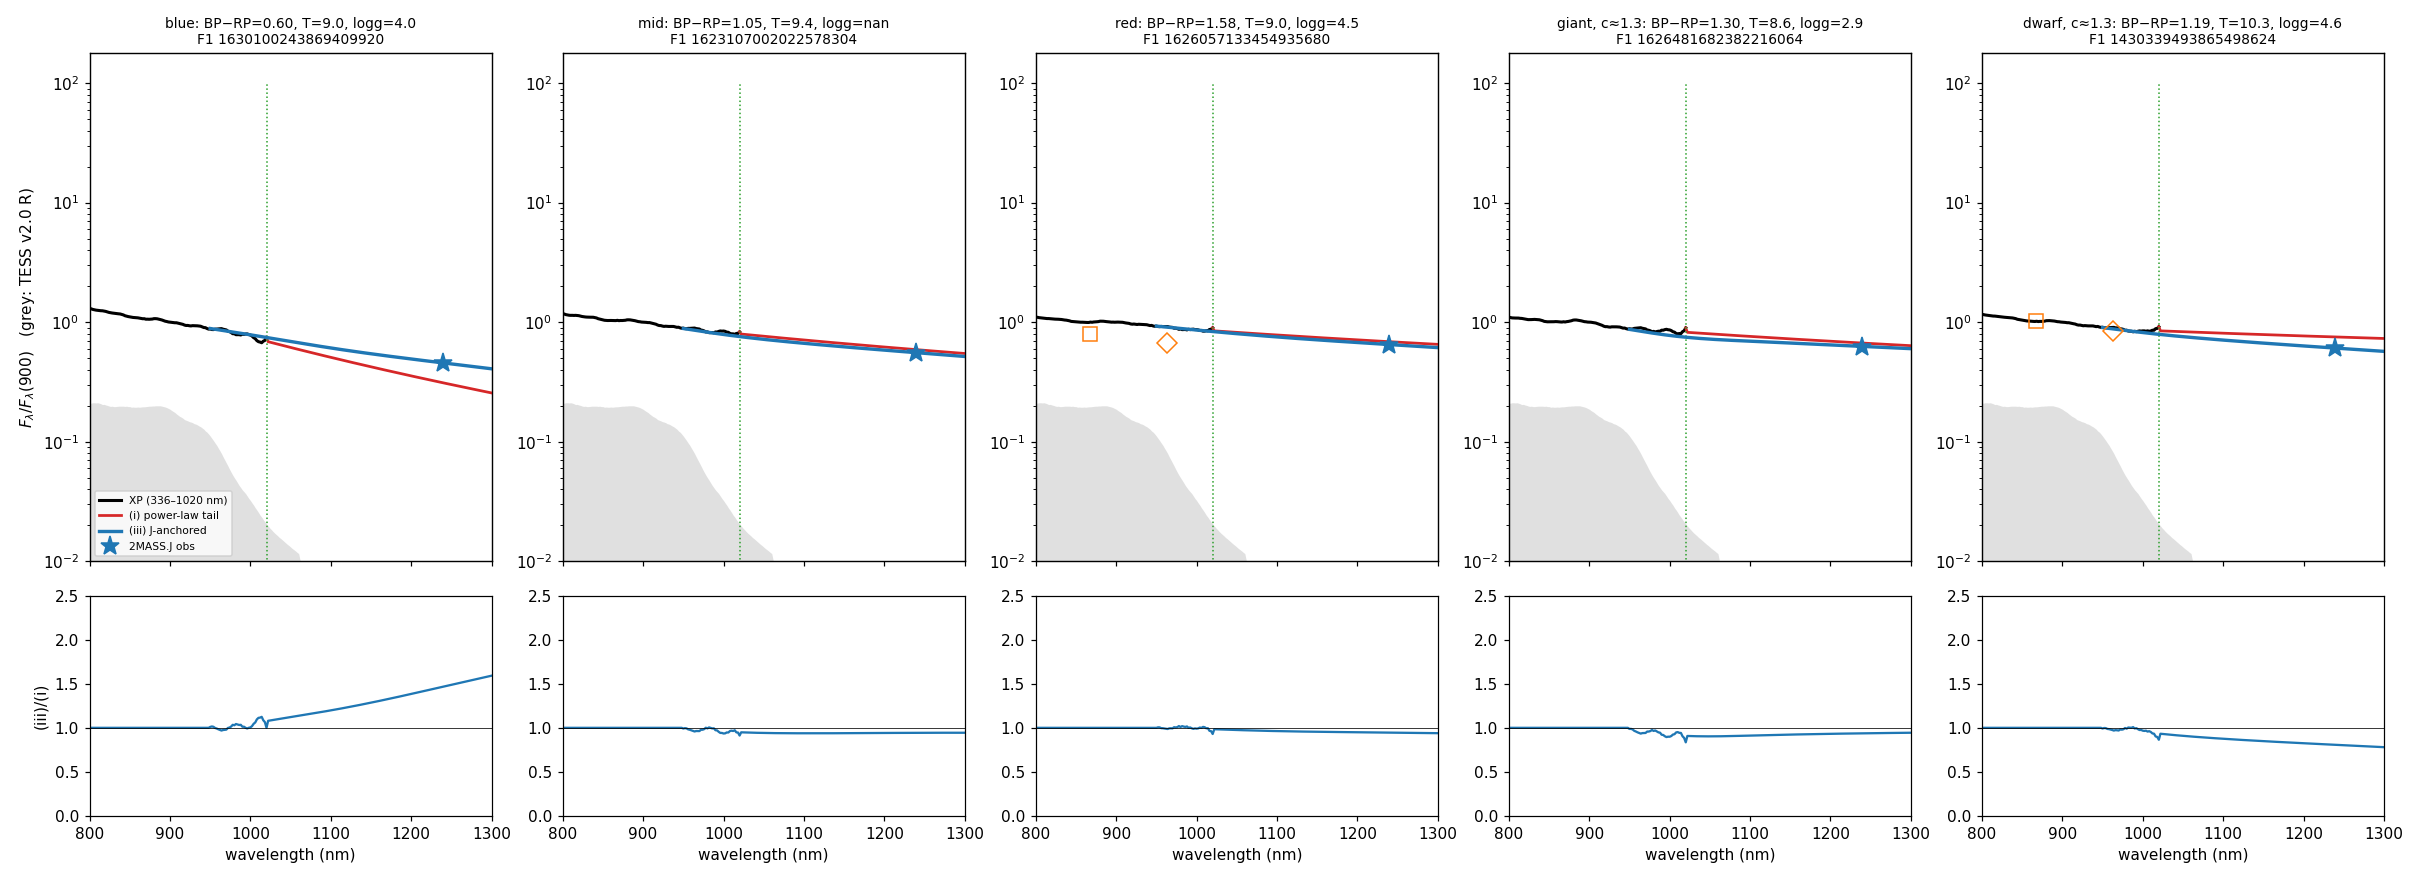
The earlier +40 used XP spectra extended past 1020 nm by a power law fitted to 960–1020 nm. XP often turns up over 1000–1020 nm, where Gaia's calibration papers flag systematics. The power law carries that upturn on, so it overshoots the measured 2MASS J by about 0.5 mag per mag of colour.
The fix was a per-star red end from 950 to 1250 nm: a cubic spline in $\ln F_\lambda$ matched to XP at 900–948 nm and to 2MASS J. That gives $b = 29.3 \pm 1.6$. Truncating at 1020 nm gives 33.3; zero flux above 1000 nm gives 25.5. All three use the same 2,336 stars.
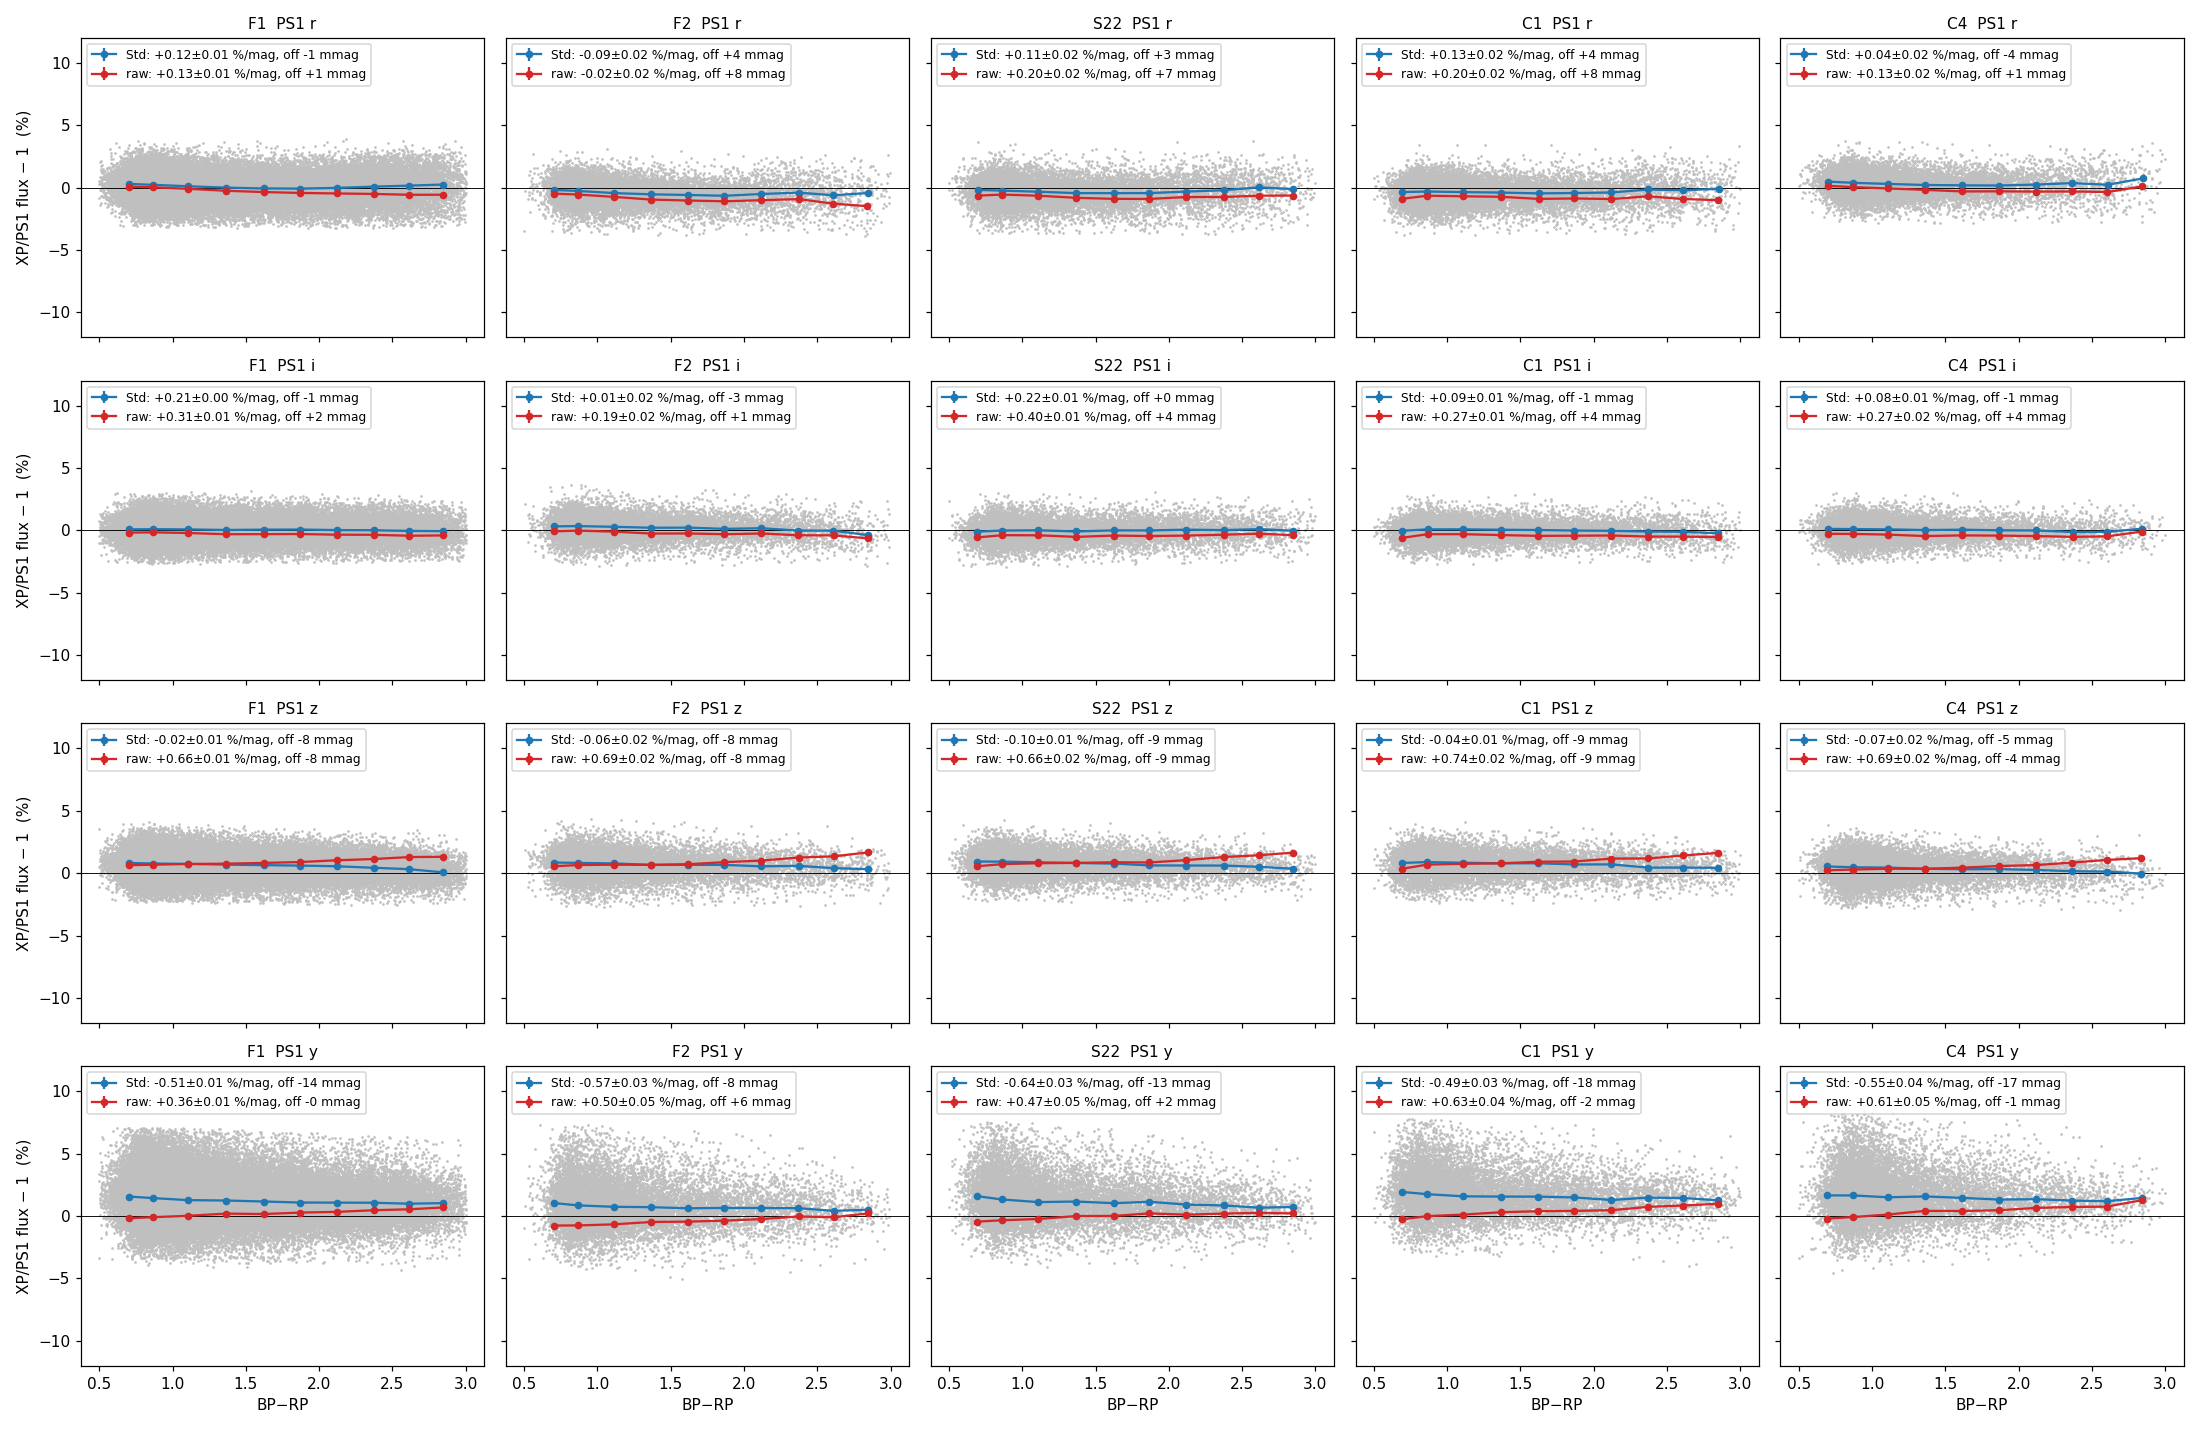
XP synthetic y matches real PS1 y on all five fields (stars with G > 14). The colour slope is −0.49 to −0.64 %/mag for Gaia's standardised photometry and +0.36 to +0.63 %/mag for raw XP.
p3 · A prediction with no XP
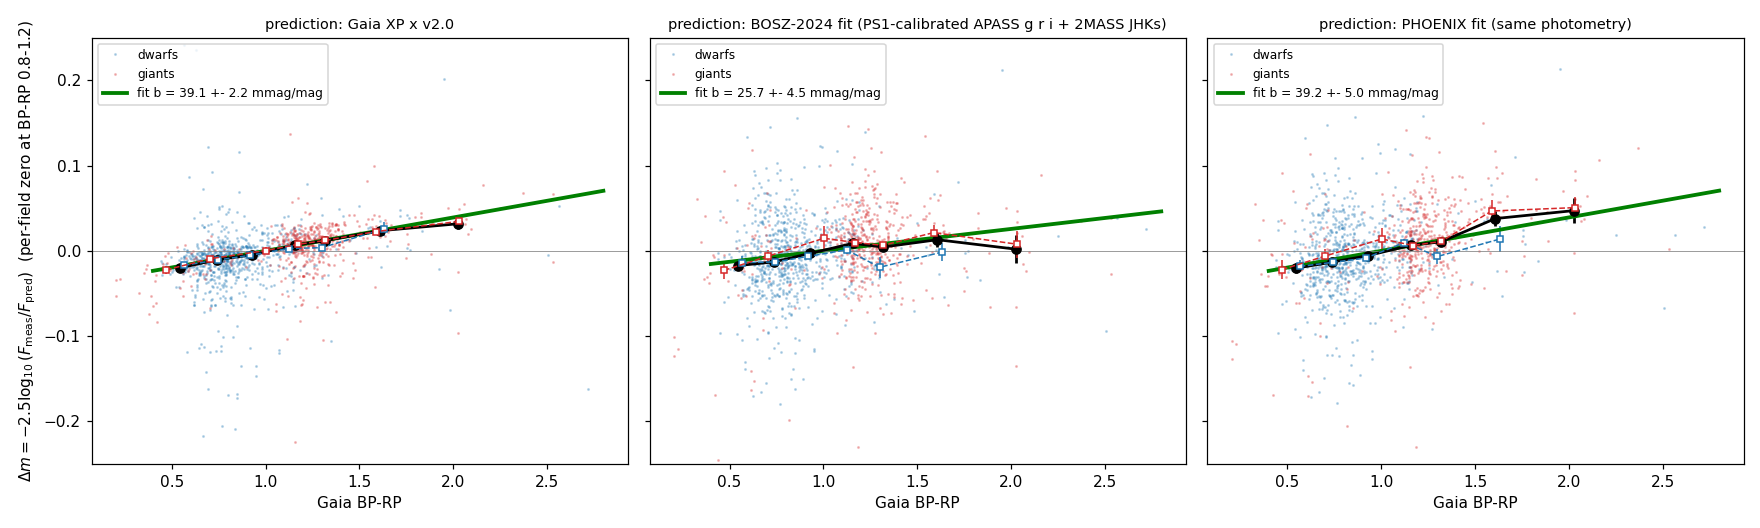
BOSZ-2024 (main) and PHOENIX (cross-check) model spectra were fitted to each star's APASS g′r′i′ photometry (brought onto the PS1 system using faint unsaturated stars) and 2MASS JHKs. The fit used no XP or BP/RP fluxes; BP−RP appears only on the x-axis. Most of these stars are too bright for PS1, which is why APASS is used.
On the same 1,309 stars: $b = 39.1 \pm 2.2$ with the XP prediction, $25.7 \pm 4.7$ with BOSZ and $39.2 \pm 4.5$ with PHOENIX. The two model libraries differ by about 13 mmag/mag; that is the systematic error of this test.
p1 · Light out to 150 px, and streaks along rows and columns
This test used 111 isolated stars with T 5–8, measured on the FFI minus the faint-star template, with neighbours and bleed columns masked. The sky is a plane fitted at 160–200 px.
An injected 1 % $r^{-2}$ halo at 40–150 px was recovered at 1.00. A plane fitted to the whole box with only 40 px masked would have absorbed 42 % of it. That variant is not used.
Below, $h$ is the colour slope of the light between two radii, in % of the predicted flux per mag. A halo holding the whole deficit would give $h \approx 3.7$ %/mag.
- 8–40 px: $h = 0.20 \pm 0.19$ %/mag, which is $5 \pm 5$ % of the deficit.
- 40–150 px: $0.49 \pm 1.22$, or $13 \pm 33$ %. Only 19 red stars pass isolation, so this limit is loose.
- Row and column strips relative to diagonal strips: $-0.3 \pm 2.4$ % of the deficit.
p4 · Fitting a correction to the response
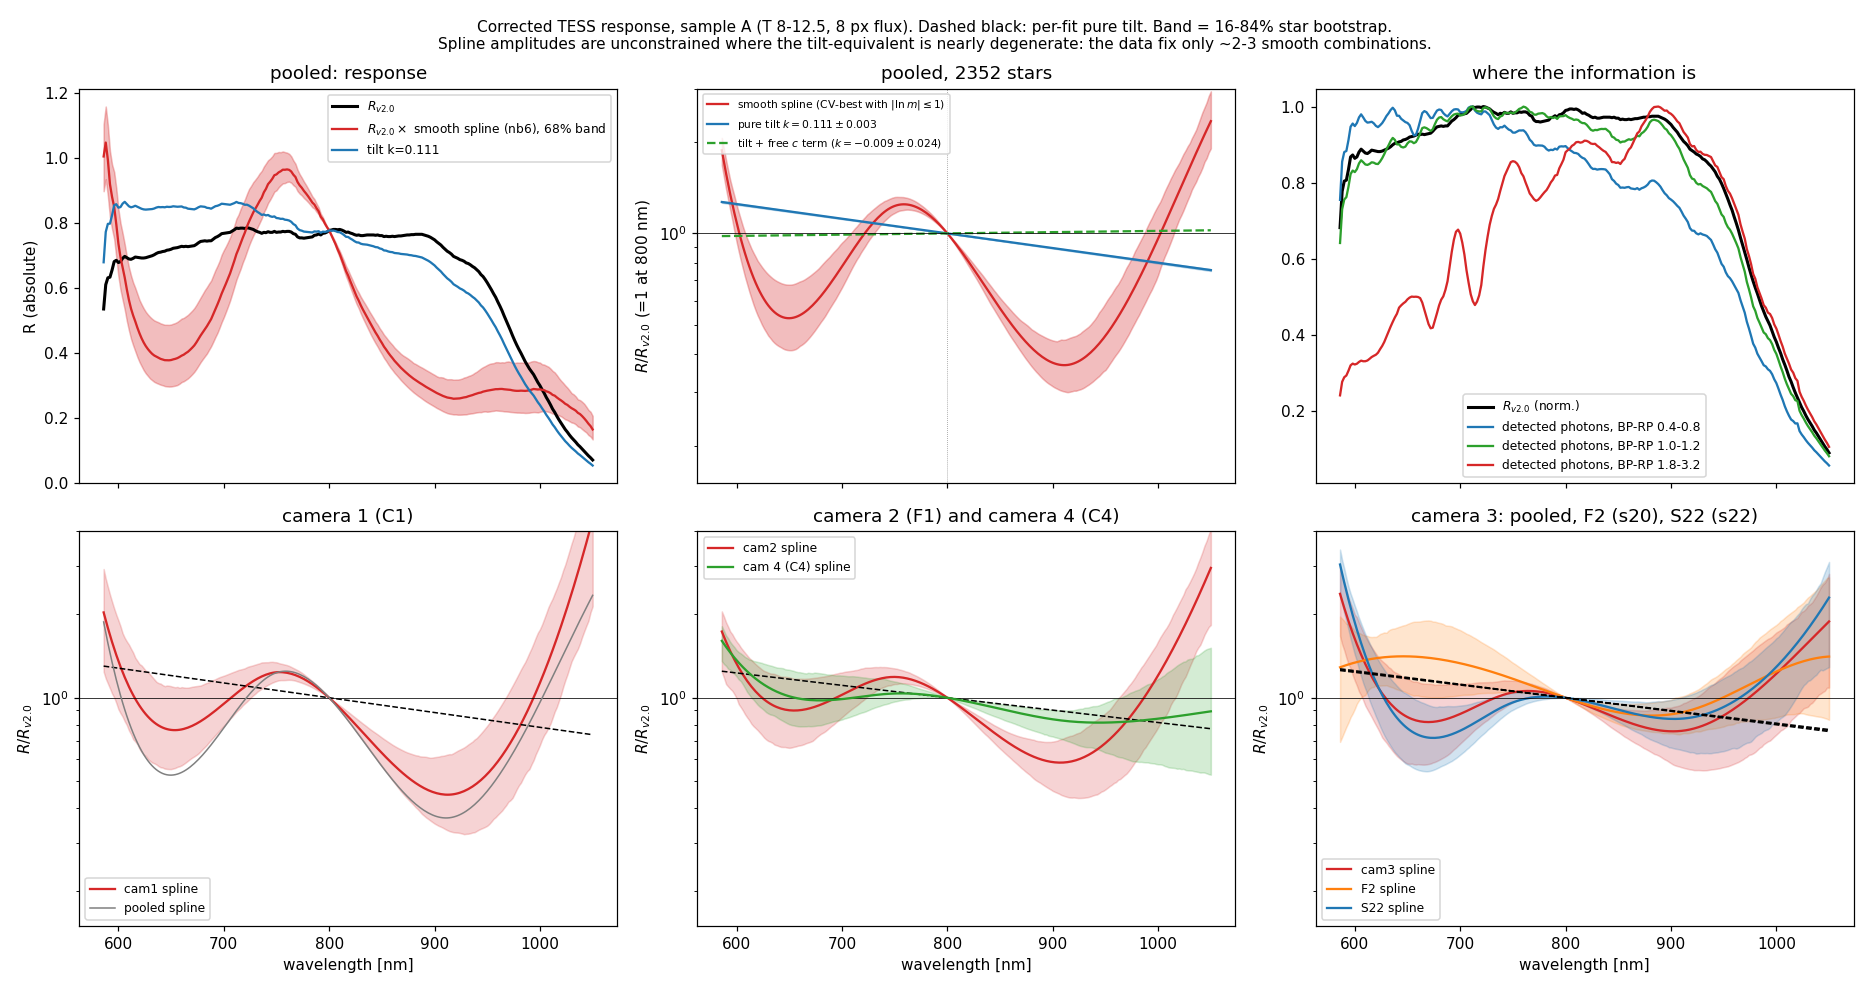
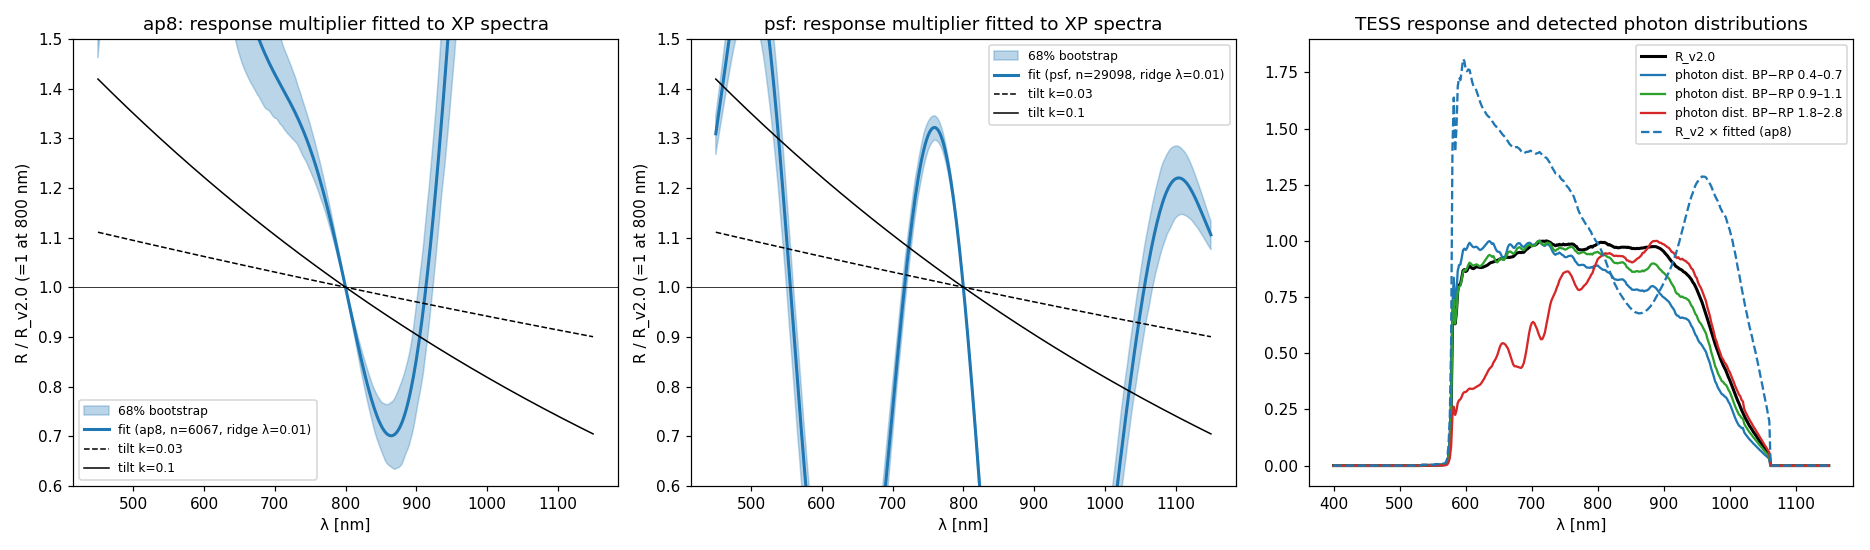
The fitted response is $R(\lambda) = R_{v2.0}(\lambda)\,\exp[\sum_j \alpha_j B_j(\lambda)]$, scored on held-out stars with 5-fold cross-validation.
- $R_{v2.0}(\lambda)$: the POC v2.0 response.
- $B_j(\lambda)$: spline basis functions on 580–1080 nm.
- $\alpha_j$: fitted amplitudes, with $R = R_{v2.0}$ at 800 nm.
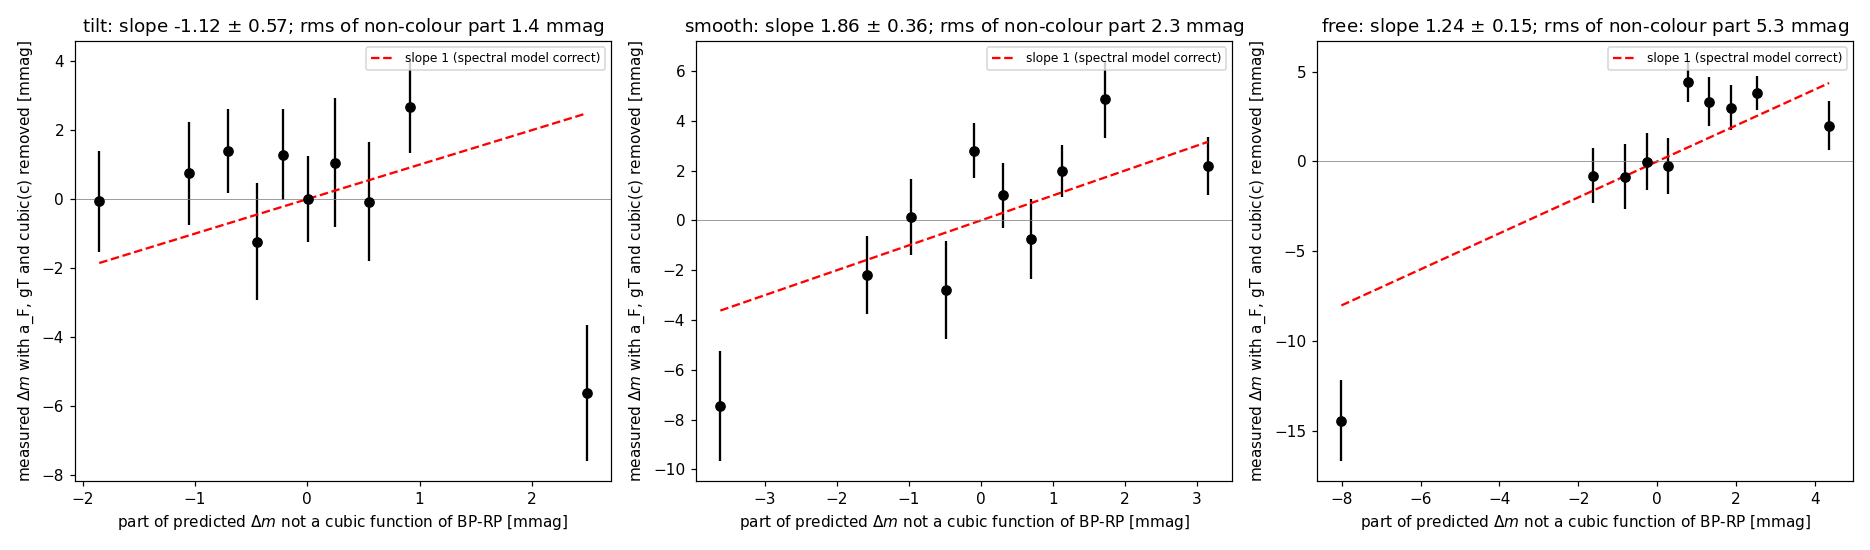
A smooth spline and a plain linear BP−RP term fit the held-out stars equally well (difference in loss $10^{-5} \pm 1.5\times10^{-3}$). The best spline oscillates and is not physical. A pure tilt is about 3σ worse. The test of the part of the tilt that is not a function of colour rests mostly on one bin, so treat that as tentative.
- Slope per camera: C1 44.6 ± 1.8, F1 37.9 ± 1.7, camera 3 38.3 ± 1.4, C4 41.1 ± 2.1 mmag/mag.
- F2 vs S22 (same CCD, two sectors): $\Delta b = 1.2 \pm 2.8$.
- Shifting the response's red edge needs −41 nm and fits worst of all the models.
p5 · What the literature says
- The v2.0 curve (Vanderspek, POC, 2020-07-30) is computed from component throughputs. Its only in-flight check is a normalisation: "~15,000 e⁻/s for T = 10 … correct to a few percent" (Instrument Handbook §7.1). It has no colour test.
- The TIC Tmag–colour relations (Stassun et al. 2019) are model spectra times the passband, not measurements. They "degrade considerably for M dwarfs".
- Montegriffo et al. (Gaia DR3 BP/RP external calibration) report a "strong systematic difference in RP for λ ≳ 950 nm" that depends on colour. p2 treats it.
- Handbook §6.6: straps add +4 to +10 % to the 1 µm sensitivity of strap columns, the flat field was taken at 780 nm, and "the magnitude of these variations has not been quantified". That leaves the flat-field/strap explanation untested.
- No published comparison of measured TESS flux with XP synthetic photometry was found.
- Sources and links: red_deficit_cause_20261012/p5_literature/README.md.
Records: /astro/armin/koji/syndiff/dev_runs/red_deficit_cause_20261012/README.md. Each part has its own README in p1_large_radius/, p2_red_anchor/, p3_xpfree/, p4_response_fit/ and p5_literature/, with its method, equations and the bugs found and fixed.
A · Red halo test: faint stars, big masks, all four cameras
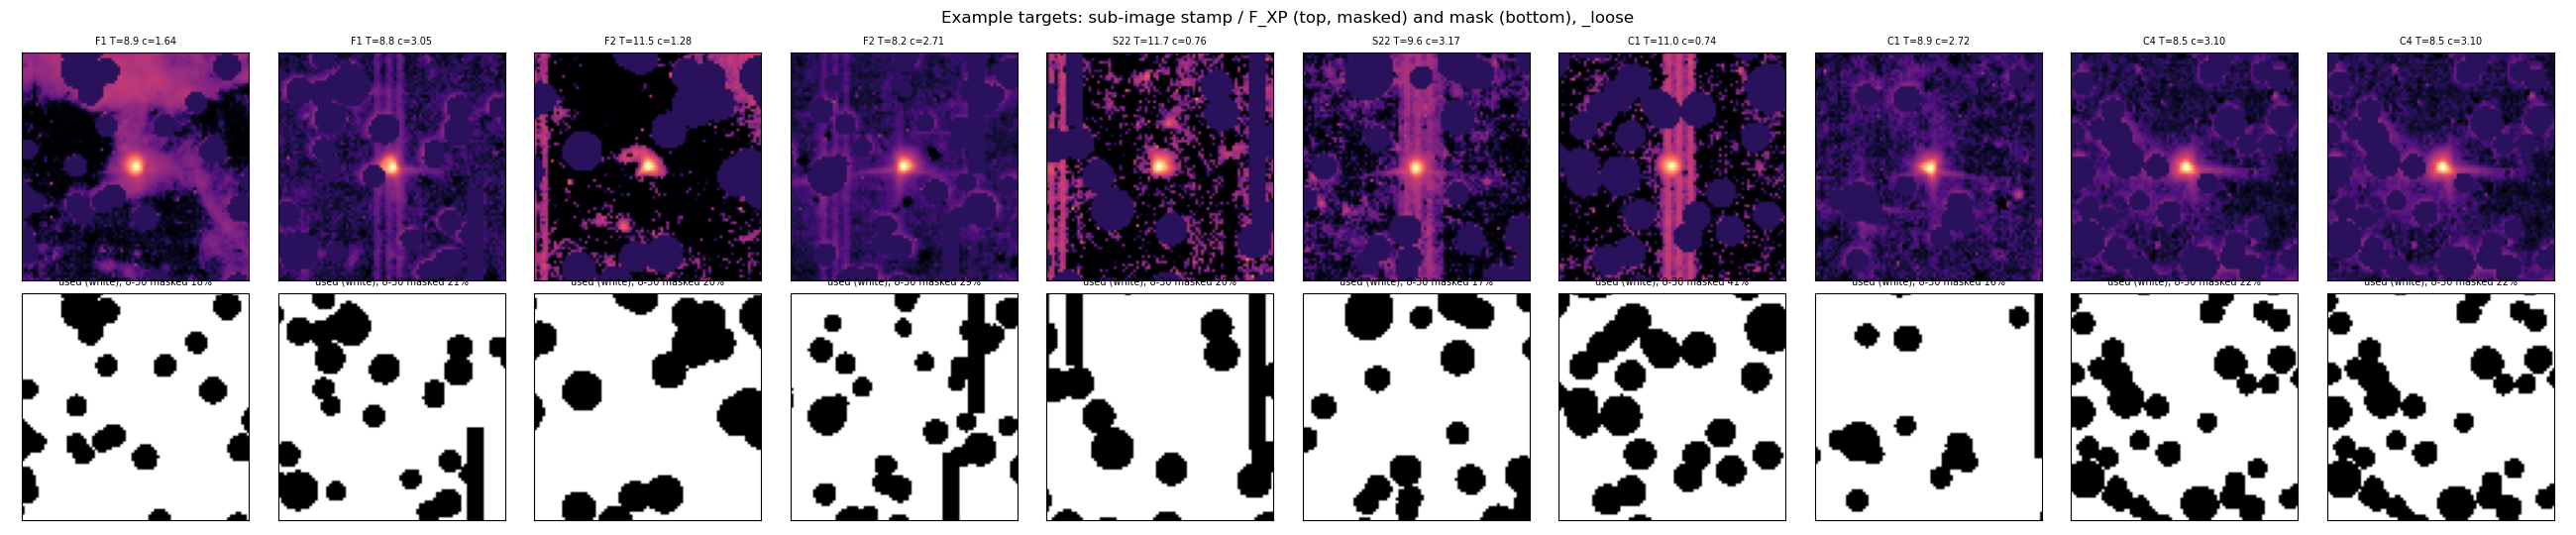
The 09-30 test excluded a red halo only for bright stars (T < 10, 10–20 per colour bin) on cameras 2 and 3. This test uses 2,354 stars at T 8–12.5 on all five fields. Each neighbour is masked out to wide radii, and the measurement runs out to 30 px.
Image. $S = \mathrm{FFI} - (a\,C + b)$:
- $C$: run3's PS1-template image. It contains only stars fainter than T ≈ 13, so subtracting it removes the faint-star crowding.
- $a(x,y)$: an order-2 Chebyshev scale, from run3's match fit.
- $b$: a constant offset, from the same fit.
Target stars and stars with T ≤ 13 are untouched FFI pixels. Nothing in this measurement convolves the target. Each star's sky is a plane fitted to the 40–50 px annulus. A plane cannot absorb a circularly symmetric halo; a quadratic could.
Enclosed flux and fits.
- $\bar S_k$, $A_k$: masked, sky-subtracted mean of ring $k$ (e⁻/s/px; 4σ-clipped beyond 6 px) and its exact area (px²). Rings are 0.5 px wide inside 6 px and 1 px wide to 30 px, with 5×5 sub-pixel assignment.
- $F_{XP,s}$: Gaia XP spectrum × POC v2.0, as $10^{-0.4(T_{XP}-20.44)}$ e⁻/s. $T_{XP}$ comes from paper1_figures_20261009/xp_synth_T.
- $c_s$: BP−RP.
- $a_F$, $a'$: intercepts, one per field.
- $g$, $g'$: magnitude terms. At fixed T, red stars are fainter in other bands, so this term is needed.
- $b(r)$: total-flux colour slope in mmag/mag. Positive means red stars are fainter than XP × v2.0 predicts.
- $h$: the colour slope of the light between $r_1$ and $r_2$, in % of $F_{XP}$ per mag. Hiding the 8 px deficit would need $h \approx +3.5$.
- Weighting and errors: $q_s$ is weighted by $F_{XP,s}^2$, because the sky noise is constant in e⁻/s. Fits are clipped at 4 MAD, and errors are bootstrapped over stars.
Big masks.
- Every neighbour with T ≤ 13.2 within 60 px is masked out to where the steep part of its wing falls below $3\times10^{-5}$ of the target's flux per pixel (minimum 3 px, maximum 20 px).
- Bleed columns of stars with T < 7.5 are masked.
- A target is rejected if a brighter star lies within 10 px, if any of its rings is too heavily masked, or if neighbour wing light leaks past the masks.
- The leak limits are 0.5 % inside 8 px and 1 % at 8–30 px ("strict", 882 stars), or 2 % and 3 % ("loose", 2,354 stars).
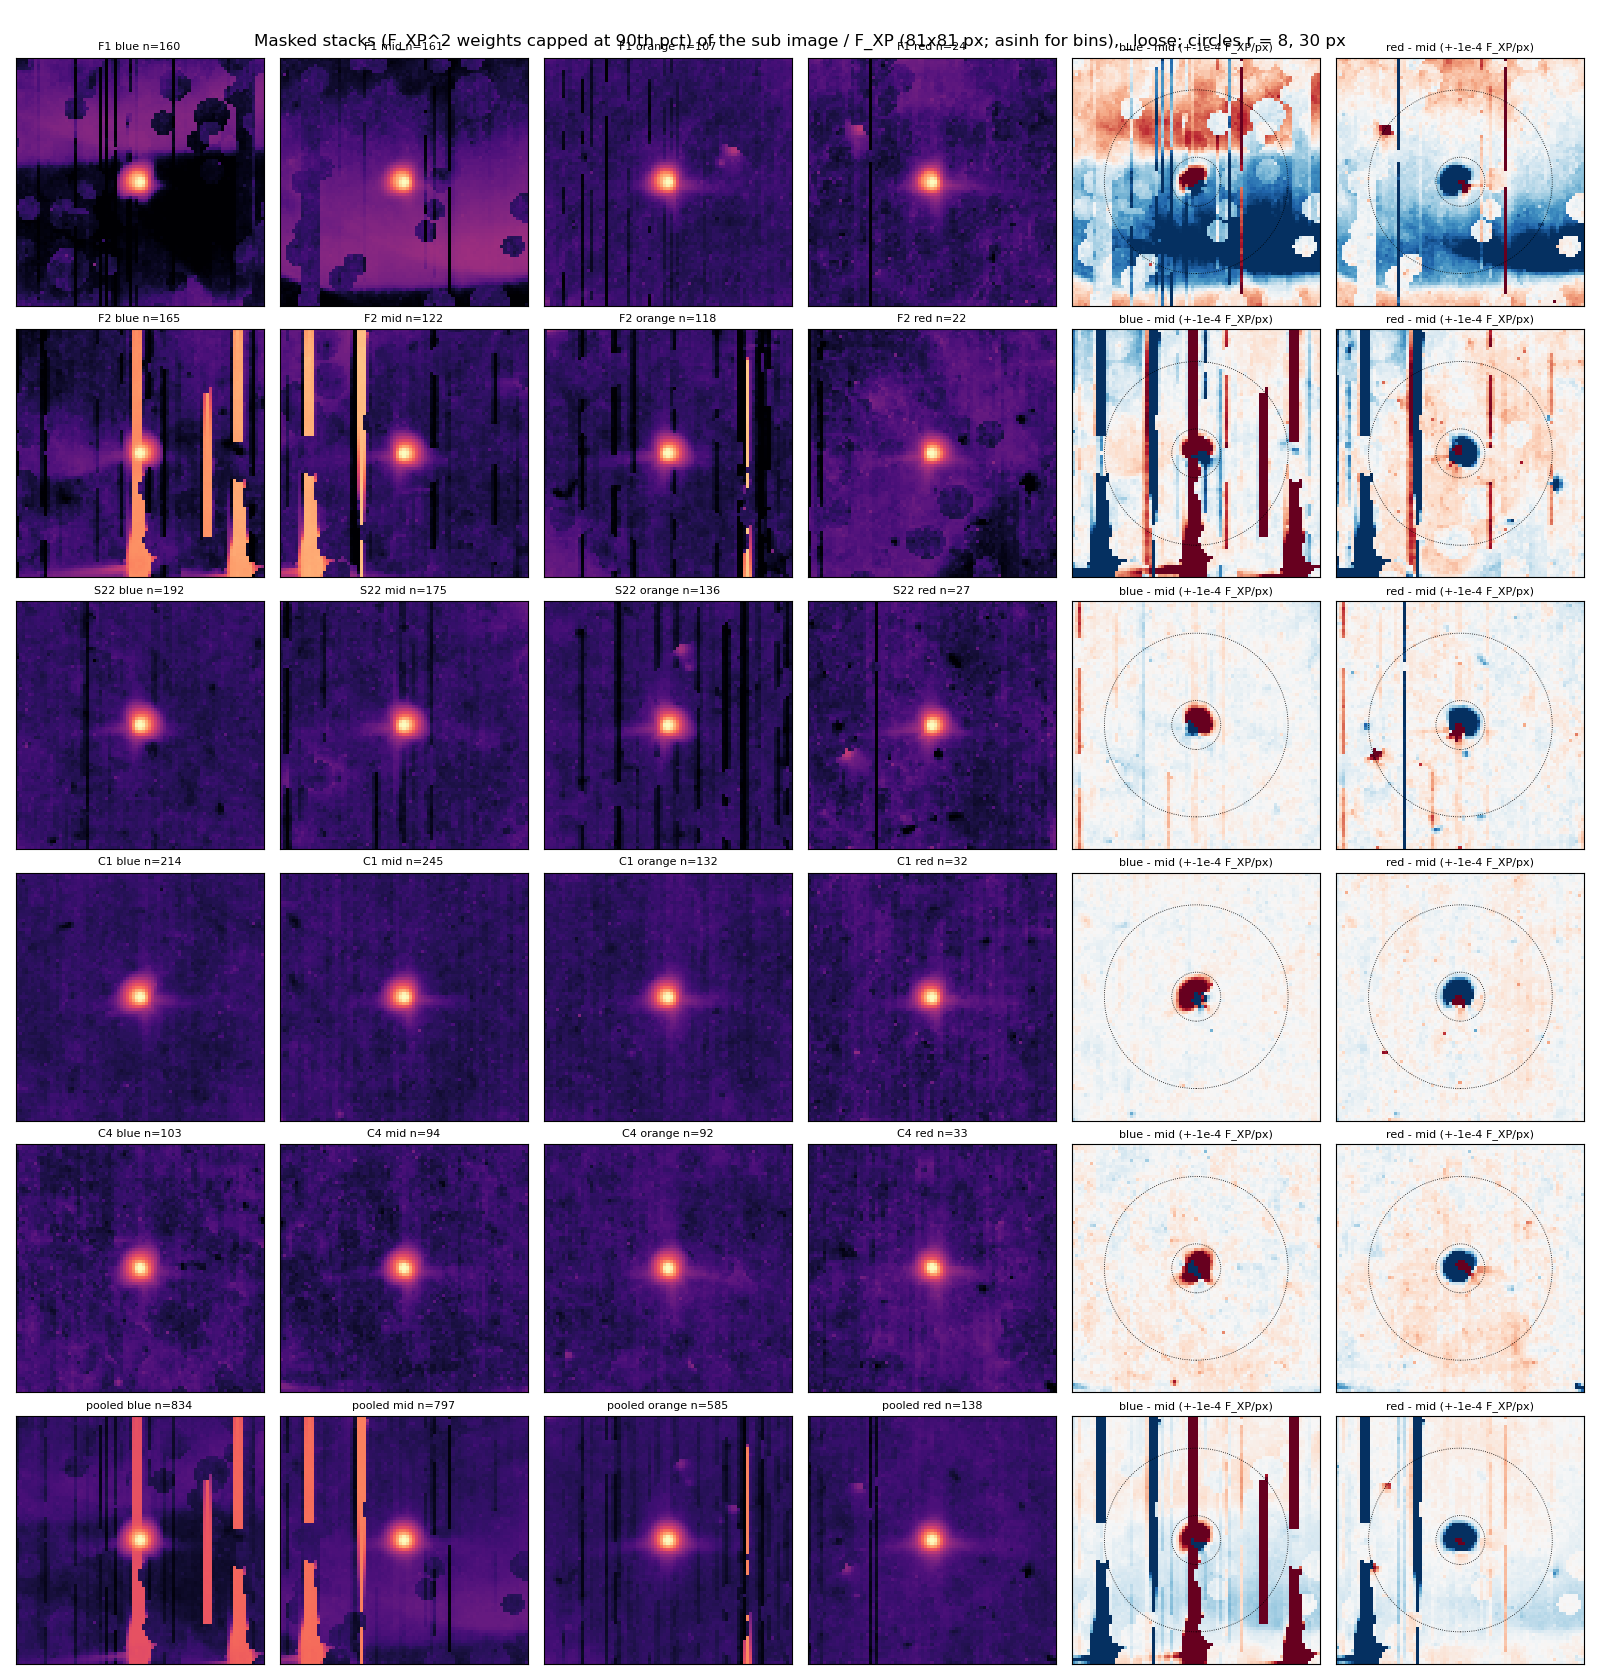
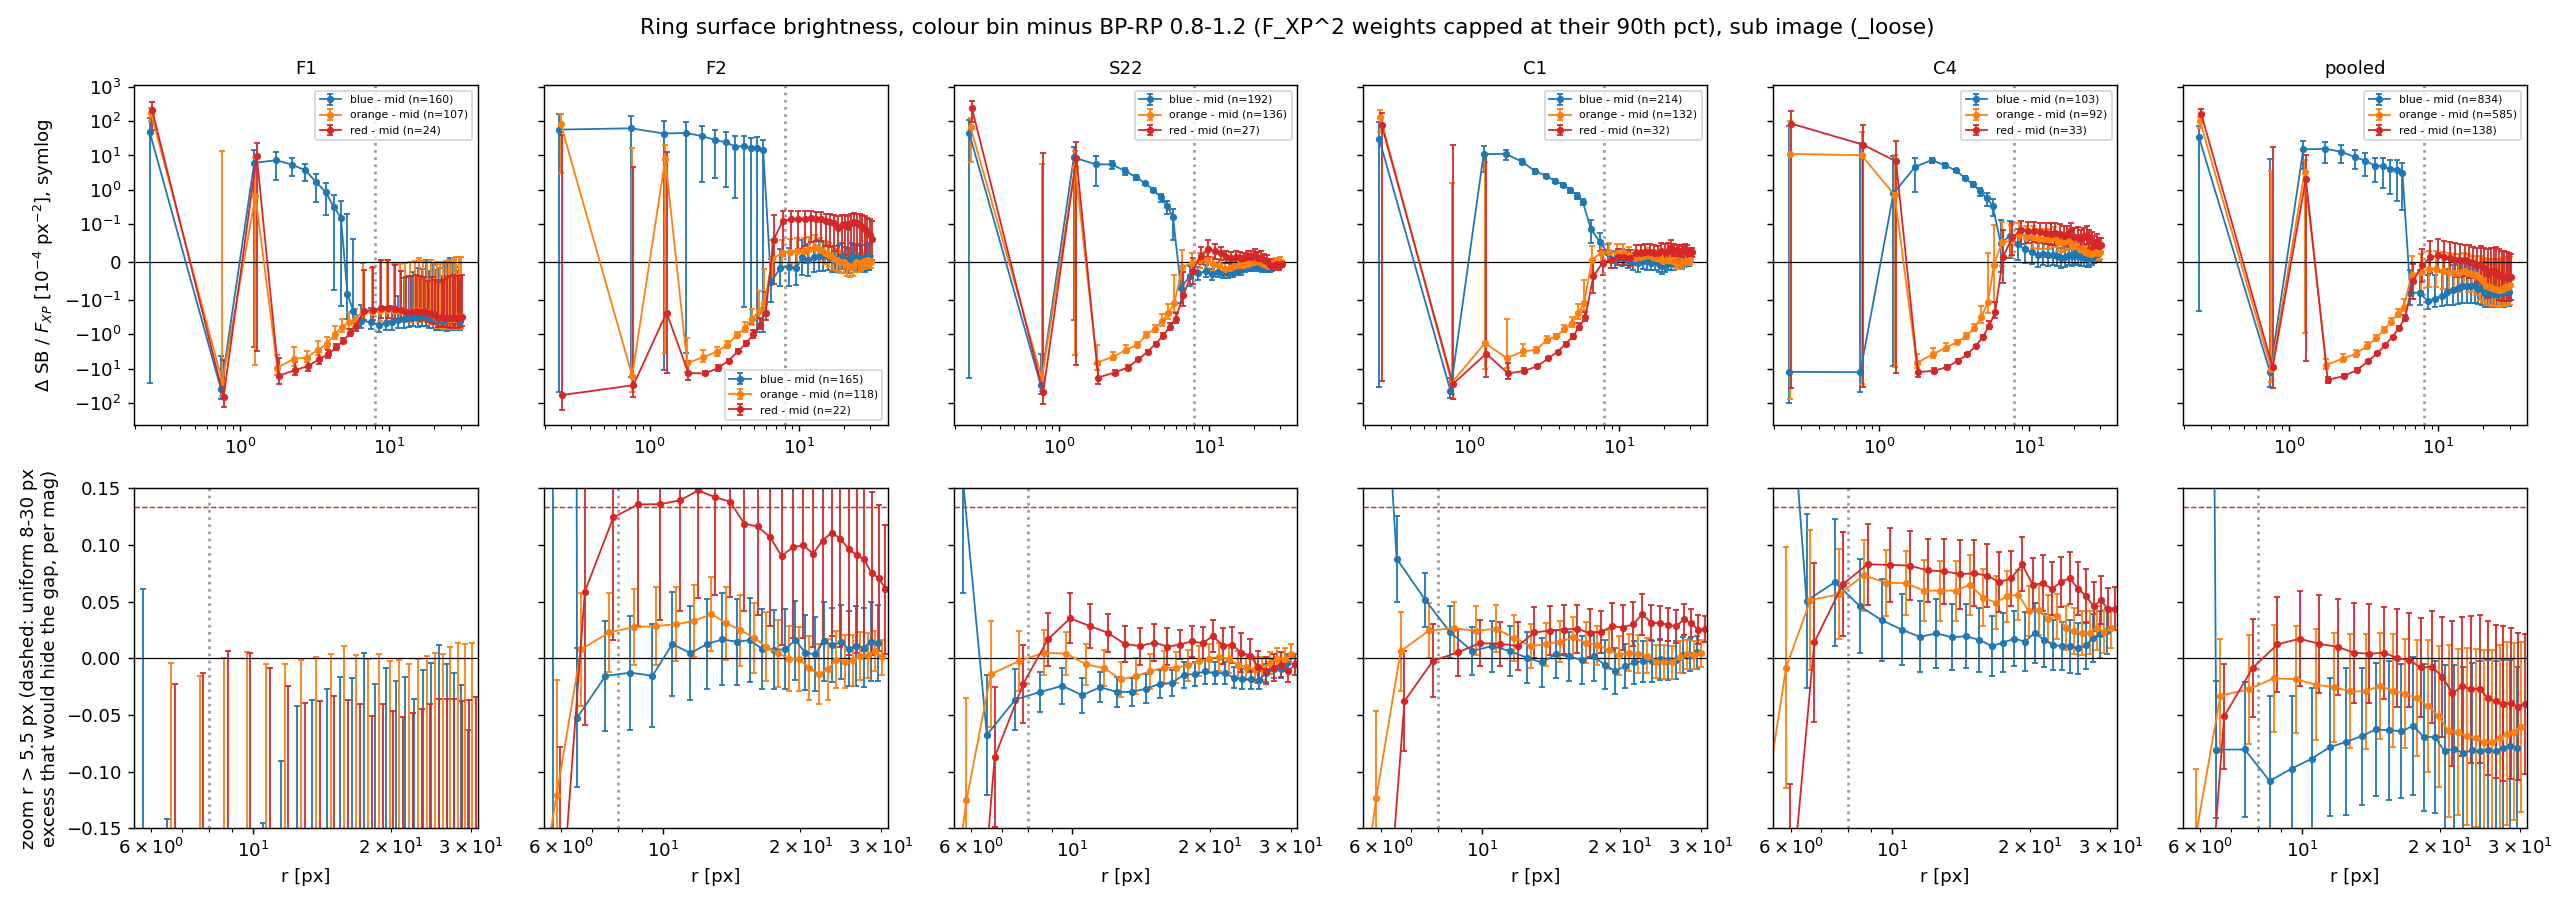
- C1, S22, C4: red − mid shows a dark core (the deficit) and no bright ring beyond 8 px.
- F1, F2: a few heavily weighted stars on a scattered-light band (F1) or on unmasked bleed columns (F2) dominate the stacks. Their panels are hard to read. The fits clip these stars.
| Field (camera) | n loose | b(8) mmag/mag | b(30) mmag/mag | h 8–15 %/mag | h 8–30 %/mag |
|---|---|---|---|---|---|
| F1 (cam 2) | 452 | +36.5 ± 2.7 | +42.7 ± 5.1 | +0.02 ± 0.06 | −0.13 ± 0.24 |
| F2 (cam 3) | 427 | +40.2 ± 4.2 | +40.2 ± 5.8 | +0.05 ± 0.05 | +0.03 ± 0.18 |
| S22 (cam 3) | 530 | +36.6 ± 2.4 | +30.3 ± 5.9 | +0.11 ± 0.05 | +0.26 ± 0.21 |
| C1 (cam 1) | 623 | +44.4 ± 2.3 | +41.0 ± 6.9 | +0.02 ± 0.05 | +0.16 ± 0.19 |
| C4 (cam 4) | 322 | +40.6 ± 2.9 | +37.5 ± 5.3 | +0.19 ± 0.09 | +0.84 ± 0.31 |
| Pooled, loose | 2354 | +39.6 ± 1.3 | +37.8 ± 2.7 | +0.08 ± 0.03 | +0.23 ± 0.12 |
| Pooled, strict | 882 | +40.3 ± 2.2 | +42.6 ± 3.3 | +0.05 ± 0.03 | +0.22 ± 0.12 |
Limits of this test
- Faint stars cannot test the halo one by one. Real sky structure (scattered light, unresolved stars) in the 8–30 px ring scatters by 25 % of a T 11.5 star's flux at empty positions; at 8–15 px it is 6 %. The pooled fit is weighted by $F_{XP}^2$, so most of the constraint comes from T 8–11.5. Within that range the T 8–10 and T 10–11.5 subsets agree: $h$(8–15) = +0.08 ± 0.03 and +0.44 ± 0.21 %/mag. T 11.5–12.5 alone gives +1 ± 4, which carries no information.
- Light beyond about 40 px is not tested. The 40–50 px sky annulus would absorb a halo that extends that far.
- Strict isolation in these fields is almost impossible: masking every catalogue star in a raw co-add kept 1 of 8,712 C1 targets. That is why stars fainter than T ≈ 13 are subtracted with the template, and only the brighter neighbours are masked.
hp_d caveat
- The run3 difference image hp_d is not used for the halo term. Its background map ks_b is built TESSreduce-style: stars with T < 13 are masked to 6–10 px, then a 2 px Gaussian smooths the result. Outside the mask it can follow whatever light is there.
- The ePSF wing study tested how much star light ks_b actually takes on F2 (dev_runs/epsf_wing_excess_20261012/step2_trace):
- within 10 px it carries ≤ 0.08 ppt of the star's flux per ring;
- beyond 10 px its offset is additive, set by the background rather than scaled with the star.
- So hp_d does not remove a star-proportional halo at 8–10 px. Beyond 10 px it can still bias aperture sums by an additive offset. The main image $S$ avoids the question by not subtracting ks_b. On these stars the hp_d halo term is +0.02 ± 0.04 %/mag, consistent with $S$.
B · What the XP validation rules out, and what it does not
With no red halo, the deficit of about 3.7 %/mag must come from the TESS red response or from XP's red flux. Gaia XP synthetic PS1 photometry has been checked against real PS1:
- r, i, z: agree to ≤ 0.001 mag (gaia-xp-synthetic-ps1 check, 09-25).
- y (about 920–1030 nm): the XP / PS1 ratio has a colour slope of −0.34 ± 0.04 %/mag for XP Std and +0.39 ± 0.05 %/mag for raw XP. This is measured on F1 only. The y-band offset itself, +0.05 ± 0.14 %, comes from the PS1 flux-chain study (DR1 mean PSF), also on F1.
Ruled out: an XP flux error over the r, i and z bands. An XP colour error in the y band on F1 larger than about 0.4 %/mag. Both are about ten times smaller than the deficit.
Not ruled out:
- The y validation is on one field (F1). It has not been repeated on F2, S22, C1 or C4.
- XP spectra end at 1020 nm, but the POC v2.0 response runs past that. The extrapolated tail holds 0.8 % (blue) to 2.4 % (red) of the TESS photons. Neither the PS1 comparison nor XP itself checks that tail.
- A narrow-band error that the broad y filter averages out cannot be excluded.
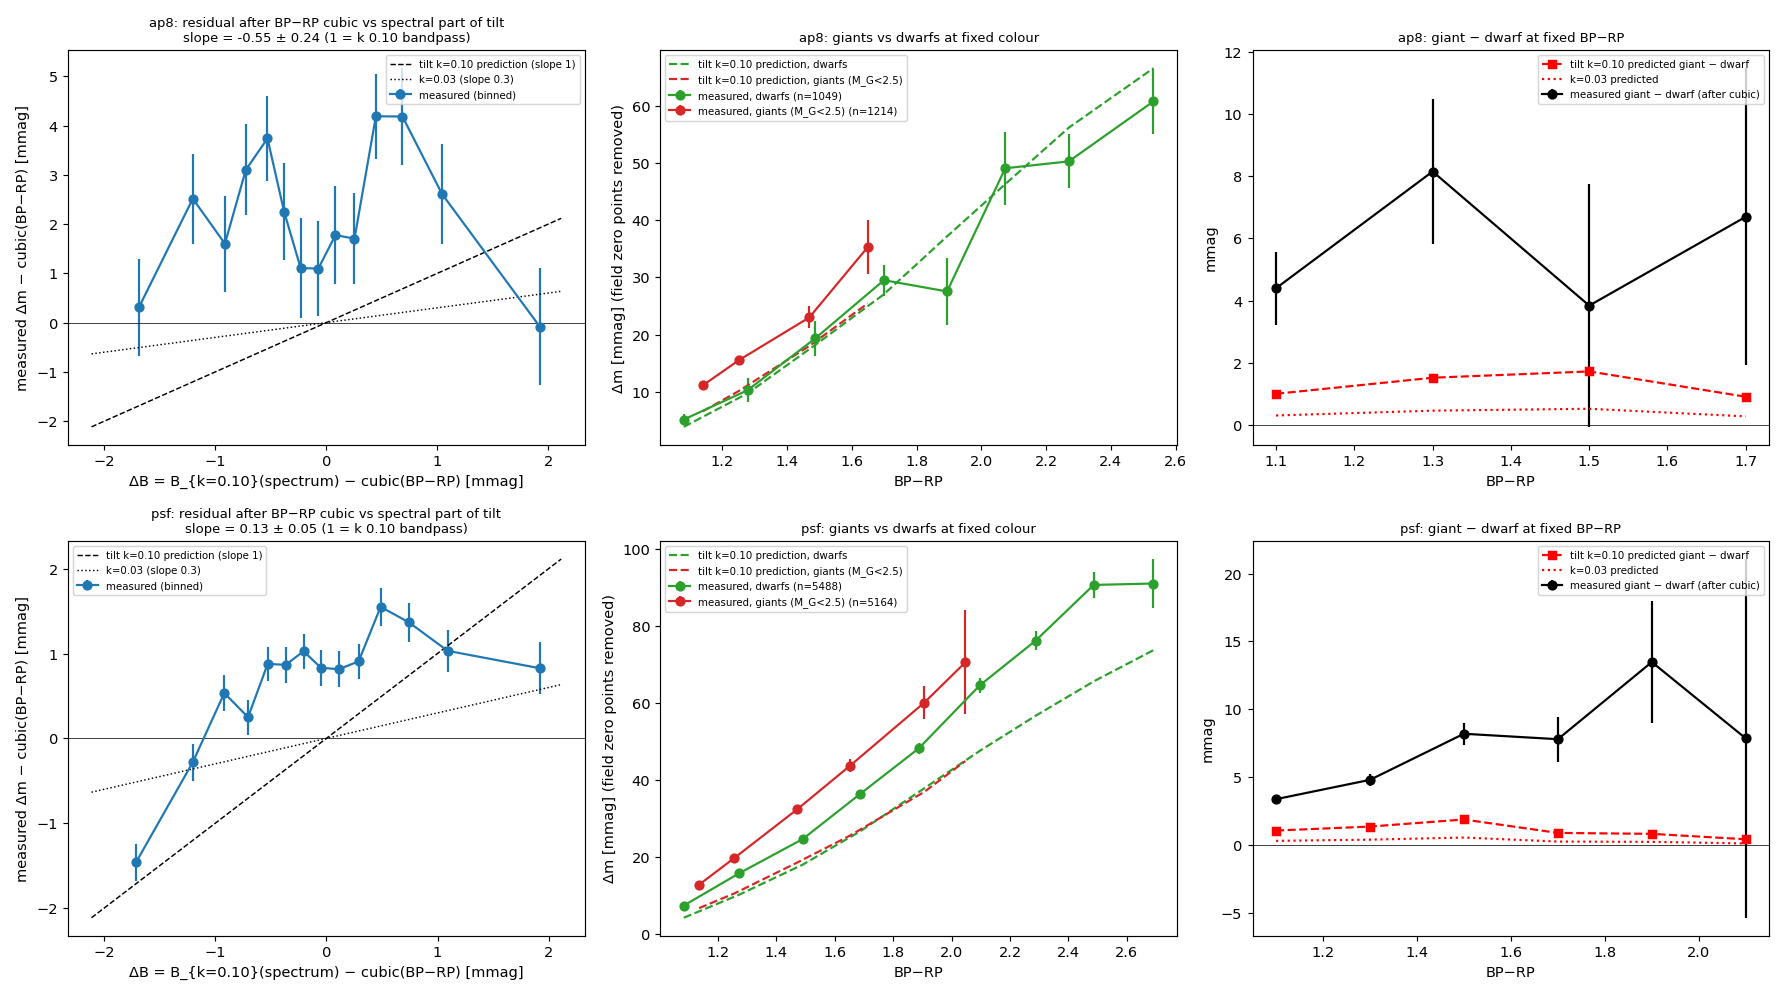
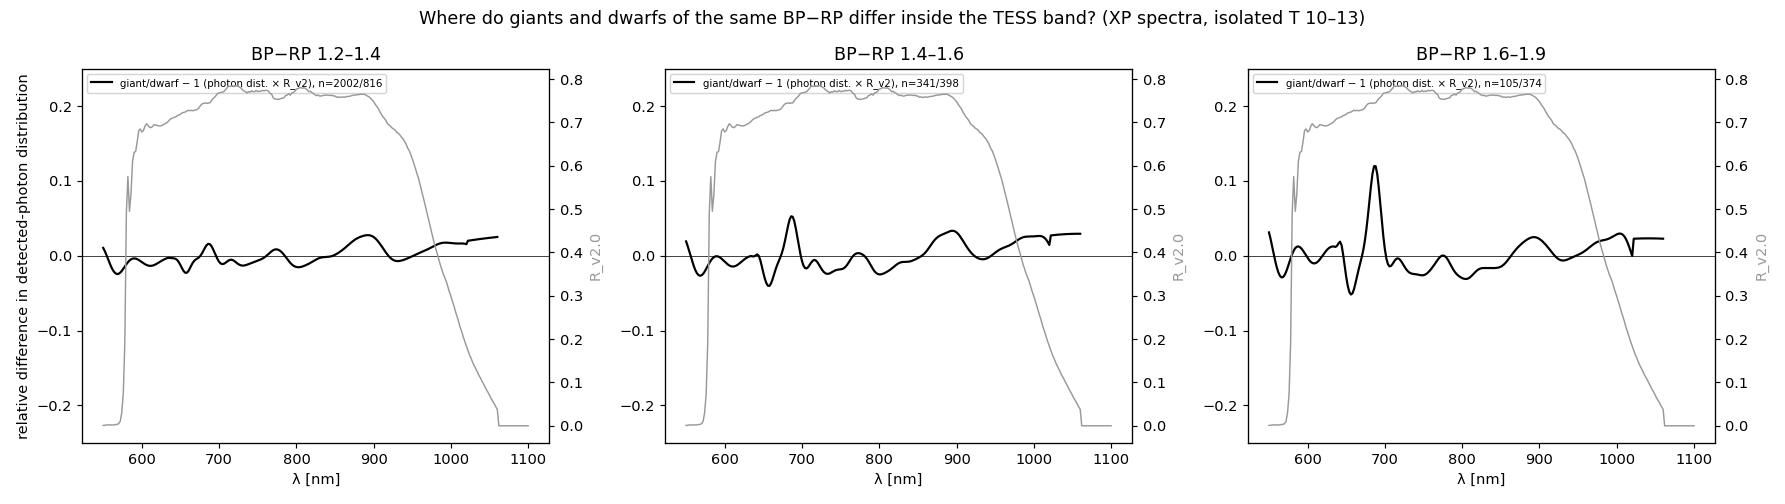
- The giant − dwarf offset, 4–13 mmag at the same colour (section 4), is unexplained.
Section A rules out light spread outside 30 px. Section B narrows the cause to the response or the XP red tail, but does not decide between them. New tests are with the user to decide.
Method
For each star $i$ in field $f$:
- $m_{X}$: measured magnitude, $-2.5\log_{10}$ of either the run3 out-of-fold PSF flux (e⁻/s, A3 recipe refit on the final image, each star scored in the fold that held it out) or an 8-px aperture sum on the run3 final image (band_w hp_d, where T≤13 stars are not in the template).
- $F_\lambda$: GaiaXPy calibrated XP spectrum, 336–1020 nm in 2 nm steps, extended to 1200 nm by a power law fitted on 960–1020 nm. The extension holds 0.8 % (blue) to 2.4 % (red) of the TESS photons.
- $R(\lambda)$: TESS response; $R_{v2.0}$ is the POC v2.0 curve. The zero point is set per field by isolated stars with BP−RP 0.8–1.2.
Trial responses and the fit:
- $k$: tilt (dimensionless); $k = 0.1$ makes the response 10 % lower per 100 nm redward of 800 nm.
- $N_i(R)$: the photon integral above for star $i$ through response $R$.
- $\mathrm{ZP}_f,\ \beta_f$: per-field zero point and grey magnitude slope, fitted. $T_i$ is the TIC magnitude.
- Fit by Cauchy loss with a 20 mmag scale; errors from star bootstraps (statistical only).
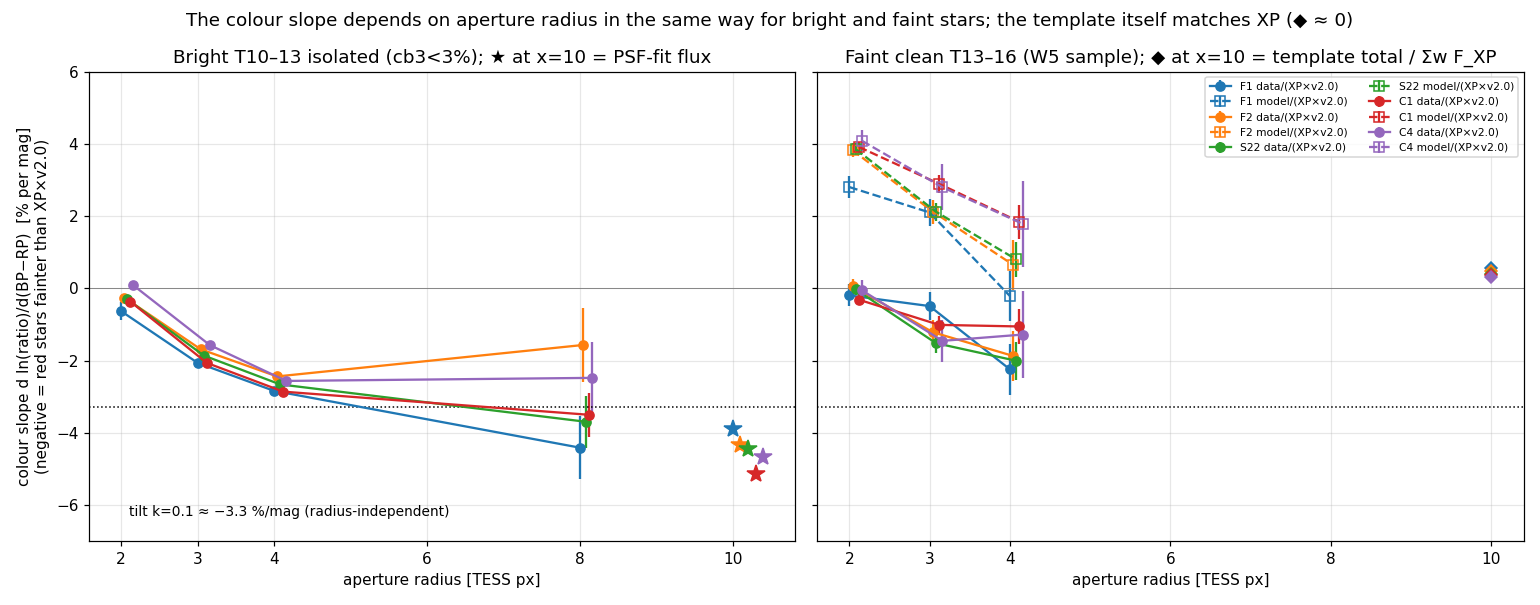
The aperture correction is $A_r = m_{\mathrm{PSF}} - m_{\mathrm{ap}}(r)$, measured on isolated stars. Isolation means aperture contamination $c_r = \sum_k (f_k/f_0)\,\phi_r(d_k) < 0.03$, where $f_k$ is a neighbour's catalogue flux (T ≤ 13.5), $d_k$ its distance and $\phi_r(d)$ the fraction of its light that falls in the target's $r$-px aperture.
1 · The colour term on five CCDs
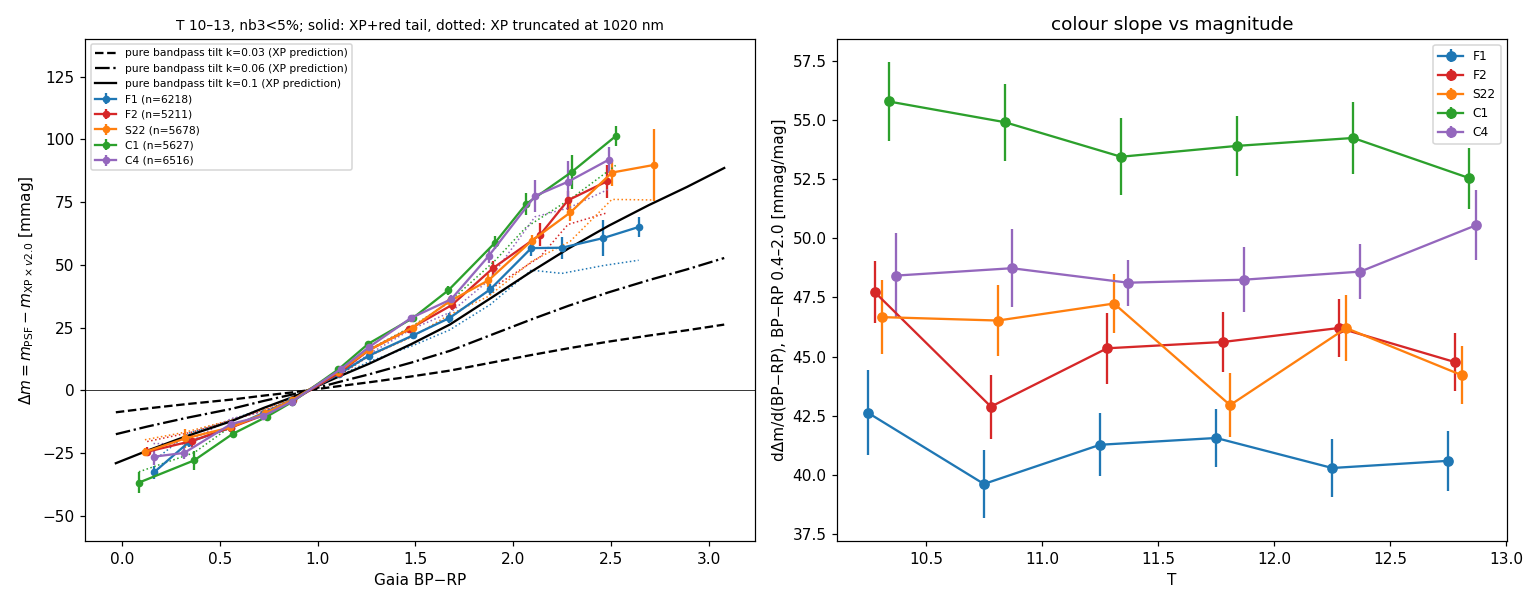
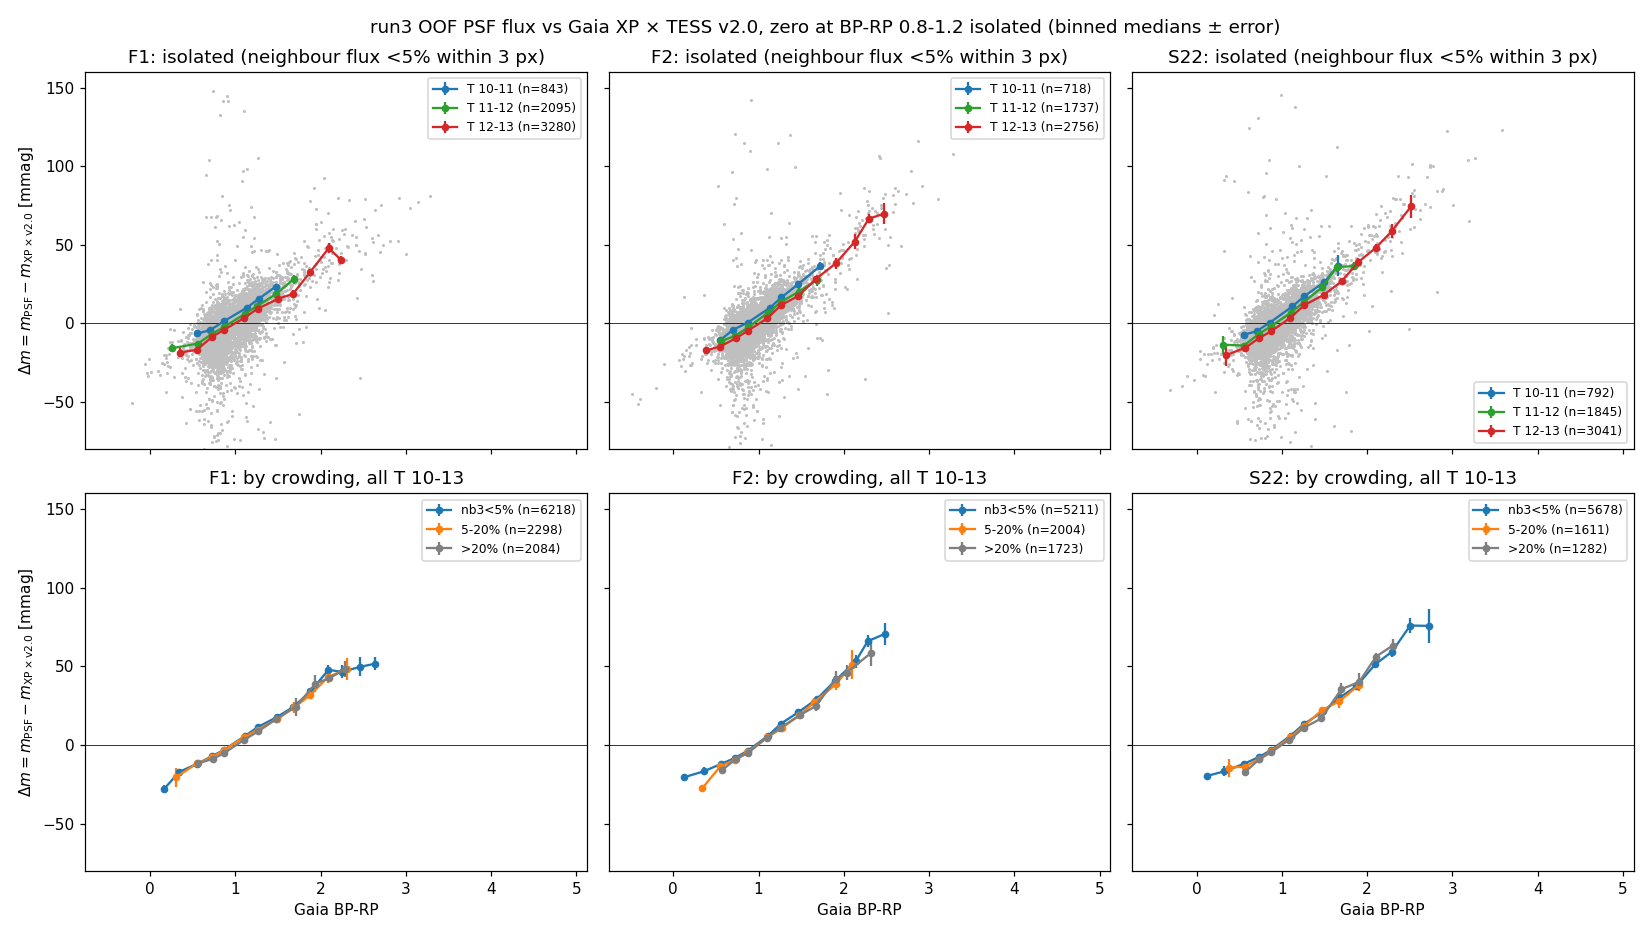
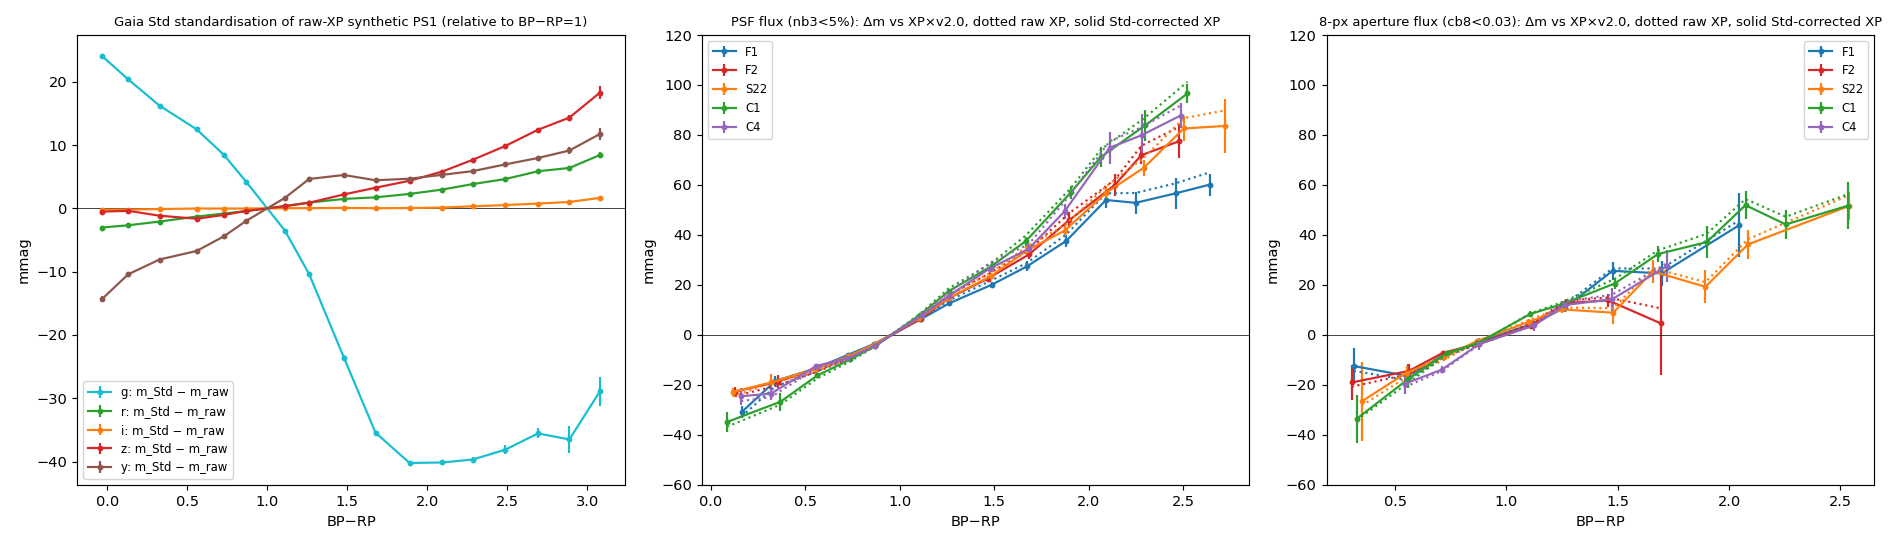
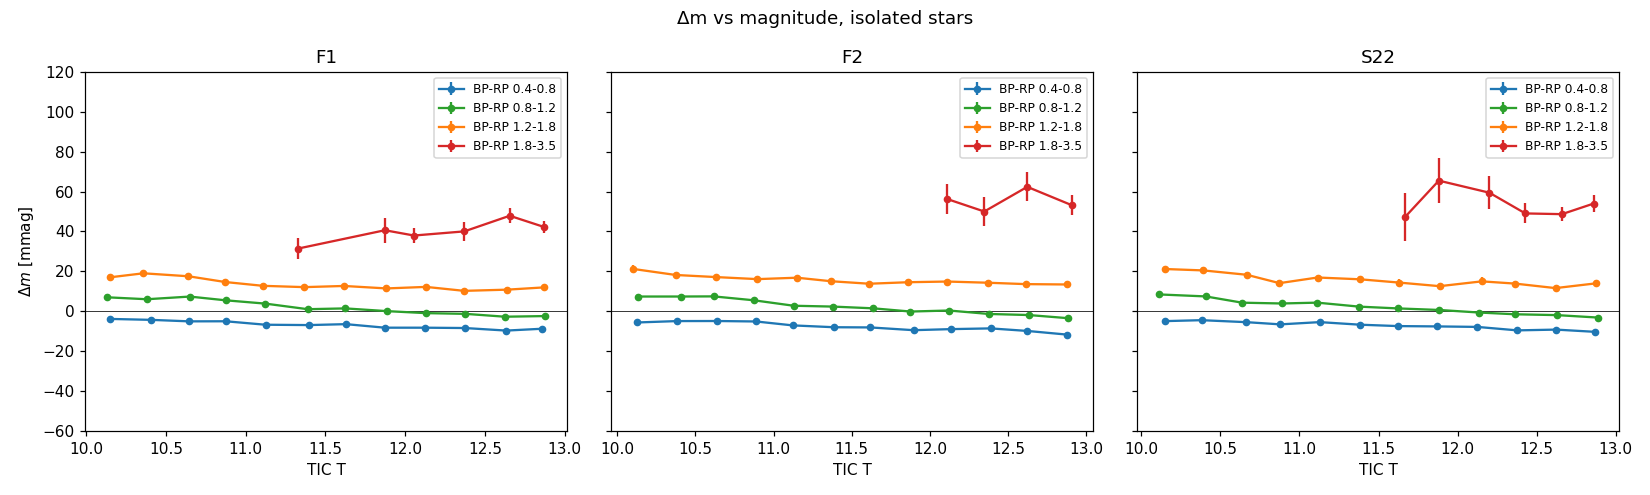
With PSF flux, Δm rises by 41–54 mmag per mag of BP−RP. The rise is the same at every crowding level and every magnitude bin from T 10 to 13, but it differs between CCDs by more than the errors.
2 · Aperture correction vs bandpass
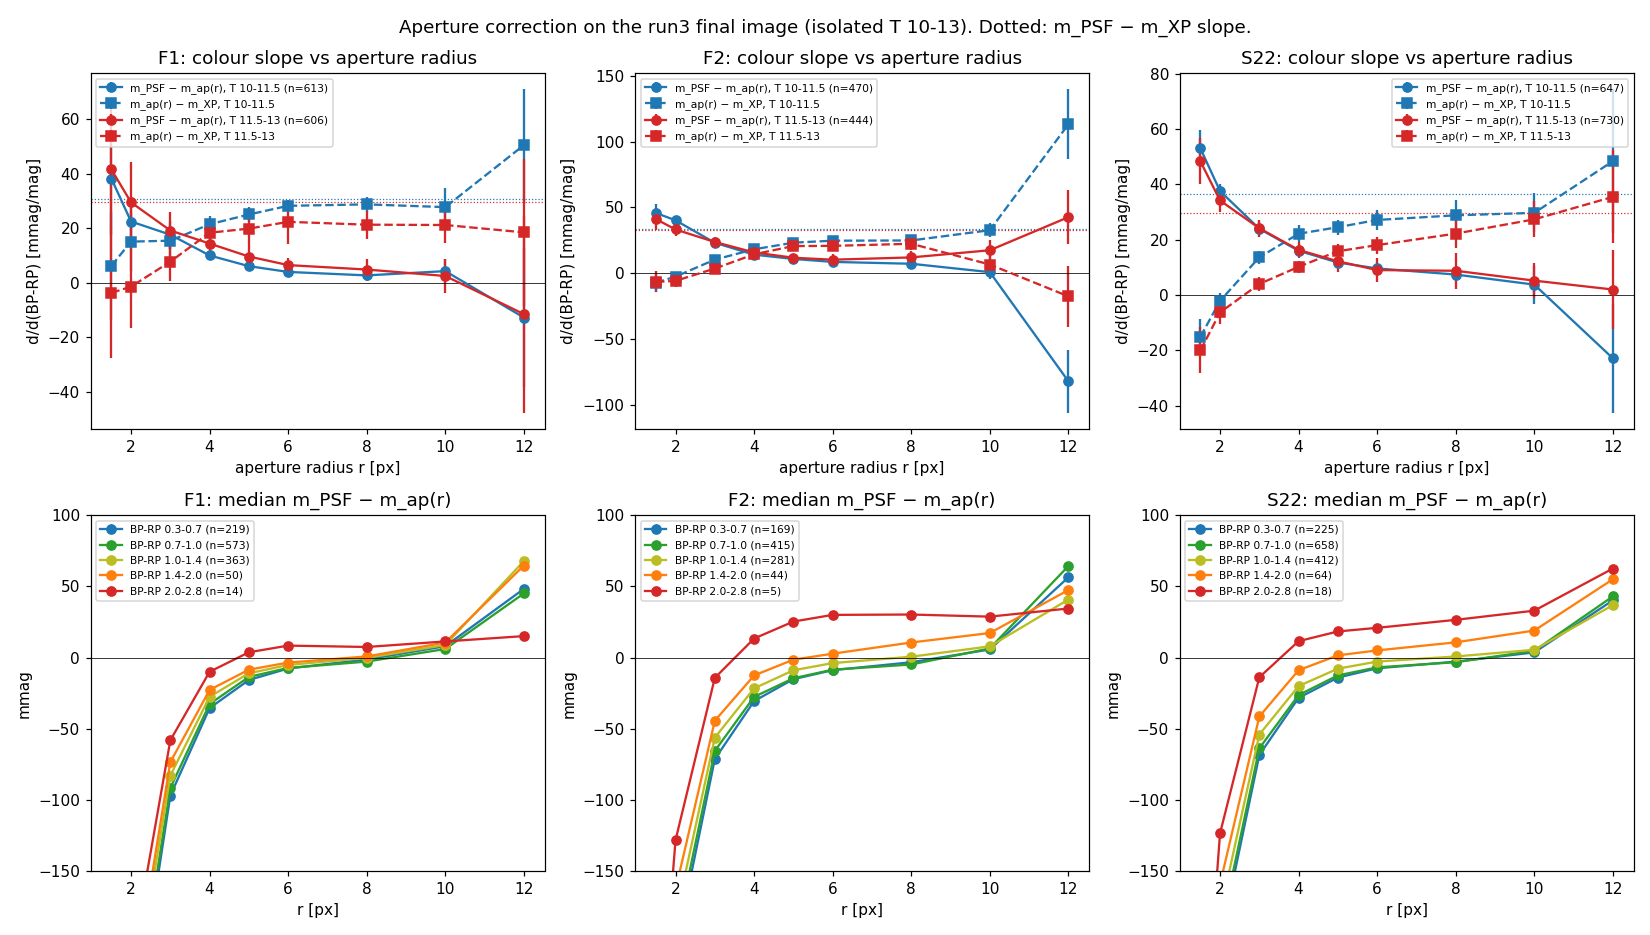
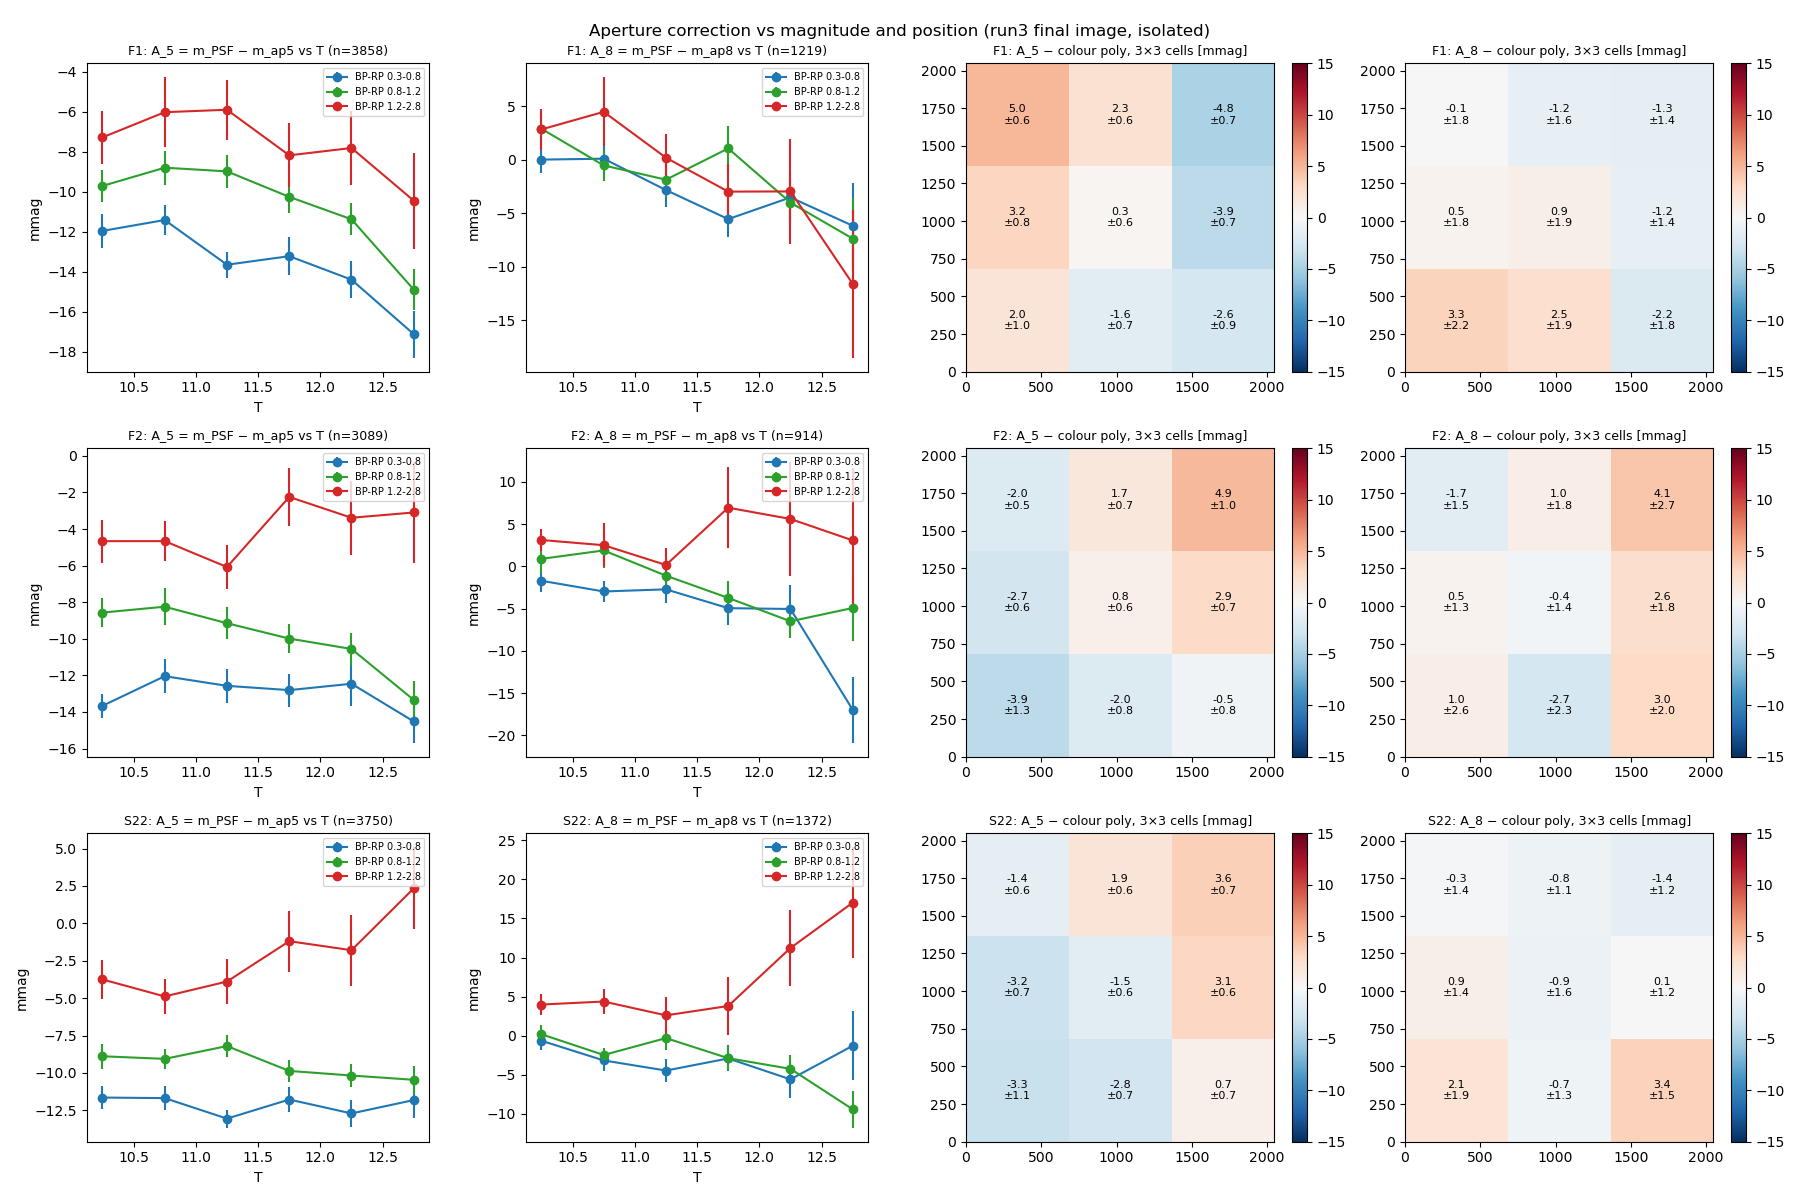
Measuring the same stars in apertures of growing radius on the final image splits the PSF colour term in two. Only $+3$ to $+16$ mmag/mag is PSF-vs-aperture; the rest stays in the 8-px flux. Beyond 8 px the growth curve is dominated by a sky-level bias that grows as $r^2$ and is colour-flat within errors.
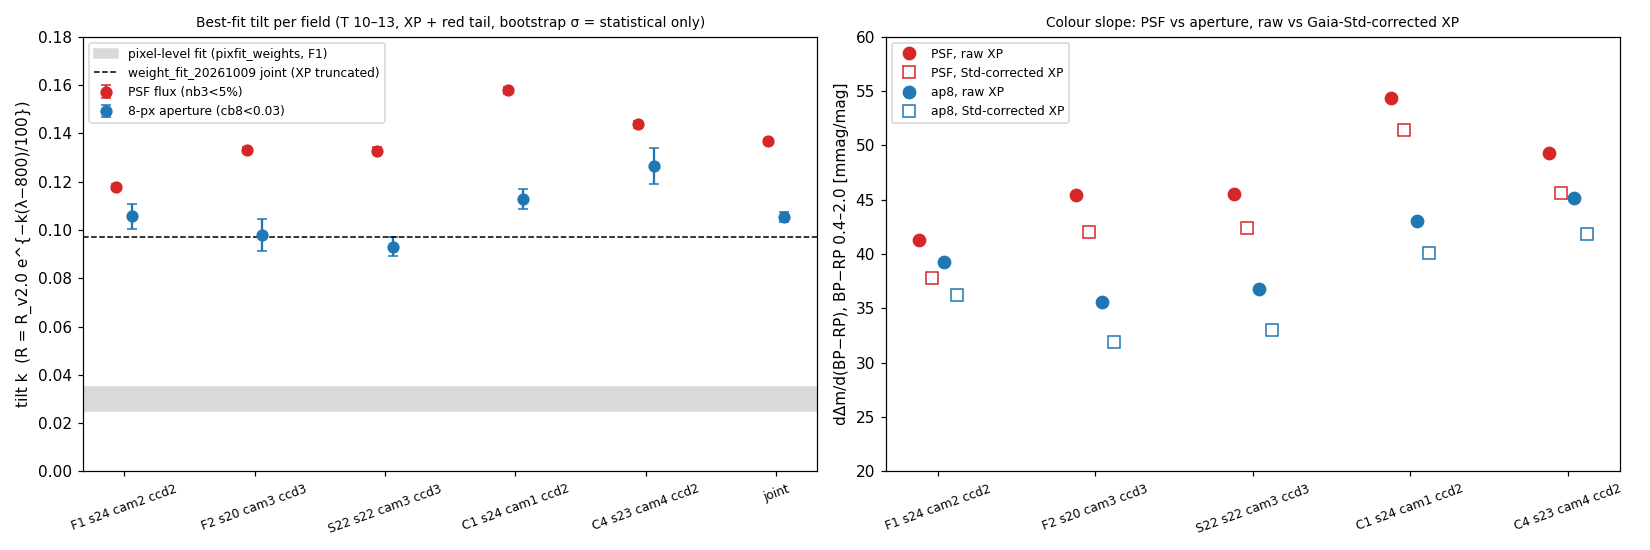
| Field (sector, camera, CCD) | n PSF / n ap8 | k PSF | k ap8 | slope PSF raw / Std | slope ap8 raw / Std | A8 colour slope |
|---|---|---|---|---|---|---|
| F1 (s24 cam2 ccd2) | 6184 / 1219 | 0.118 ± 0.001 | 0.106 ± 0.005 | 41.3 / 37.8 | 39.2 / 36.2 | +4.7 ± 18 |
| F2 (s20 cam3 ccd3) | 5183 / 914 | 0.133 ± 0.001 | 0.098 ± 0.007 | 45.4 / 42.0 | 35.5 / 31.9 | +15.7 ± 5.1 |
| S22 (s22 cam3 ccd3) | 5644 / 1372 | 0.133 ± 0.001 | 0.093 ± 0.004 | 45.6 / 42.4 | 36.8 / 33.1 | +15.6 ± 3.5 |
| C1 (s24 cam1 ccd2) | 5601 / 1765 | 0.158 ± 0.002 | 0.113 ± 0.004 | 54.4 / 51.4 | 43.0 / 40.1 | +12.2 ± 5.0 |
| C4 (s23 cam4 ccd2) | 6486 / 797 | 0.144 ± 0.001 | 0.126 ± 0.007 | 49.3 / 45.6 | 45.2 / 41.8 | +4.4 ± 18 |
| Joint | 29098 / 6067 | 0.137 ± 0.001 | 0.105 ± 0.002 | +11.9 ± 2.2 |
Slopes in mmag per mag of BP−RP over 0.4–2.0. k errors are bootstrap (statistical only); the field-to-field scatter of k ap8 (±0.012) is the realistic error.
3 · Magnitude and position
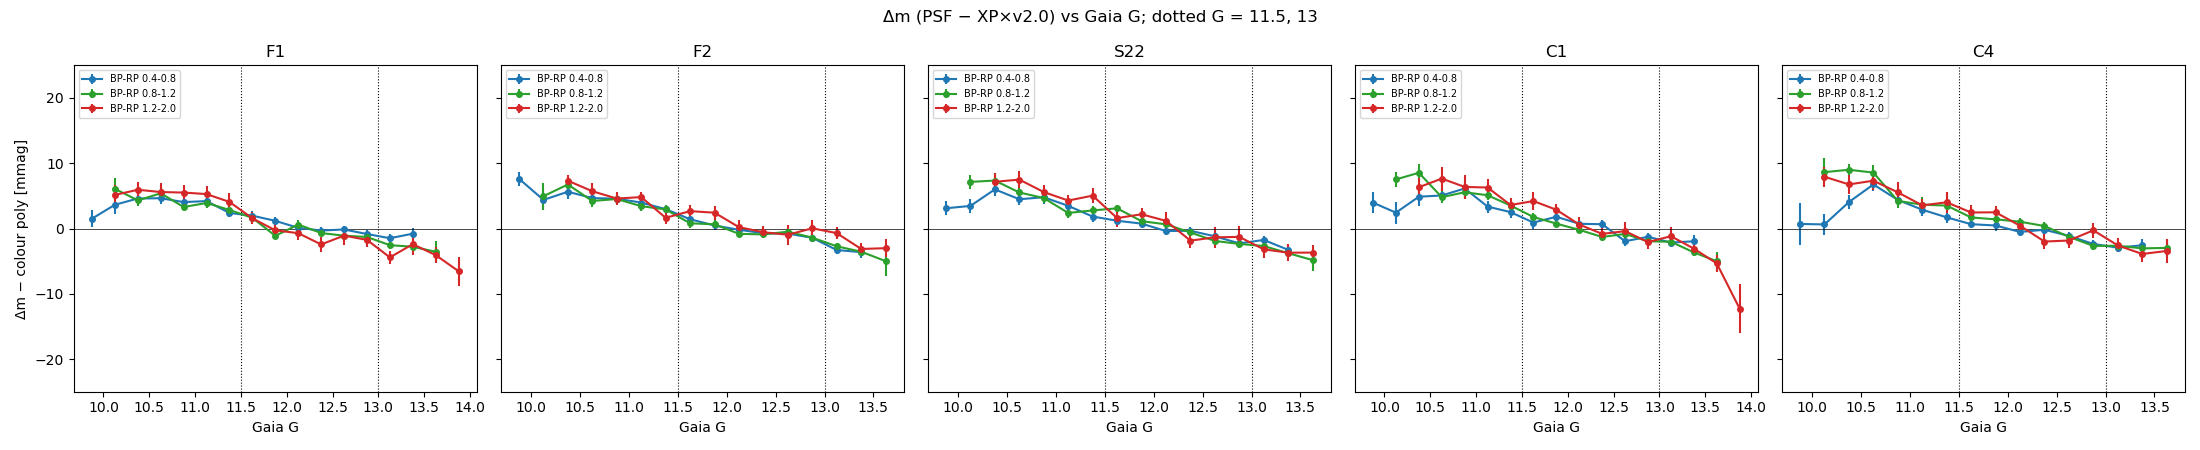
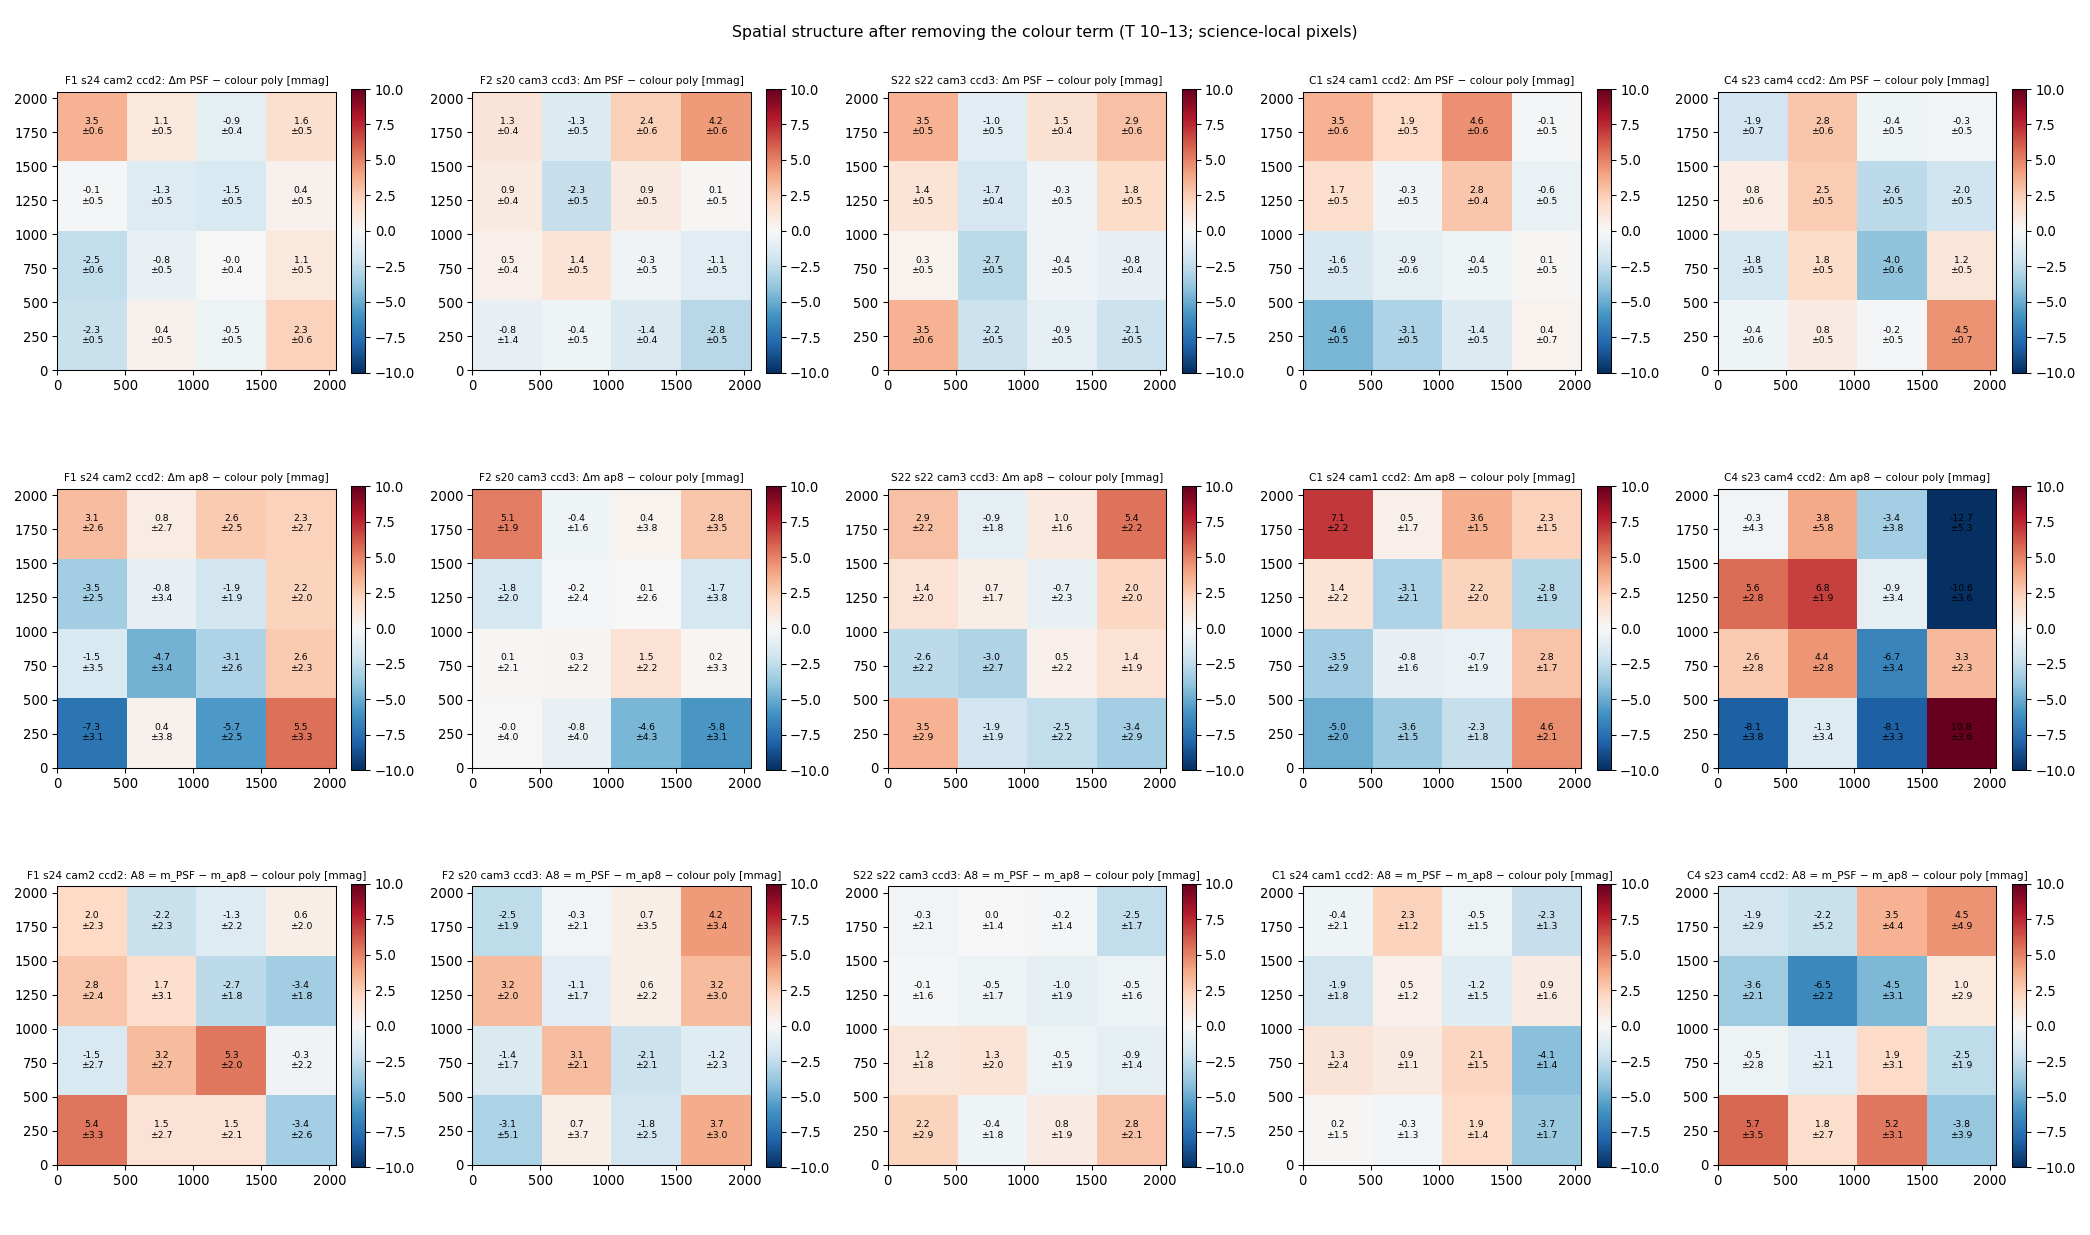
Two terms remain after the colour term: a grey brightness term and a few-mmag spatial term. Neither changes with colour, so neither feeds into the bandpass question.
4 · Can the spectra separate bandpass from aperture?
A bandpass change acts on each star's whole spectrum; a colour-dependent aperture loss acts only through colour. So the part of a tilt's prediction that is not a function of BP−RP is the handle. For a $k = 0.10$ tilt that part is only ±2 mmag, and the data do not follow it.
| Model for the colour term (held-out, 5-fold) | loss, ap8 | loss, PSF |
|---|---|---|
| none (v2.0 exact) | 0.8024 | 0.4287 |
| BP−RP linear | 0.7018 | 0.2368 |
| BP−RP cubic | 0.7018 | 0.2346 |
| tilt $k$ | 0.7077 | 0.2358 |
| tilt + curvature | 0.7055 | 0.2355 |
| tilt + curvature + linear colour | 0.7011 | 0.2342 |
| PS1 Std weights r, i, z, y | 0.6984 | 0.2282 |
Loss = mean $\log(1+(r/20\,\mathrm{mmag})^2)$ on held-out stars; lower is better. 6,067 aperture and 29,098 PSF stars. The PS1-weight model wins on both, but its free fit puts z at 0 (r/i/z/y ≈ 0.26/0.55/0/0.19 for ap8), so only the colour tilt is determined.
What this rules out, and what is open
- Ruled out: neighbour light (no crowding dependence); magnitude dependence of the colour term (flat T 10–13); raw-XP calibration as the main cause (Std correction removes only 3–4 mmag/mag); XP window-class steps; $k \approx 0.03$ for star total flux.
- Established: a common total-flux colour term on five CCDs in three cameras, $k \approx 0.09$–0.11 depending on the XP treatment, and a CCD-dependent PSF aperture-correction colour term of +5 to +16 mmag/mag.
- Answered 10-12 (section A): the common term is not deep-red light scattered to 8–30 px. $h = +0.23 \pm 0.12$ %/mag on all four cameras, against +3.5 needed.
- Ruled out 10-09: PS1 y or the template as the cause. The template follows XP to ≤ 0.6 %/mag per band. Its y band is about 4 % bright, but that offset is the same at every colour; it comes from a halo in the PS1 y stack images.
- Withdrawn 10-09: "the model's red core is too concentrated". Data and model concentrate red light in the core by the same amount.
- Open: TESS red response vs the XP red tail beyond 1020 nm (section B). The giant − dwarf offset. Light beyond 40 px. Why faint stars' data / model ratio changes between R = 2 and R = 4 px.
Bugs found and fixed:
- A 20 px neighbour-flux cut left almost no stars in these crowded fields. It was replaced by profile-weighted contamination.
- Two zero-point centring errors in the spatial and aperture panels.
- On 10-12, measure_halo.py crashed when no empty-sky reference position survived the masks (C4 strict). An empty array is now handled.
Records:
- /astro/armin/koji/syndiff/dev_runs/redhalo_faint_bigmask_20261012/README.md: section A. Scripts are scripts/measure_halo.py and analyse_halo.py; numbers in data/summary[_loose].json.
- /astro/armin/koji/syndiff/dev_runs/bandpass_xp_t10_13_20261009/README.md: sections 1–4 and B. Scripts in scripts/, tables in data/, XP spectra in xp/.
- Builds on weight_fit_20261009, pixfit_weights_20261009, tess_bandpass_report_20261009, g5_colour_slope_20260930 and epsf_wing_excess_20261012/step2_trace.