One TESS FFI: preliminary → scene → final

Rows: T 13–14, 14–15, 15–17 · columns: blue, mid, red · shared scale ±1.1% per native px · 3×3 CCD grid
A couple of things to notice: bright star positive residual, red star negative residual, overall dipoles
Residual: Hotpants vs per-band kernels (F1)
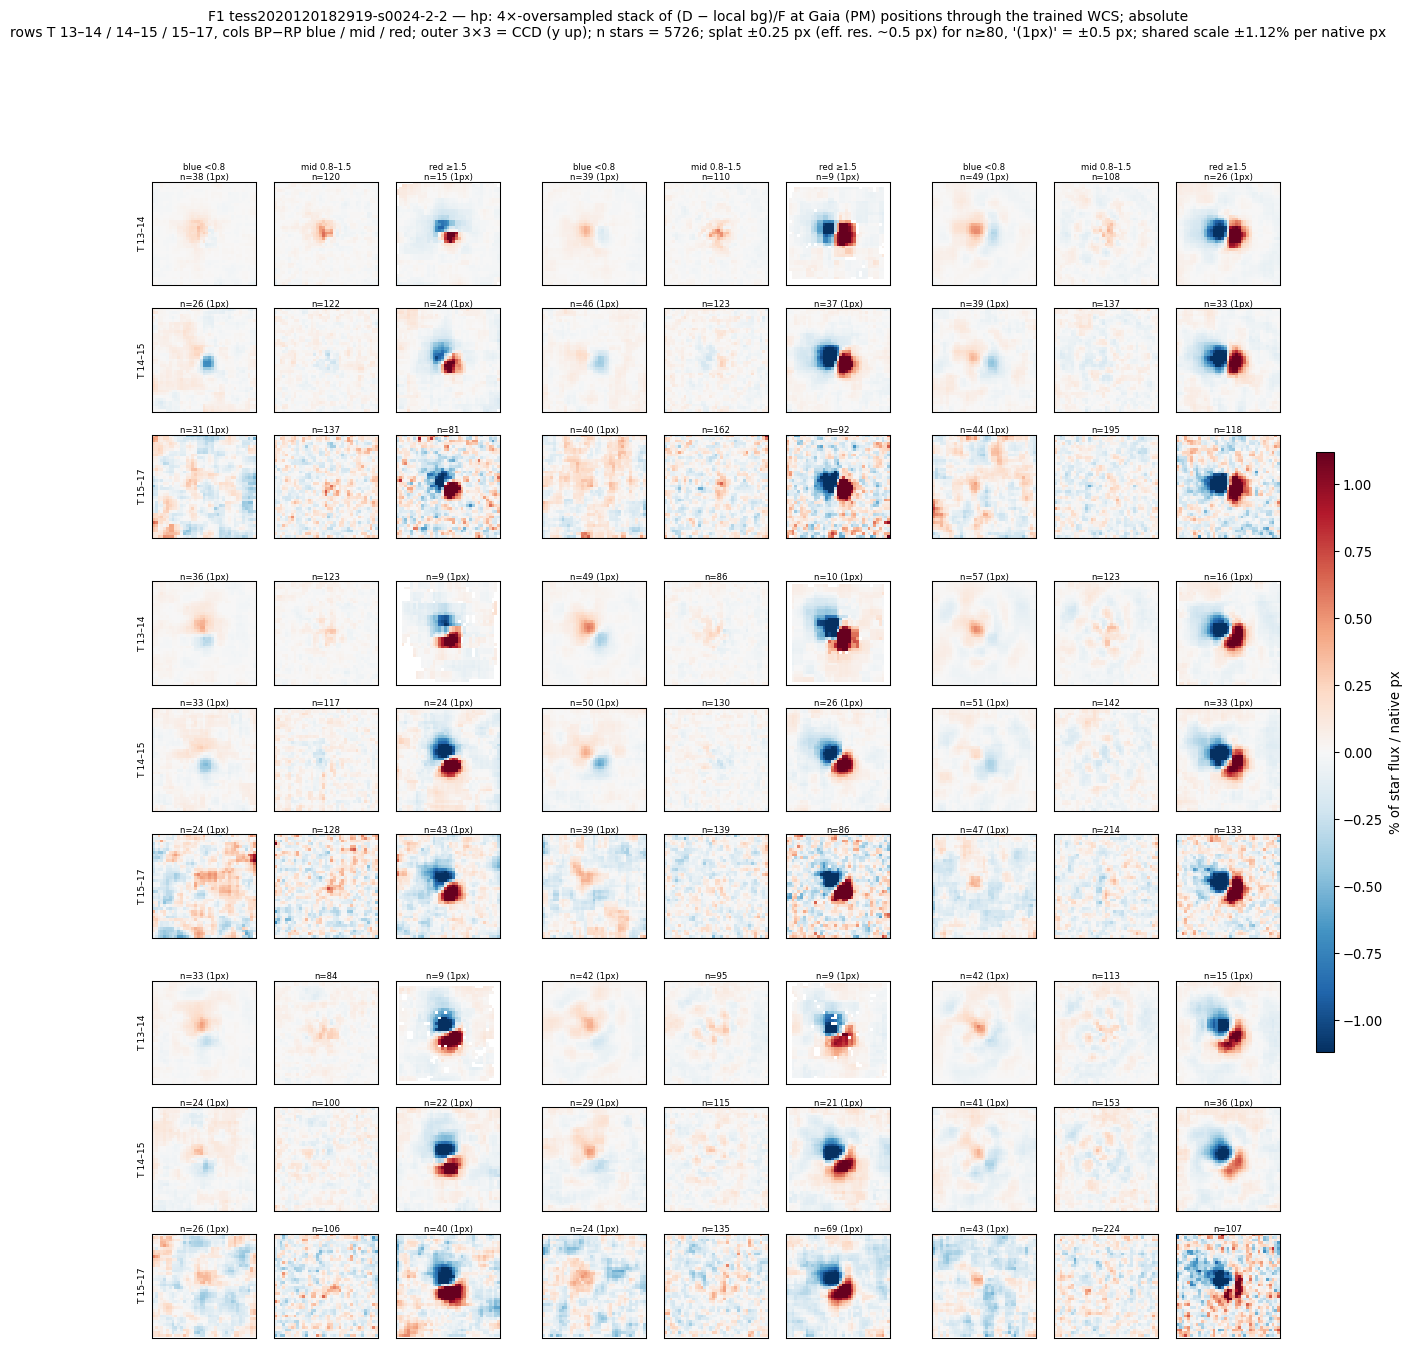
Hotpants, one kernel
Per-band kernels
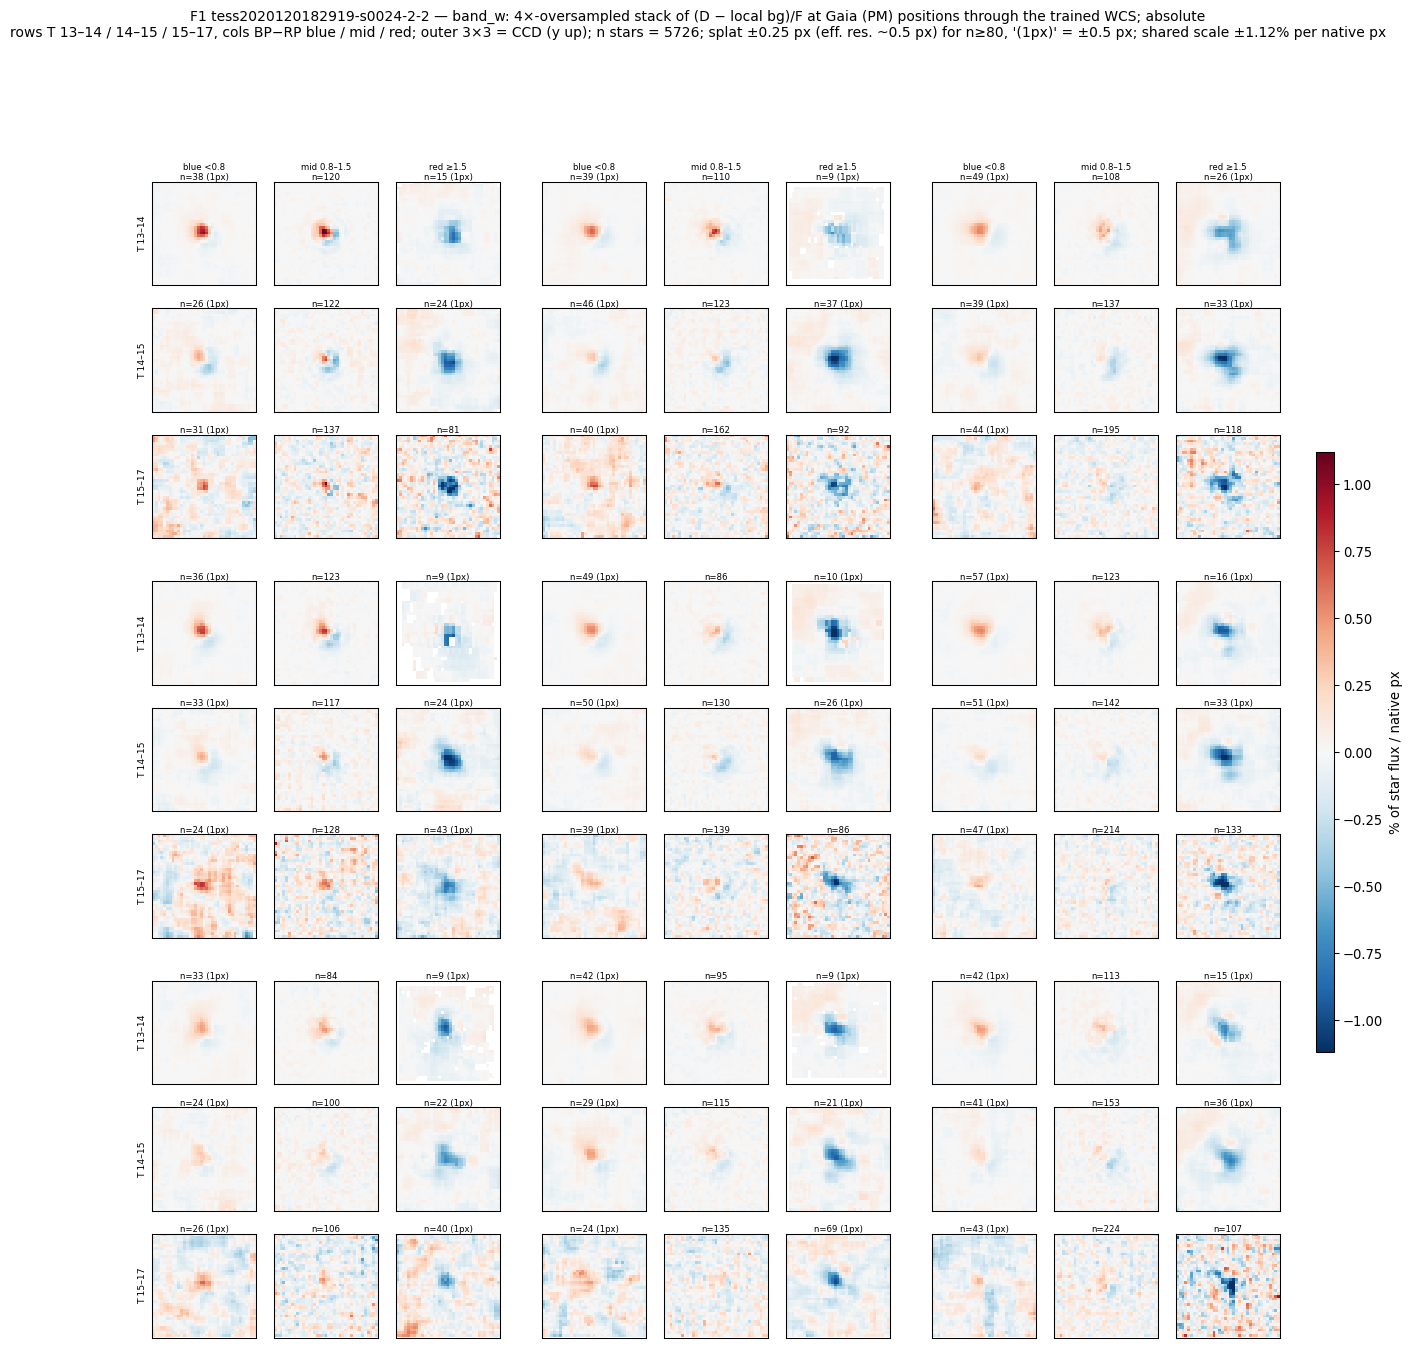
Per-band kernels: lowest faint-star χ²
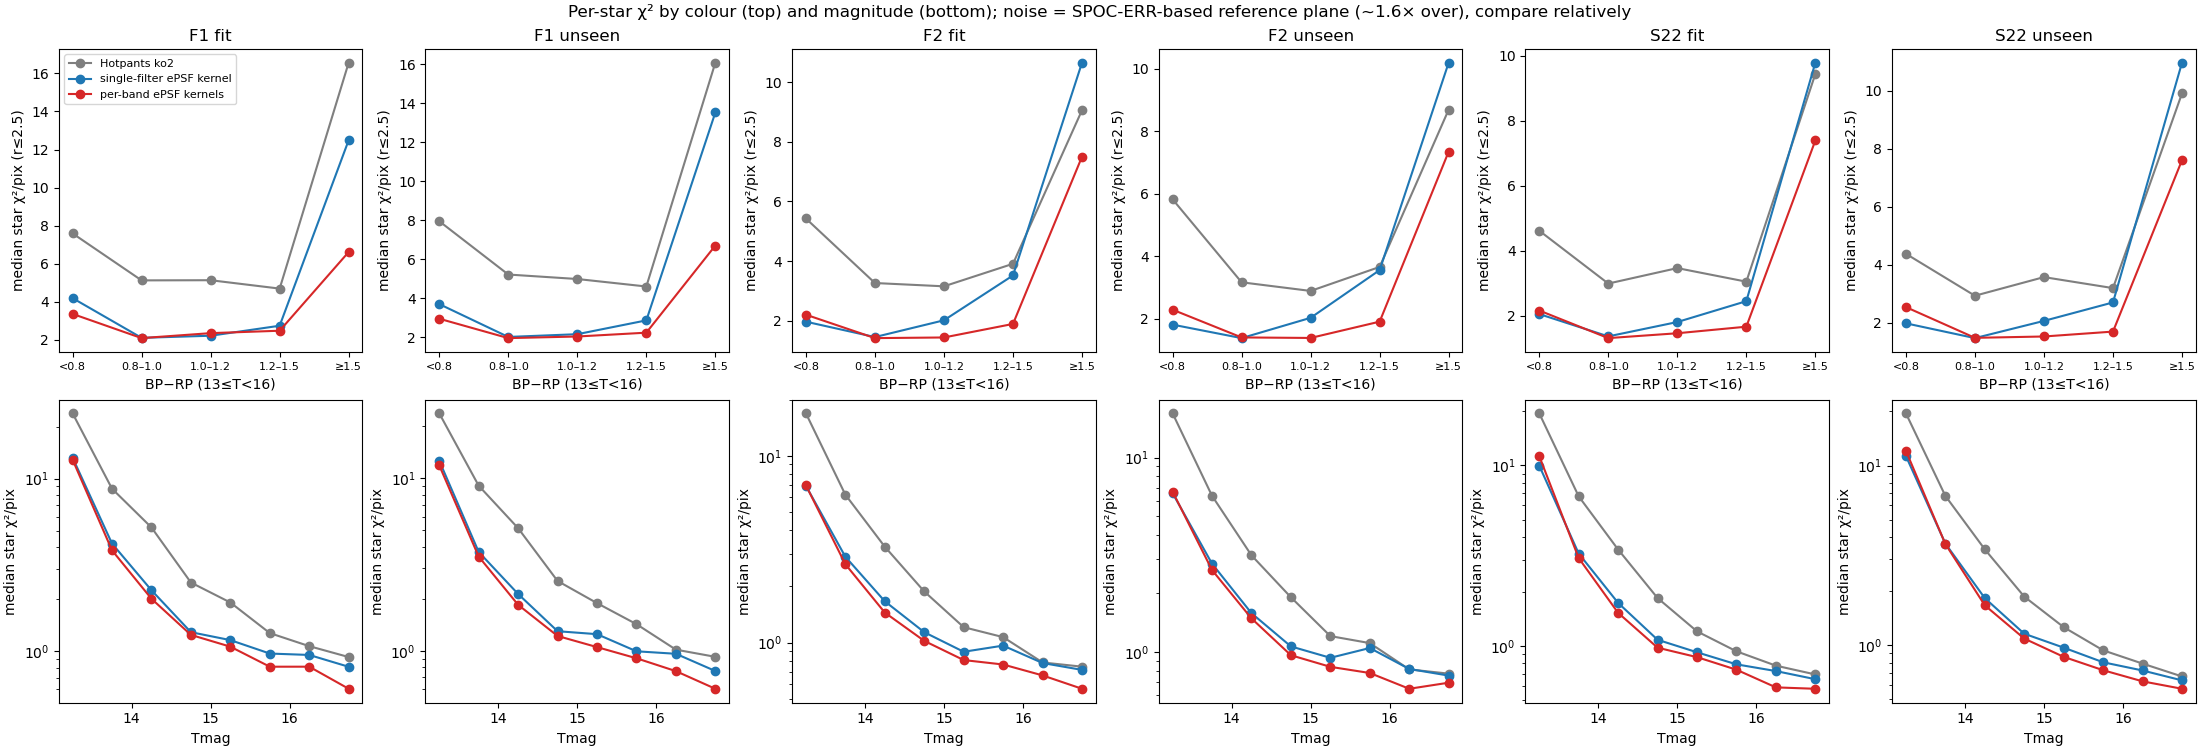
Grey Hotpants · blue single-filter ePSF · red per-band ePSF · 13 ≤ T < 16
Core residual vs brightness: PS1-side onset
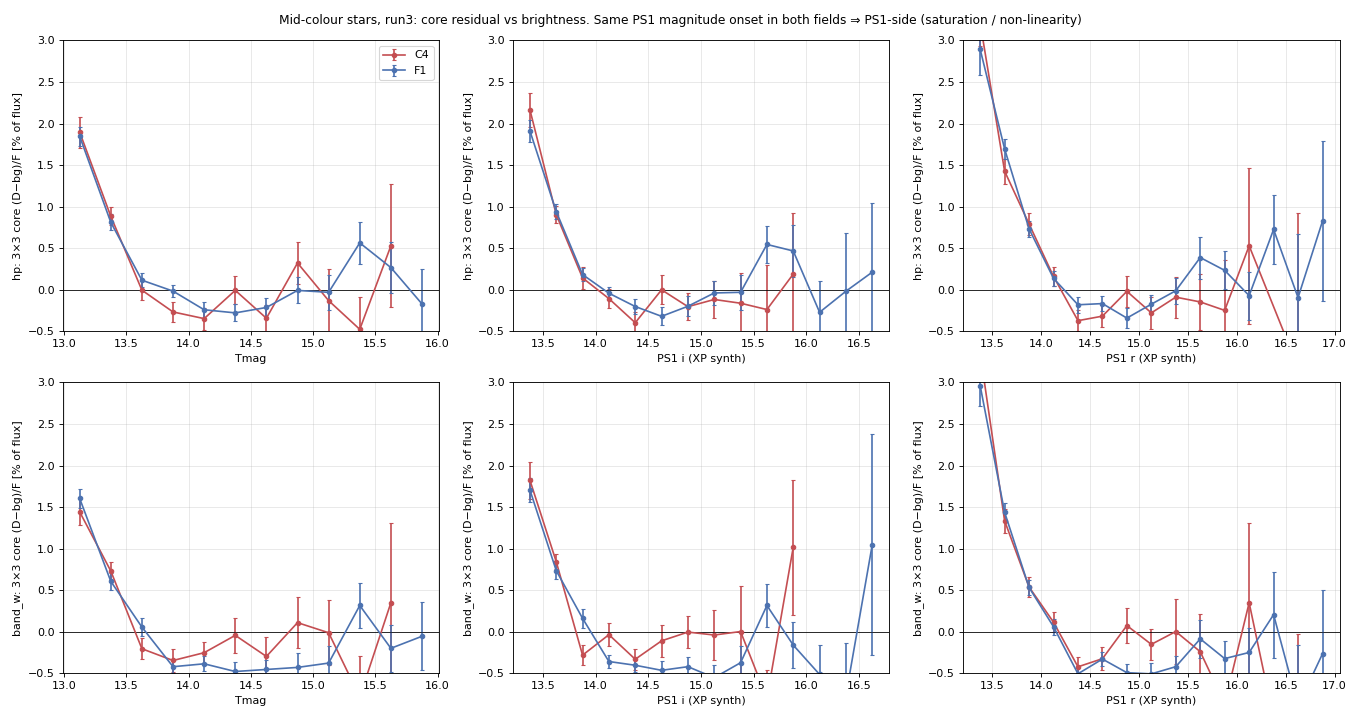
Top: hp core · bottom: band_w core · C4 red, F1 blue · ~+2% at T≈13.3, ~0 by T≈14
PS1 saturation: near-saturation band starts at T≈13
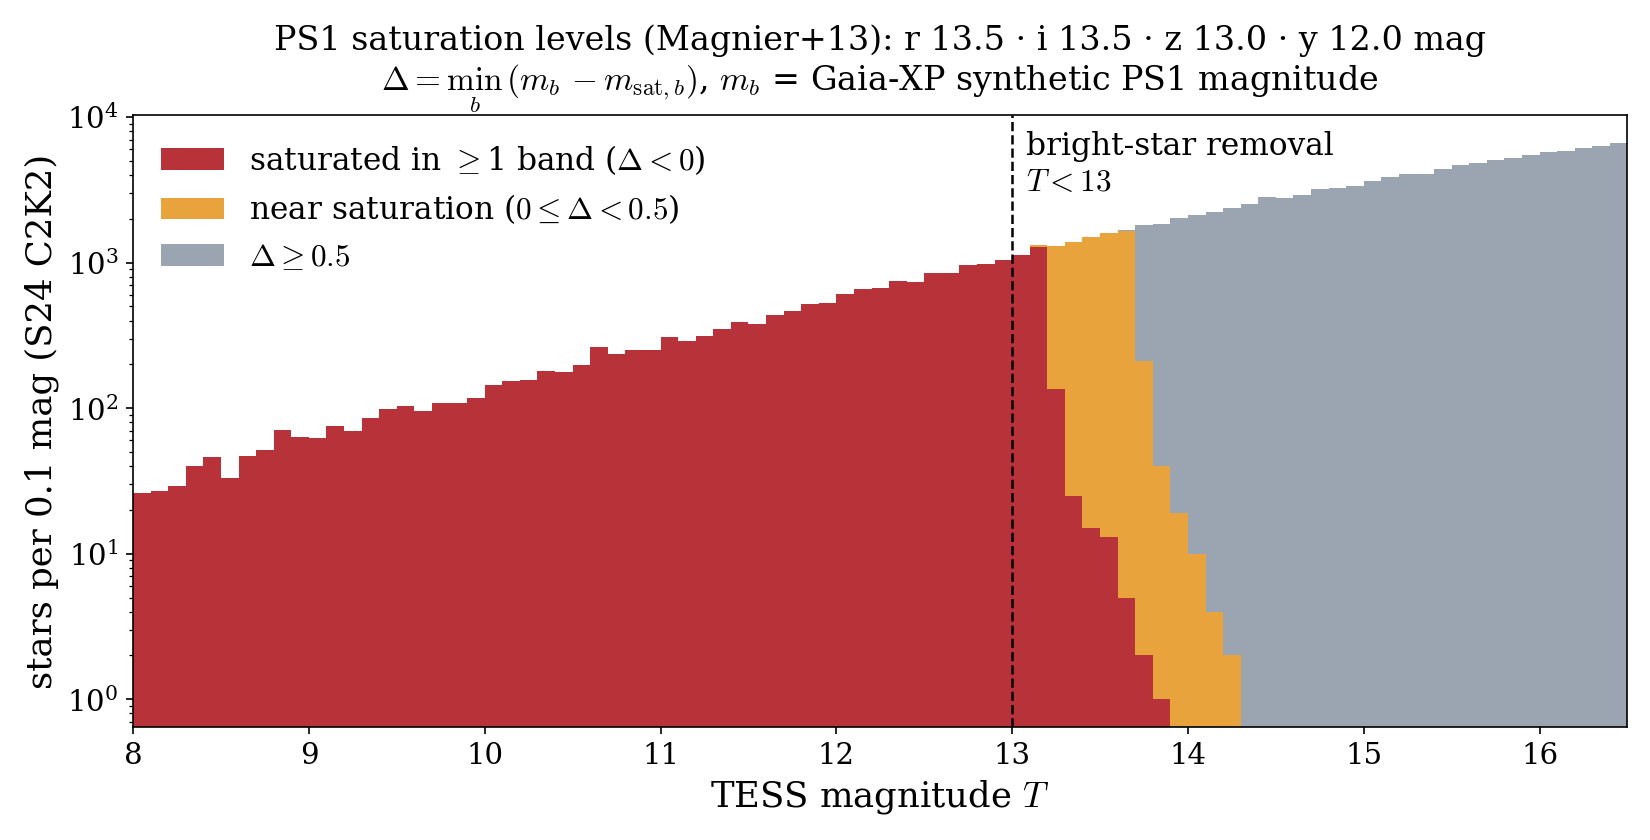
PS1 saturation (Magnier+13): r 13.5 · i 13.5 · z 13.0 · y 12.0 · Δ = min over bands of (m − m_sat) · S24 C2K2 · dashed line T = 13
PS1 offset over the full FFI: dx, dy, applied per kernel node
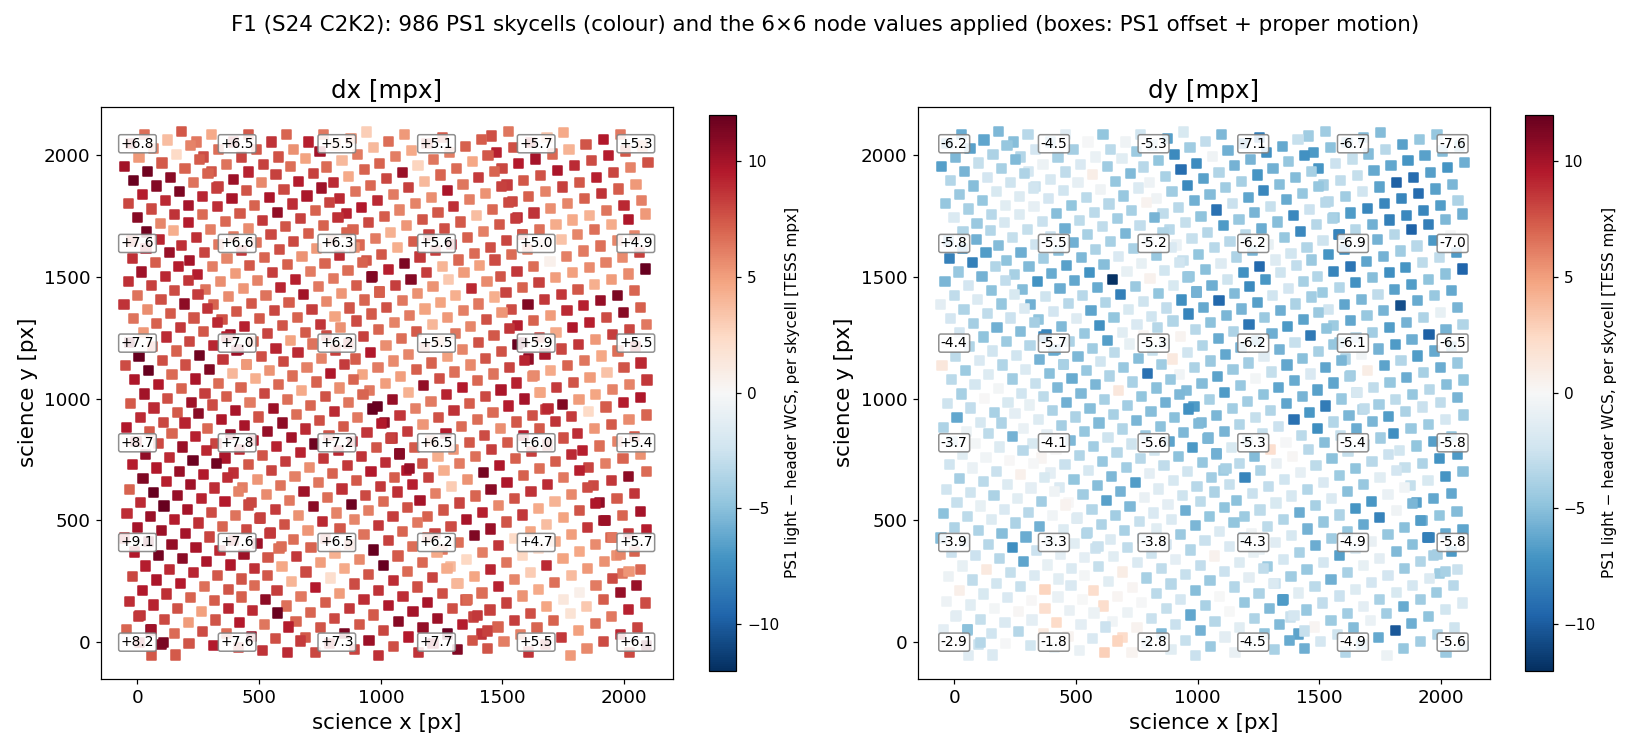
Measured per PS1 skycell (colour): dx ≈ +7.6, dy ≈ −3.9 mpx median, all 986 cells
Applied per kernel node (boxes): 6×6 nodes, dx +4.7 to +9.1, dy −1.8 to −7.6 mpx
Not one shift per FFI, and not per skycell or per star
F1 (S24 C2K2) · node value = hat-weighted mean of nearby skycell offsets + mean proper motion of 13.6 ≤ T < 16 stars · per-band kernels shifted by −t at each node
Dipole ~11 → ~4 mpx after correction; Hotpants ~1 mpx · fig21
PS1 WCS offset: 50–250 mas per skycell
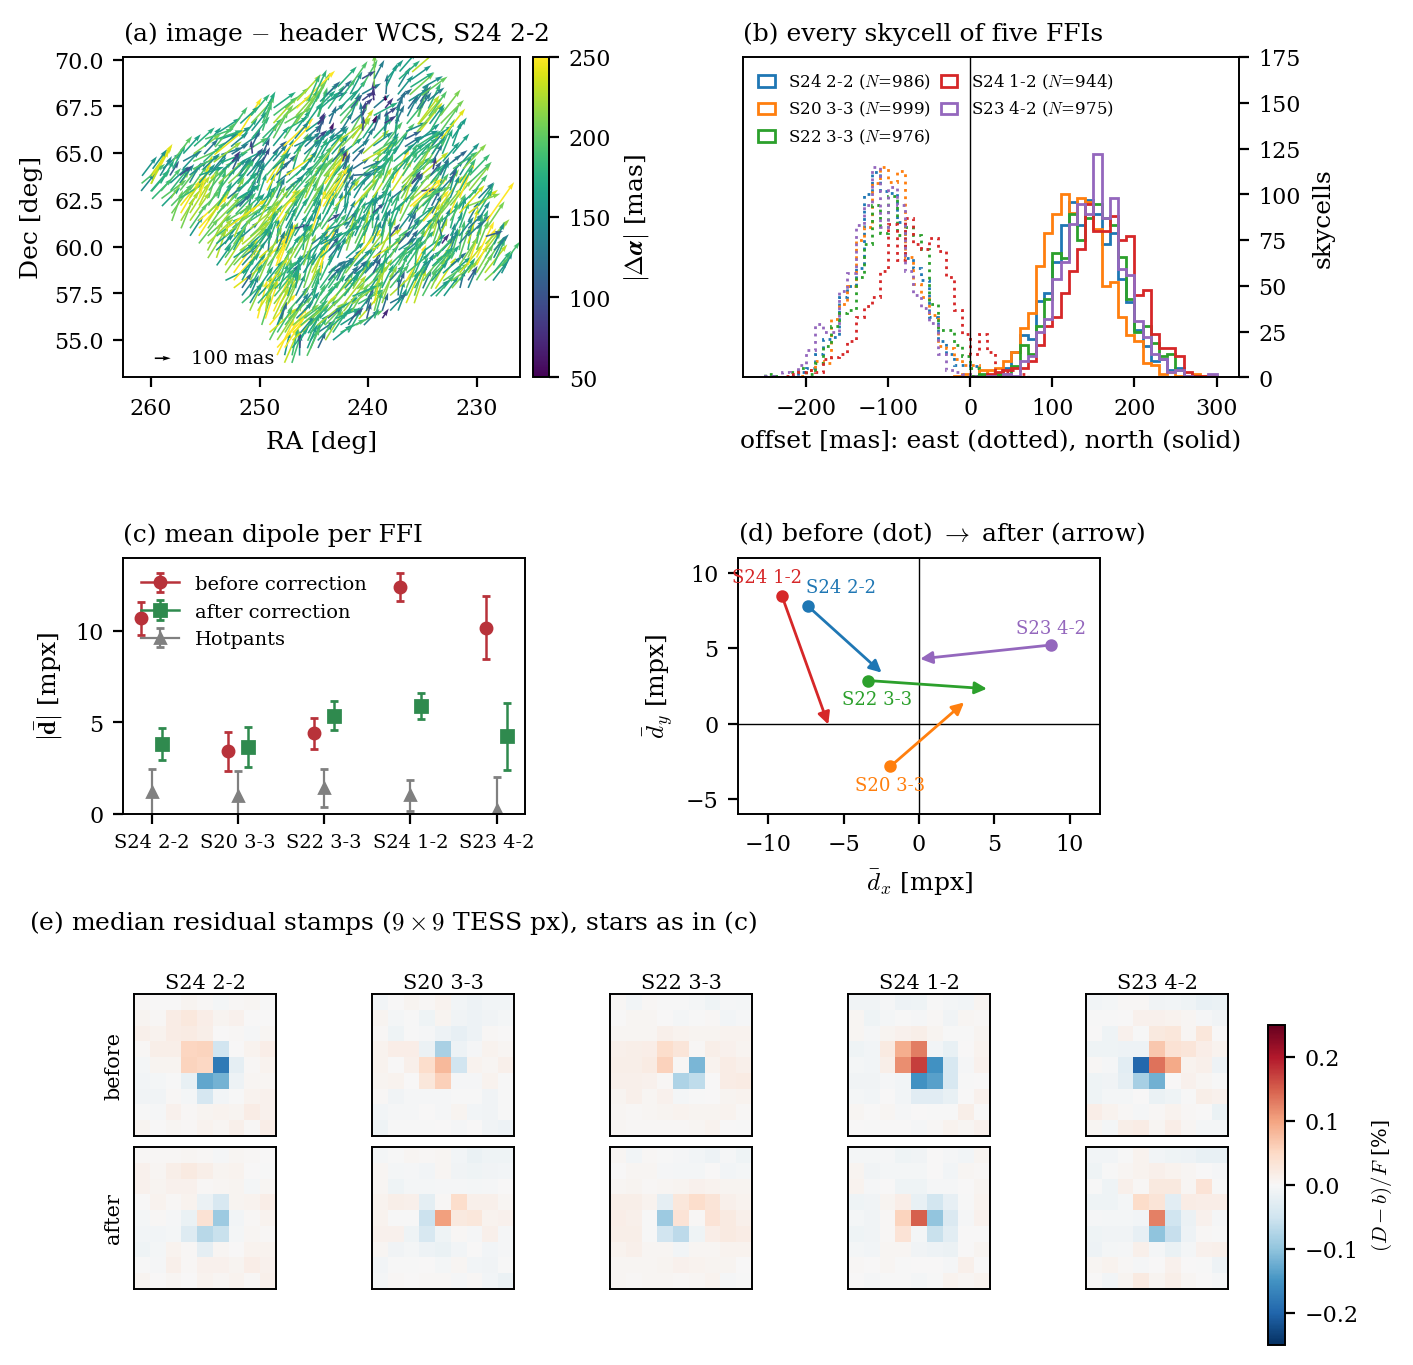
WCS offset correction: dipole by magnitude and colour
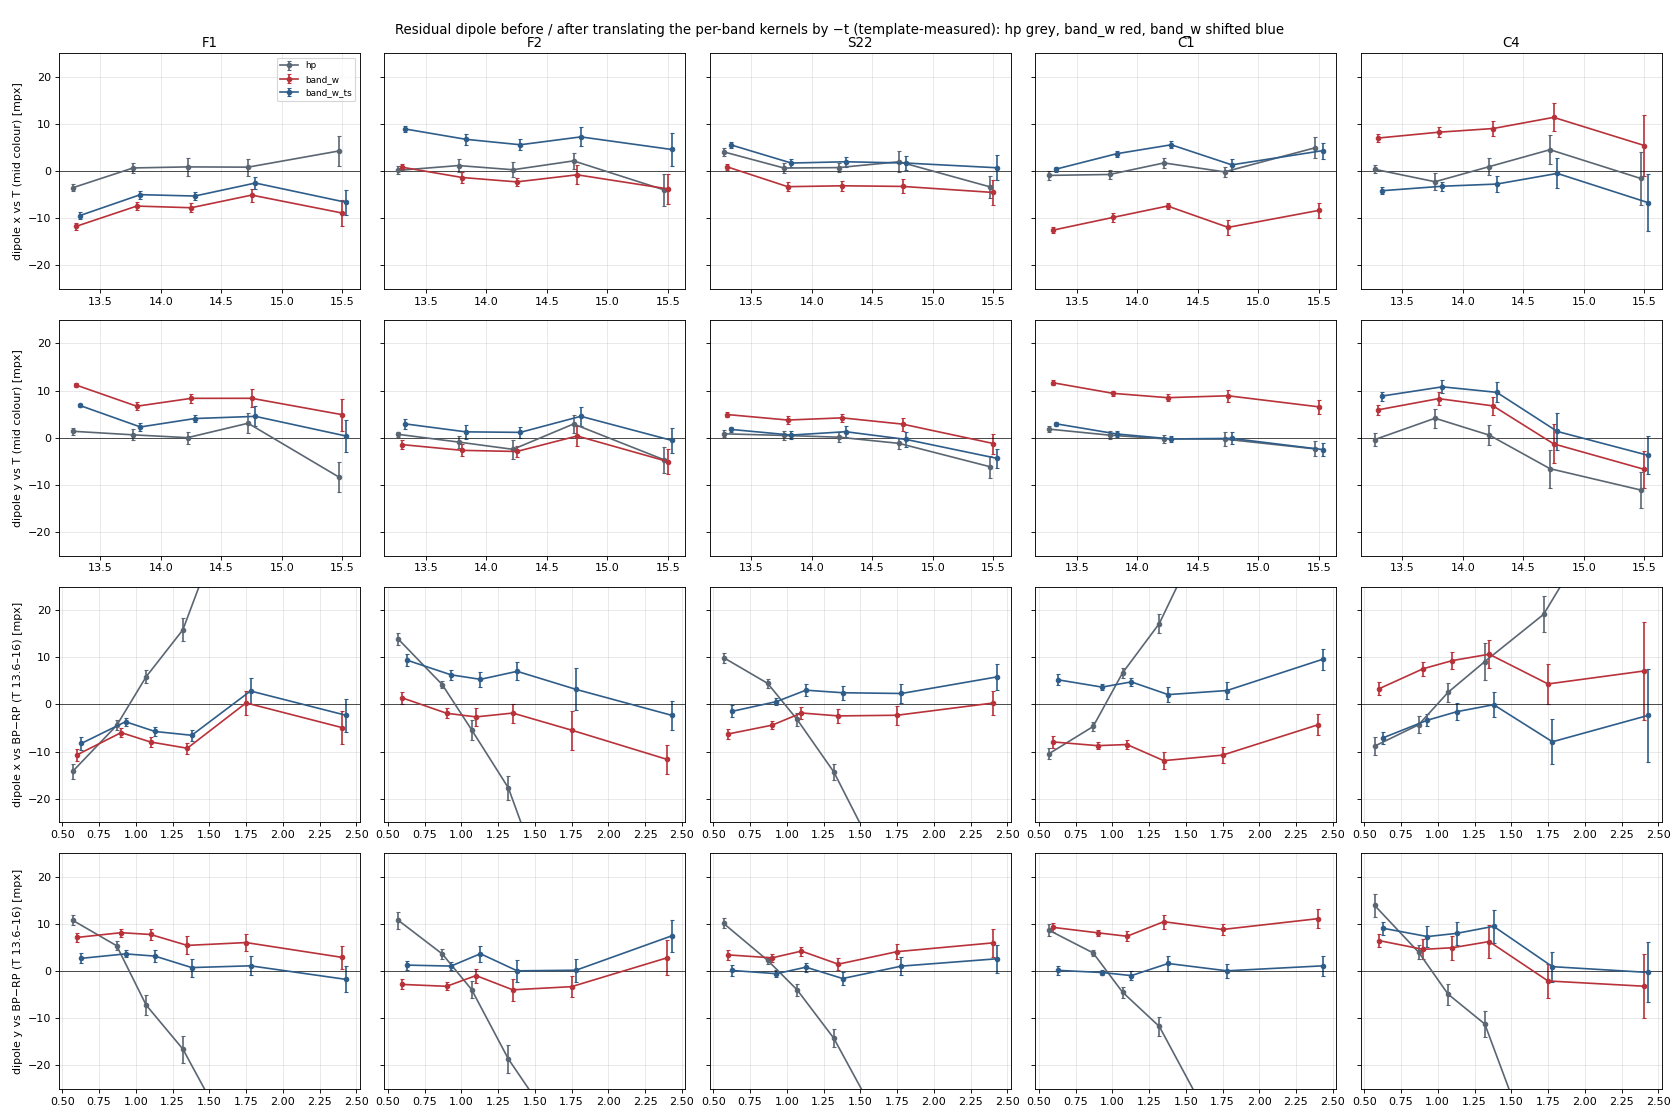
Hotpants (grey): dipole swings ±20 mpx with colour, ~0 with magnitude
Per-band (red): flat in colour, but a field offset of 5–12 mpx
Shifted (blue): F1, C1, C4 reduced to 4–6 mpx; F2, S22 overshoot by 4–5 mpx
Rows: dipole x, y vs T (mid colour) · dipole x, y vs BP−RP (T 13.6–16) · columns: five fields · mpx = milli-pixel
Rows: F1, F2, S22, C1, C4 · bandw_kernel_shift_20261009
WCS offset correction: stacked residual stamps
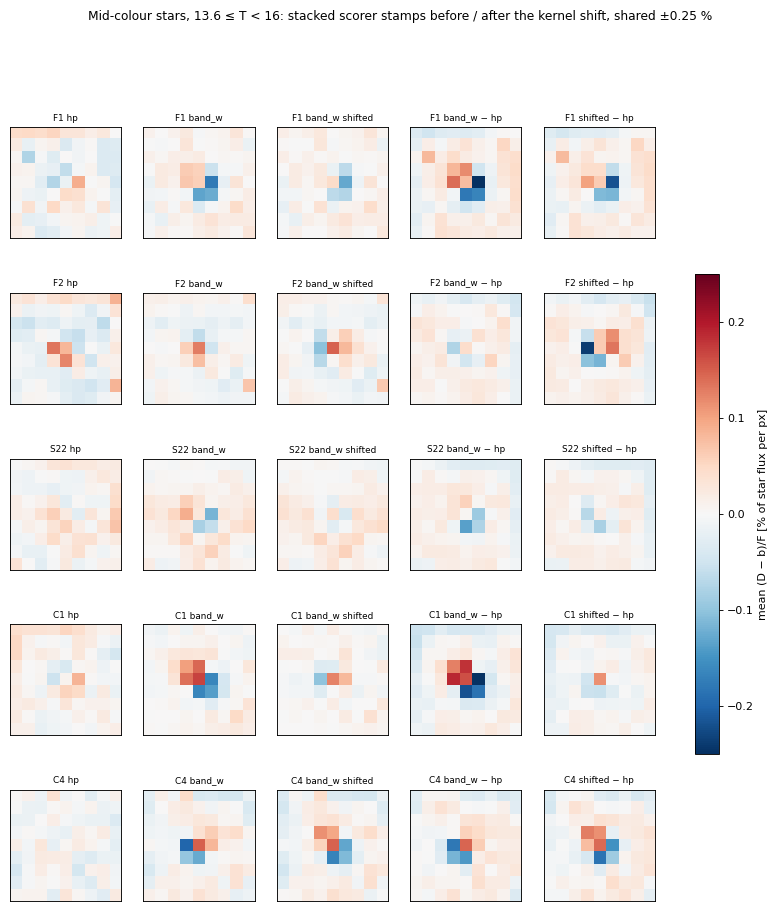
Columns: Hotpants · per-band · per-band shifted · per-band − Hotpants · shifted − Hotpants
Per-band shows a dipole (red above, blue below) that Hotpants does not
After the shift the dipole is weaker in F1 and C1, and changes sign in F2 and C4
Mid-colour stars, 13.6 ≤ T < 16, shared scale ±0.25 % of star flux per pixel
PS1 band mix vs TESS response
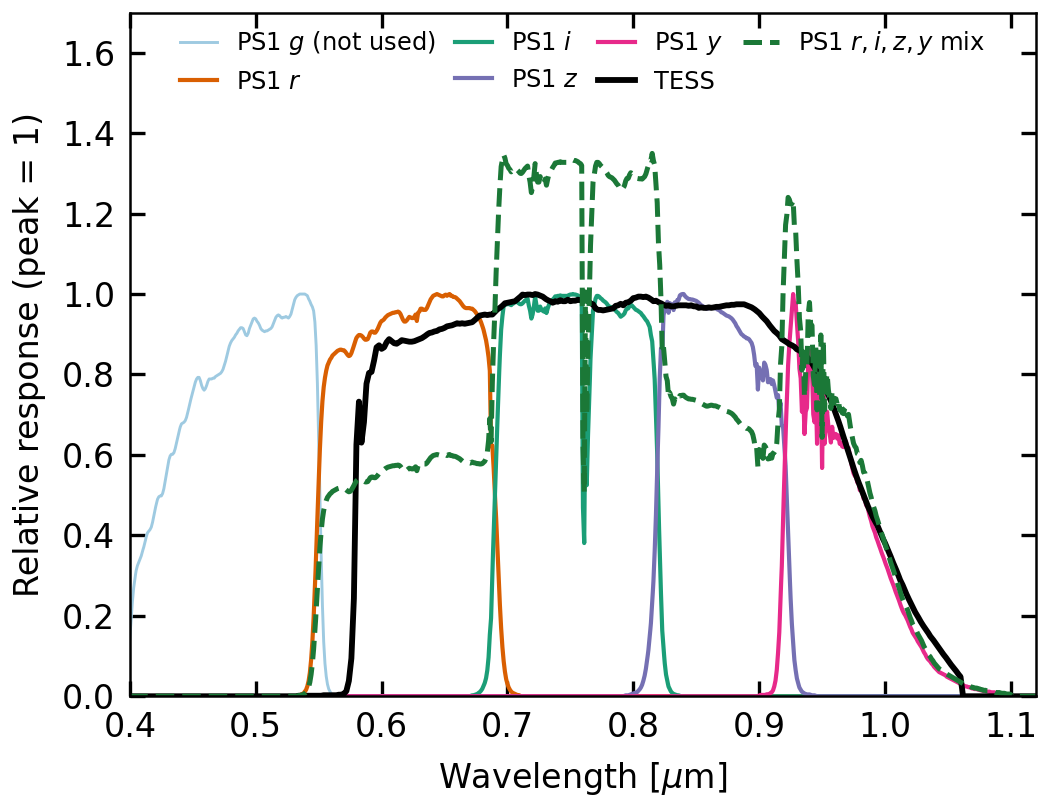
Dashed: PS1 r,i,z,y mix · black: TESS
The problem: the template is too bright for red stars
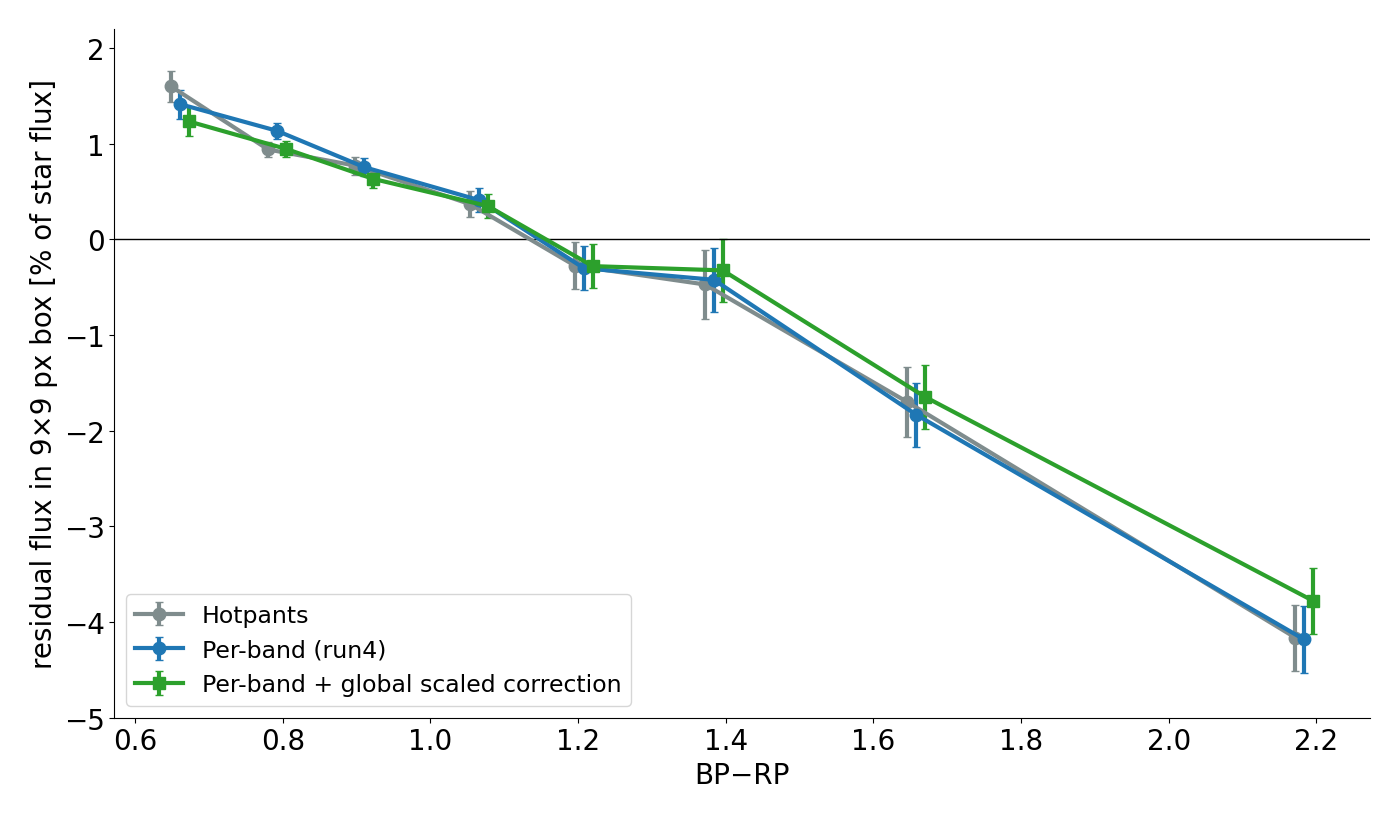
Red − blue in the 9×9 px box:
Hotpants −5.8 %
Per-band −5.6 %
+ scaled correction −5.0 %
(± 0.4 %)
Hotpants and per-band agree: same template, same band weights
A global per-band scaling recovers only ~0.6 %
Residual = Σ9×9 px(D − b) / F · b = median of the 6–10 px annulus · box = residual-grid stamp (±4.5 px) · 5 fields pooled, 13 ≤ T < 16, isolated · median per colour bin, last bin BP−RP ≥ 1.8 · negative = template too bright
The y wing: in the PS1 stack, and what the template keeps
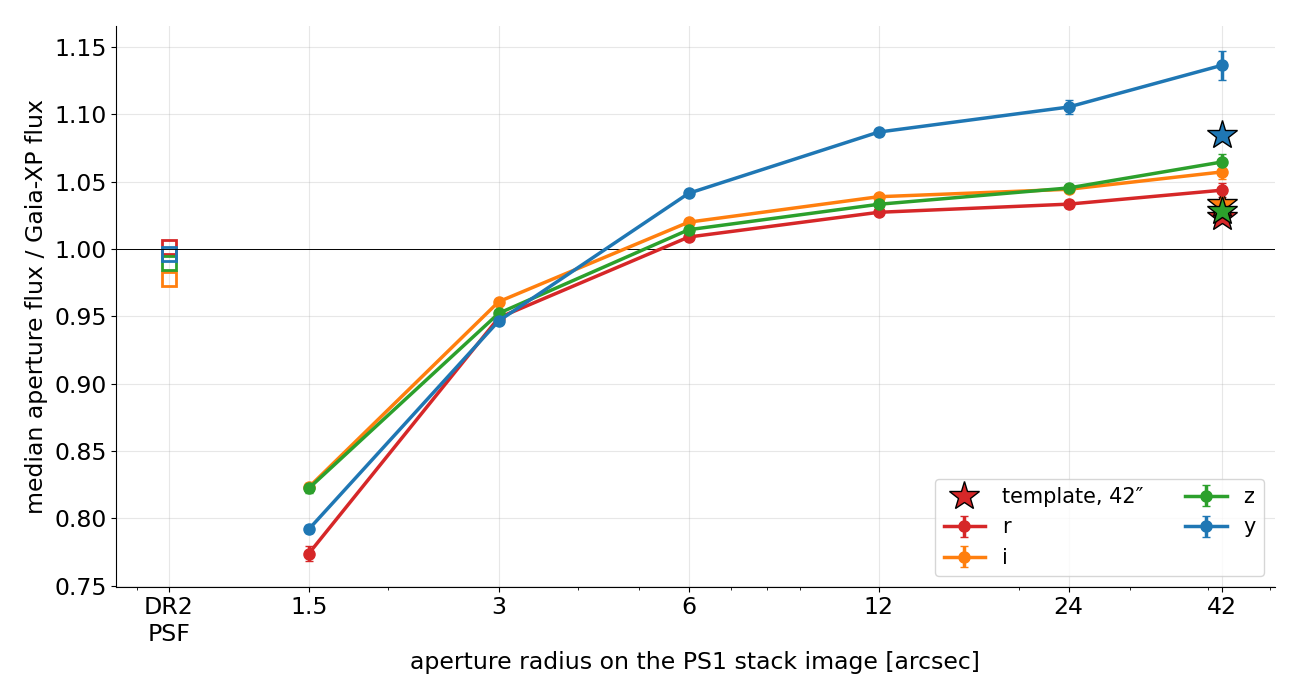
Stack: y/(riz) grows with radius, +2.6 % at 6″ to +6.3 % at 42″
Catalogue mags miss it: PSF-fit magnitudes (□) agree with XP within 0.6 % per band
Template (★): keeps part of the y wing, y +8.5 % vs r +2.4 % at 42″
F1 (S24 C2K2), mid-colour isolated stars, n = 139 · aperture photometry on the original PS1 stack images, sky 50–65″ · ps1_flux_chain
Zero-point change across the TESS CCD, r i z y
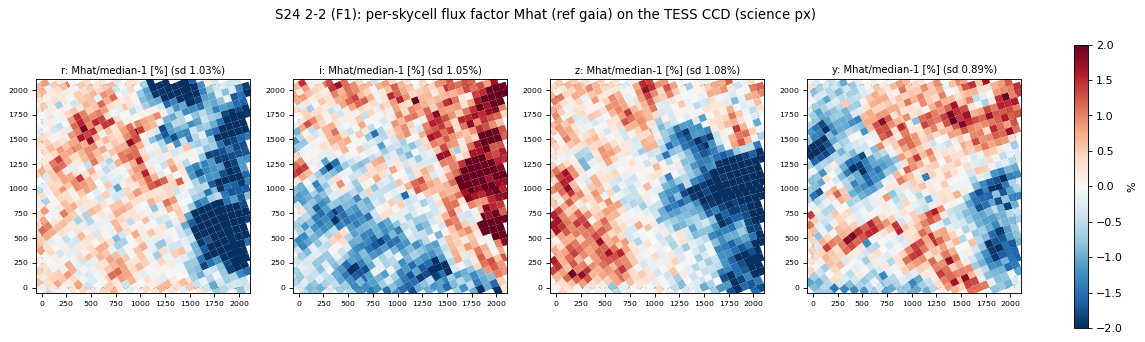
Coherent patches: ±2 % over hundreds of pixels, different in each band
One zero point per band is not enough: the map differs band to band
F1 (S24 C2K2) · shrunk factor M̂ per skycell, reference Gaia-XP · sd 1.03 / 1.05 / 1.08 / 0.89 % (r, i, z, y)
Zero point: raw, shrunk, and the error of each cell
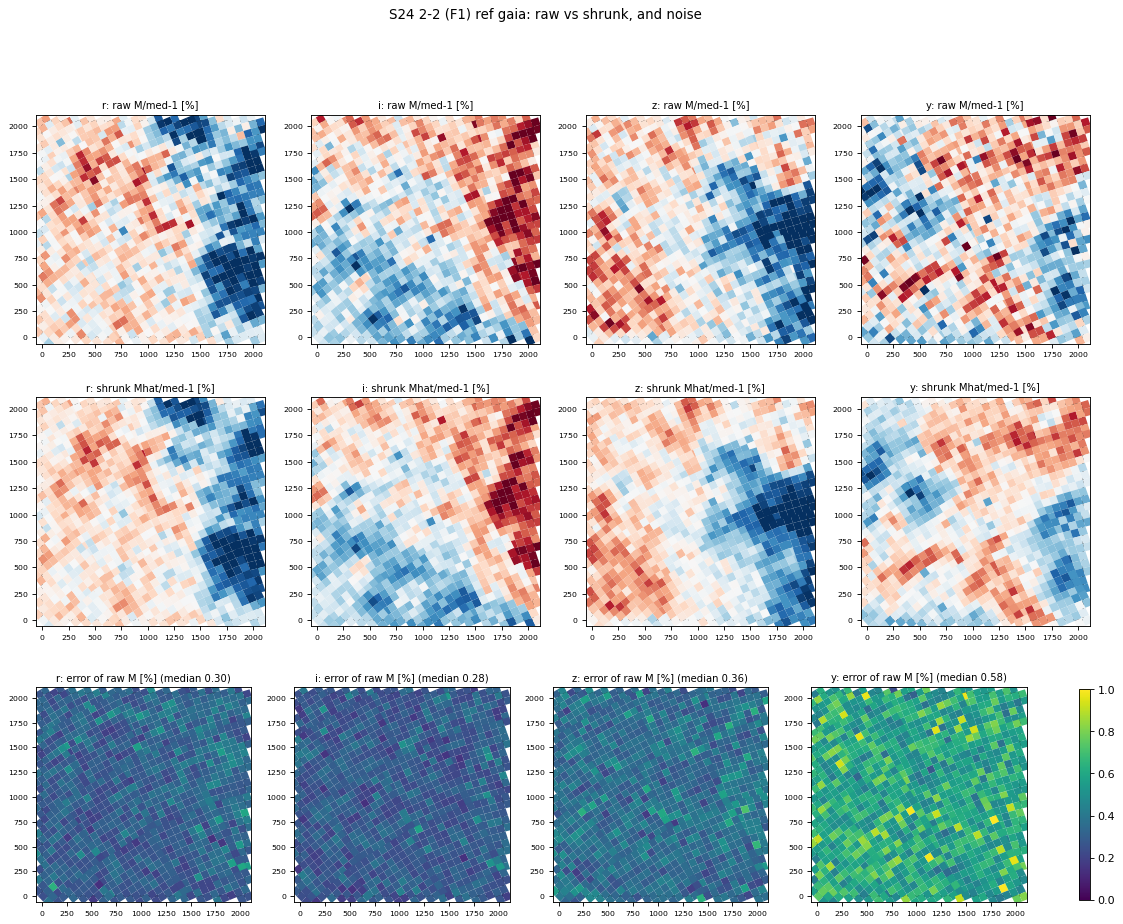
Top: raw median per cell, noisy at the cell level
Middle: shrunk toward neighbours; the large patches are unchanged
Bottom: error of the raw value, median 0.3 % (r, i, z) and 0.6 % (y)
The patches (±2 %) are several times larger than the per-cell error
F1 (S24 C2K2) · reference Gaia-XP · colour scale ±2 % (top, middle) and 0–1 % (bottom)
Adopted PS1 calibration: zero point per skycell
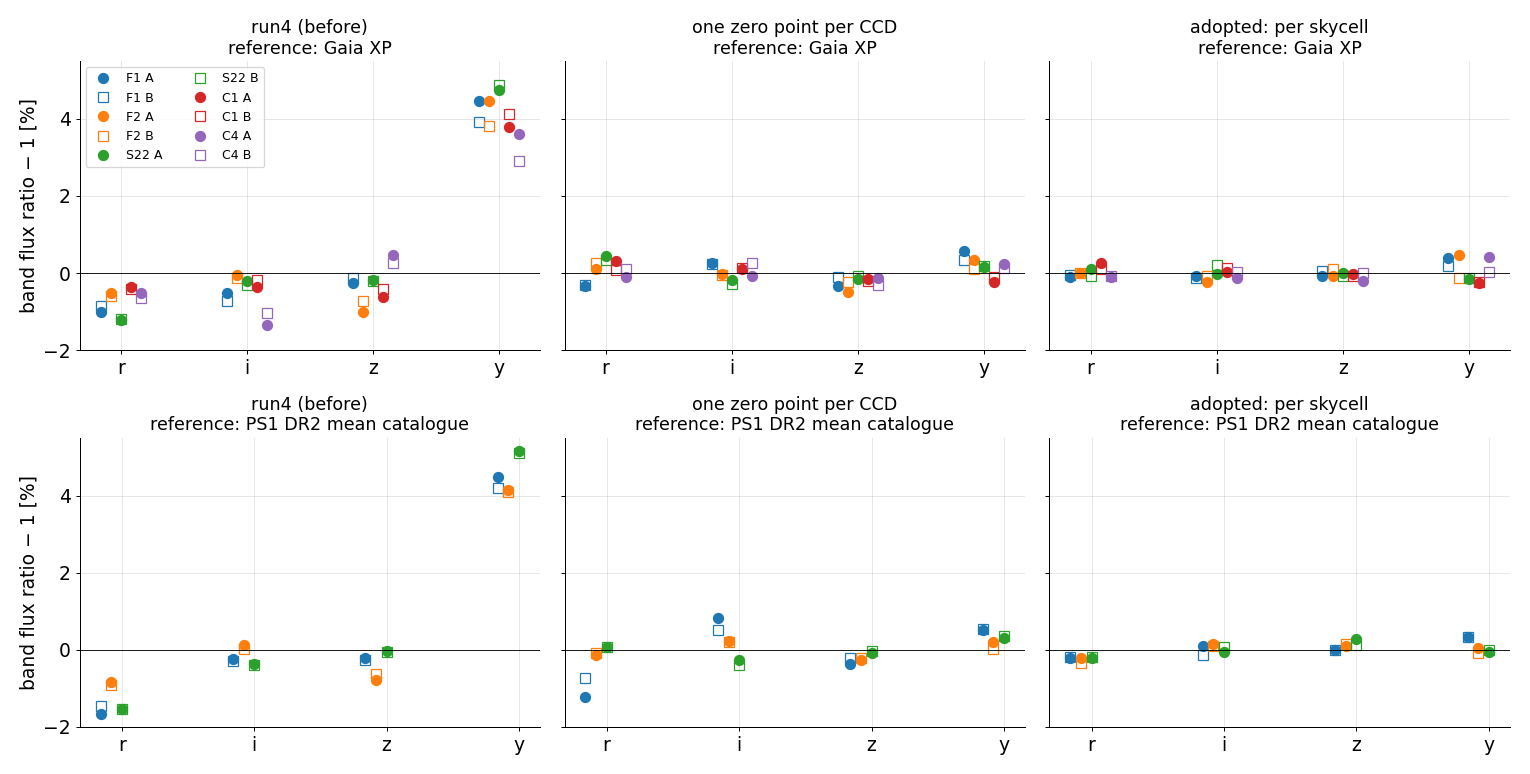
Before: y +3.4 to +5.1 %, r −0.4 to −1.6 %
Adopted: every band within about ±0.3 % (field medians)
Two references agree: Gaia XP and the PS1 catalogue
Red-star deficit: the calibration recovers only ~0.5 % of ~6 %
Per star: template flux in r ≤ 2 TESS px (bg 4–6 px) / (wb · reference flux), ÷ the star's median over r i z y · median of mid-colour stars (BP−RP 0.8–1.5), 13.6 ≤ T < 15.5 · ● ○ = two random halves · PS1 catalogue: F1, F2, S22 only
Final version: Hotpants vs per-band kernels (F1)
Hotpants, one kernel
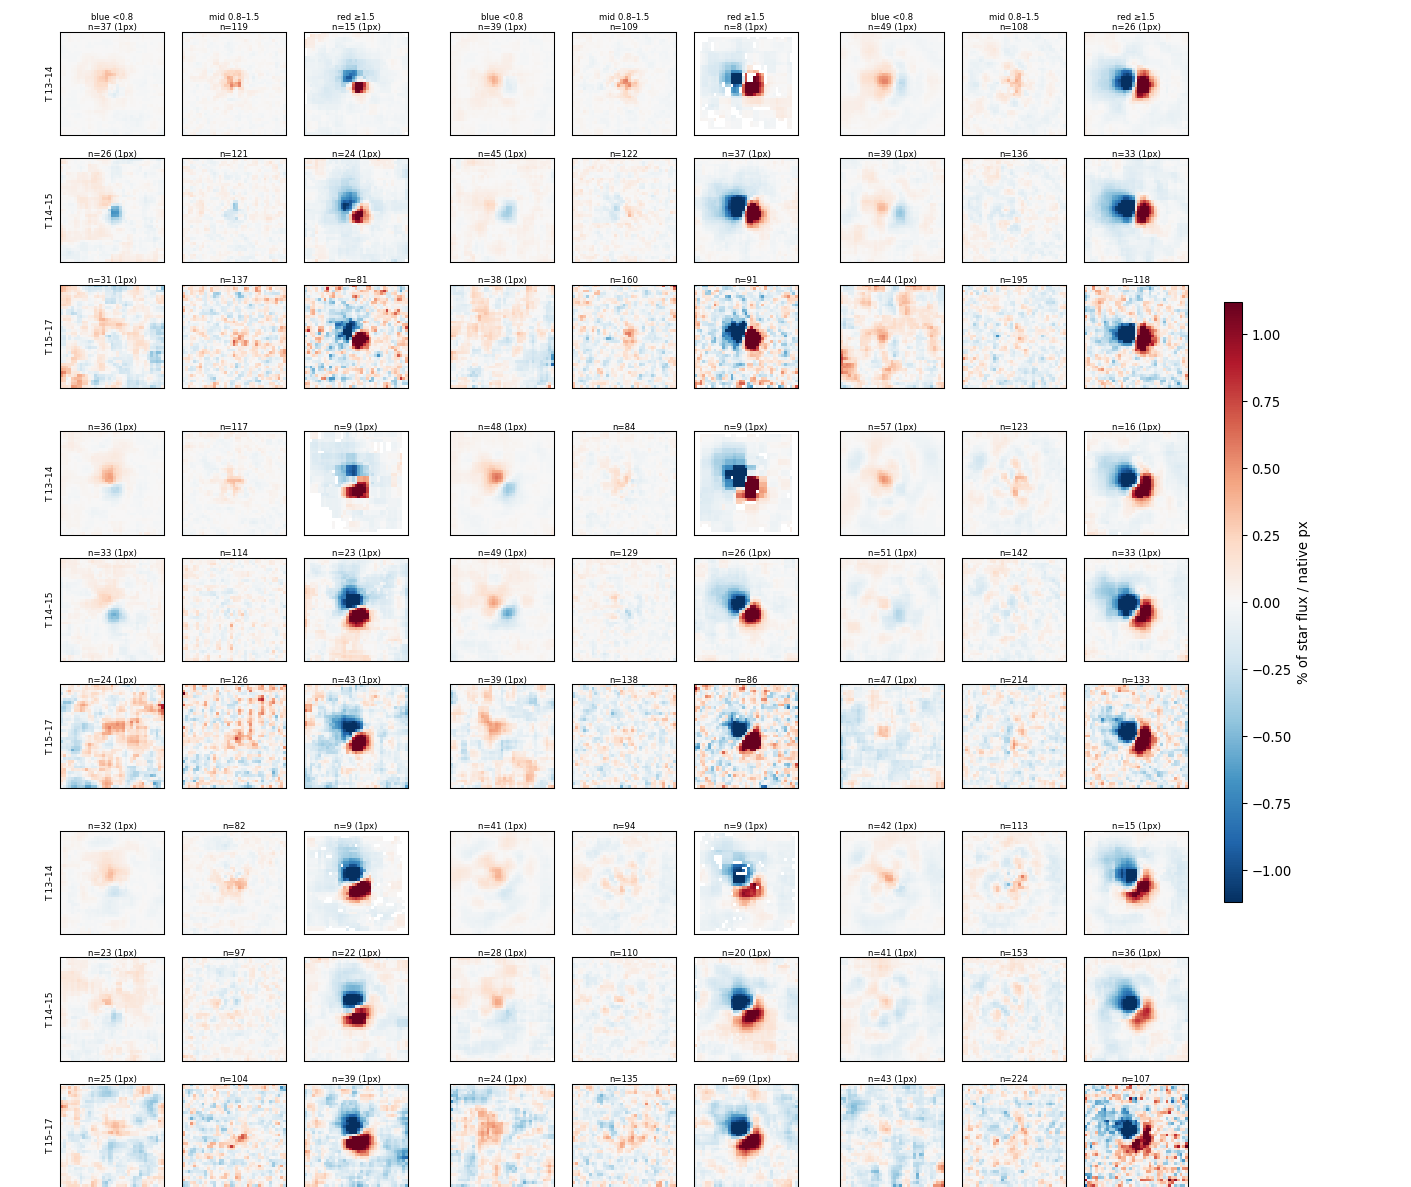
Per-band kernels, with WCS shift and PS1 calibration
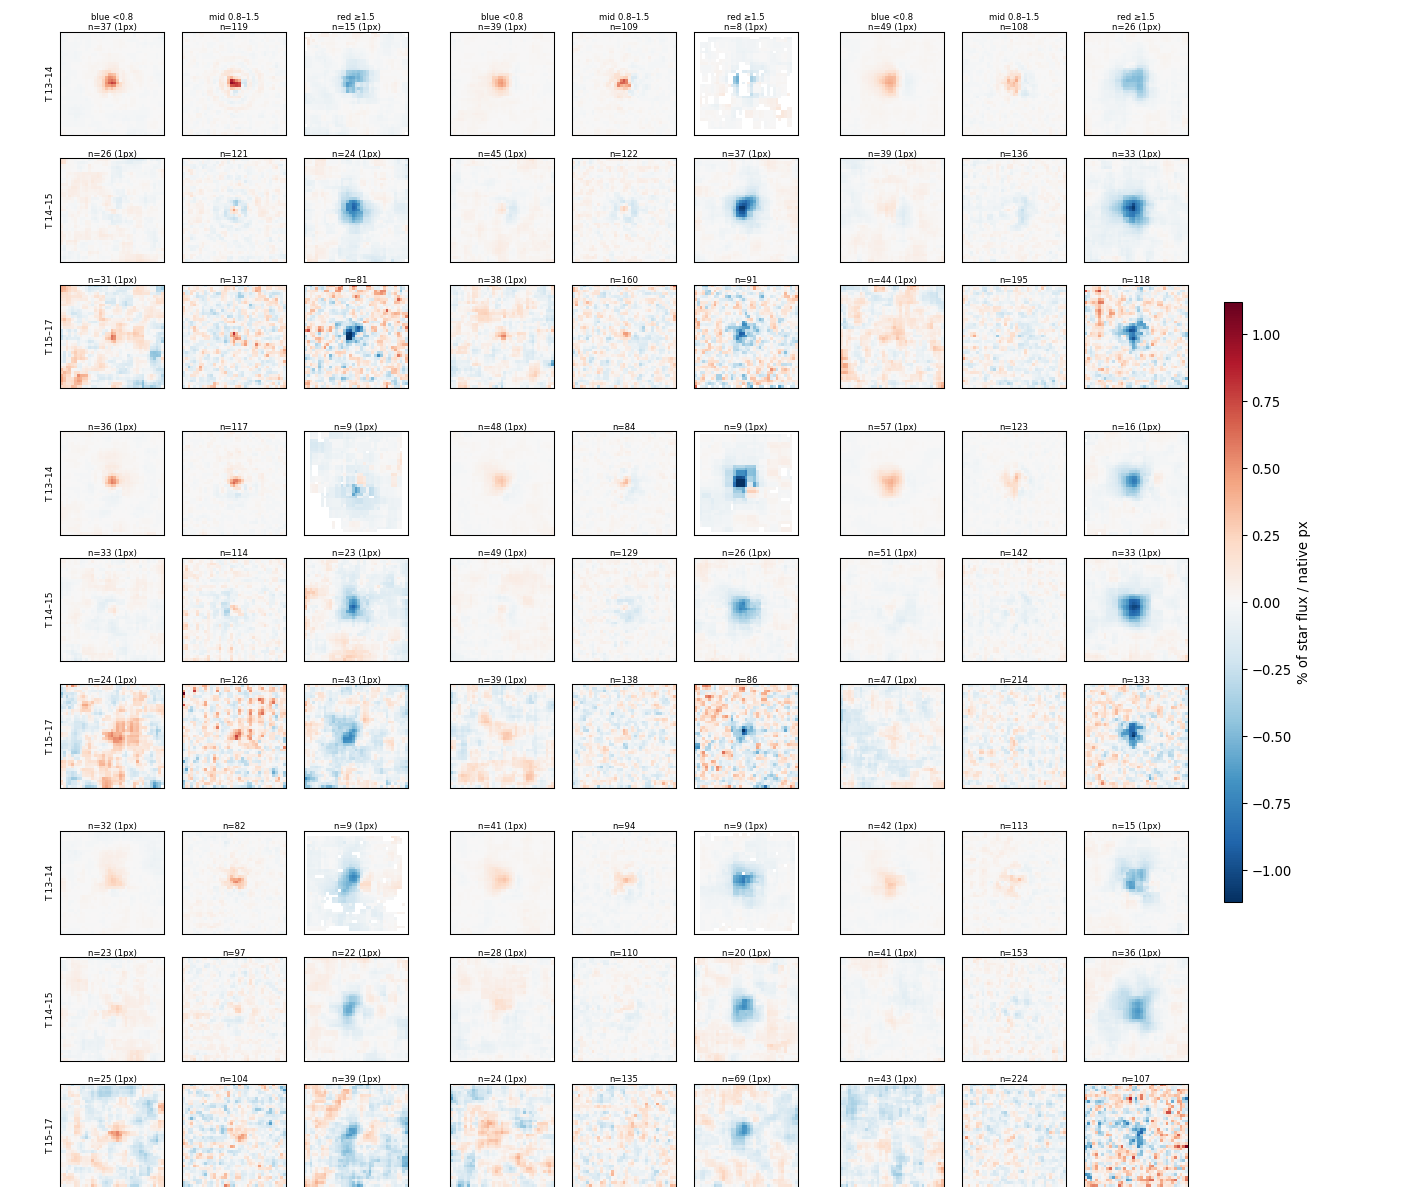
Final run (run5) · rows T 13–14, 14–15, 15–17 · columns blue, mid, red · 3×3 CCD grid · shared scale ±1.12 % per native px · 5674 stars
Per-band kernels: before vs after the WCS shift and PS1 calibration (F1)
Before: no WCS shift, no PS1 calibration
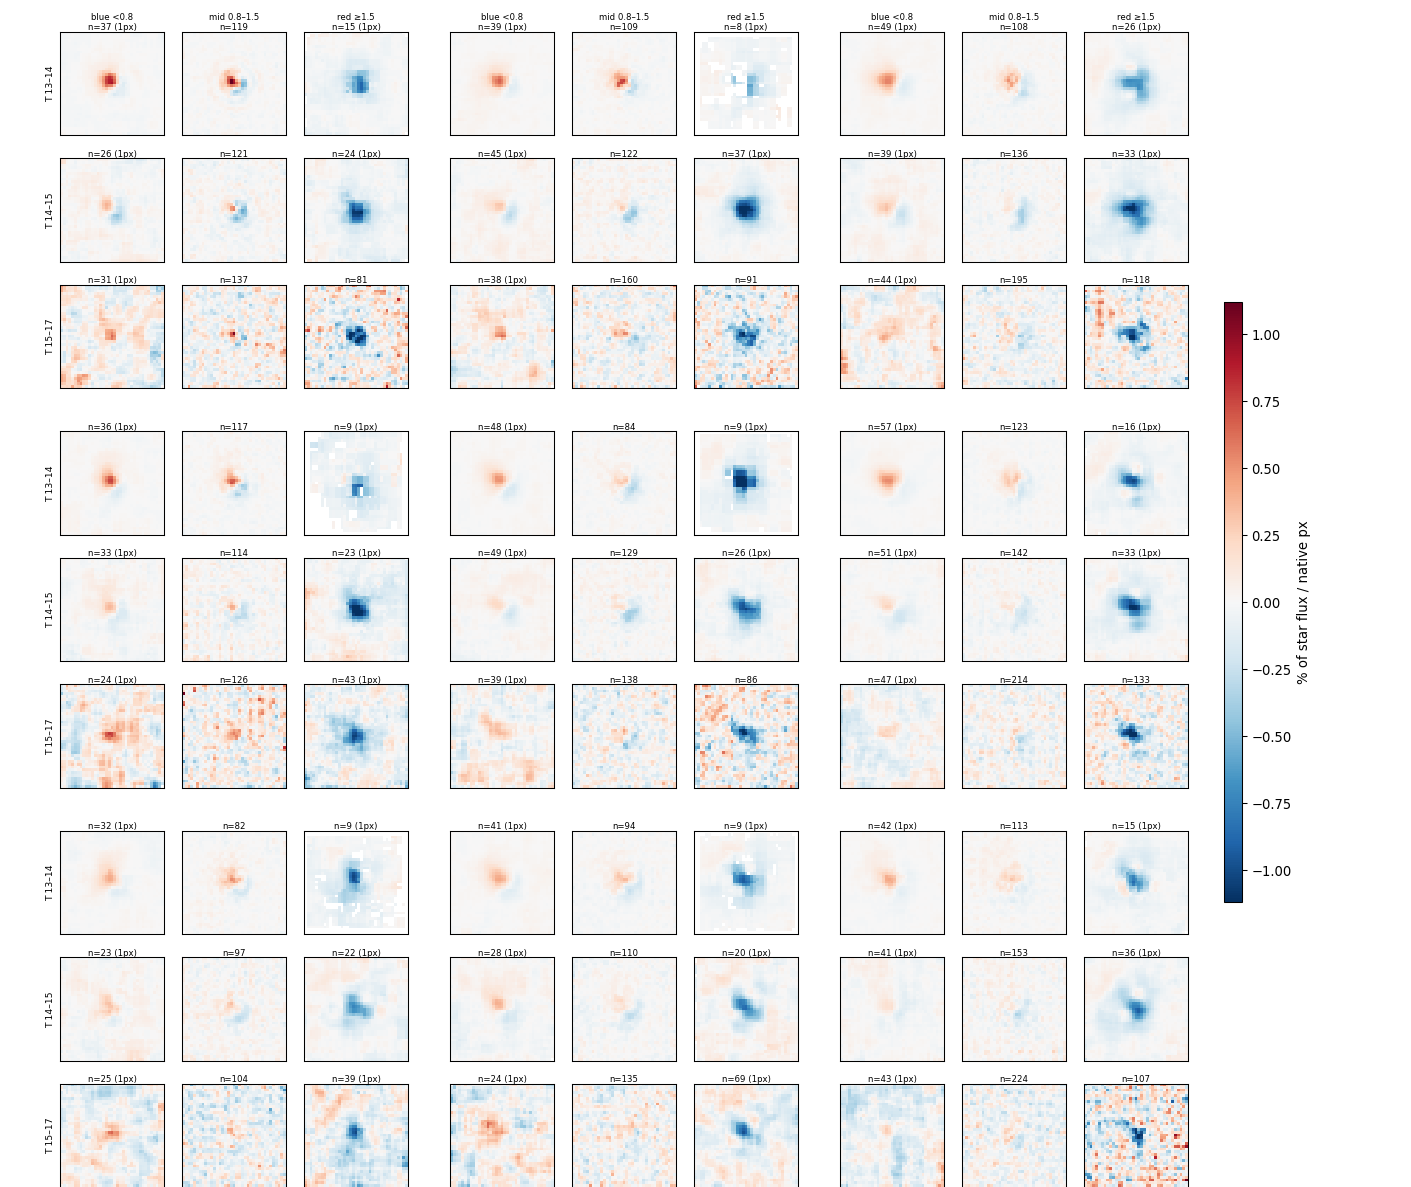
After: final run, with both
Same 5674 stars and ±1.12 % scale · rows T 13–14, 14–15, 15–17 · columns blue, mid, red · before = run3 on the final run's background; the ePSF recipe also differs
Trained vs held-out stars: the memorisation test
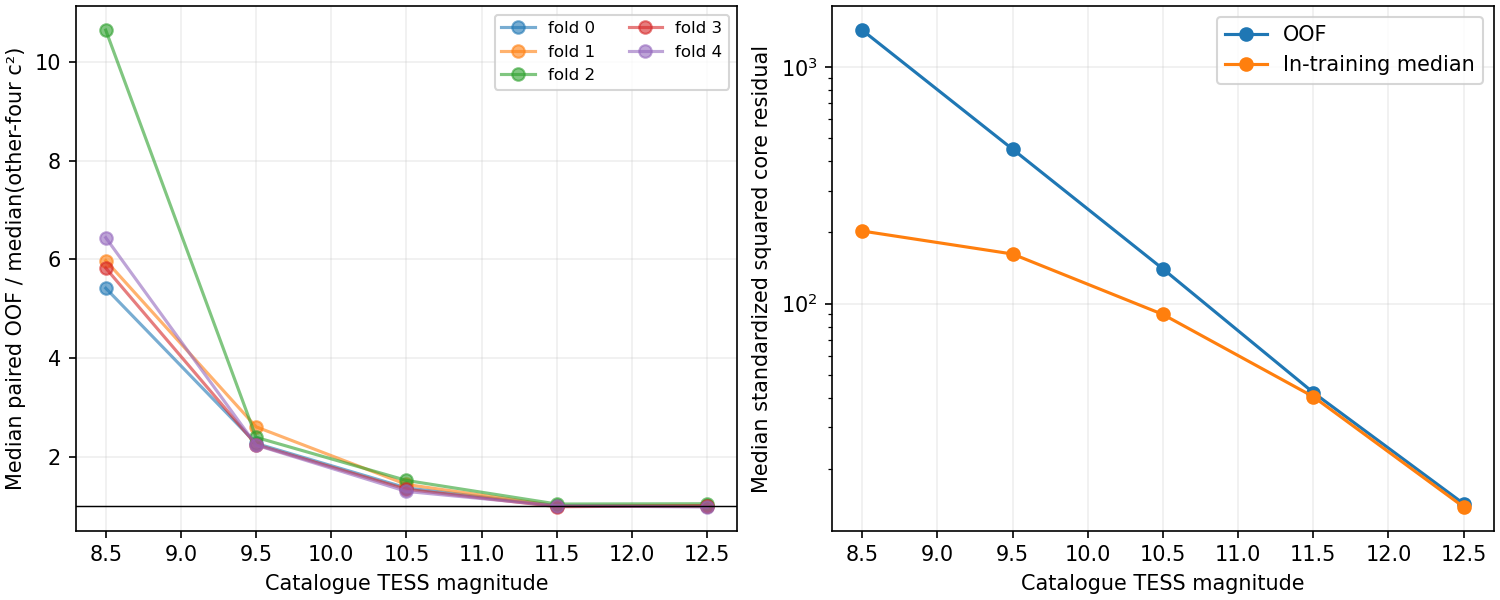
Trained: stars the ePSF was fitted on · held-out: stars withheld from that fit · ratio 1 = no memorisation
Held-out residual grid, final run (F1): colour × magnitude × CCD cell
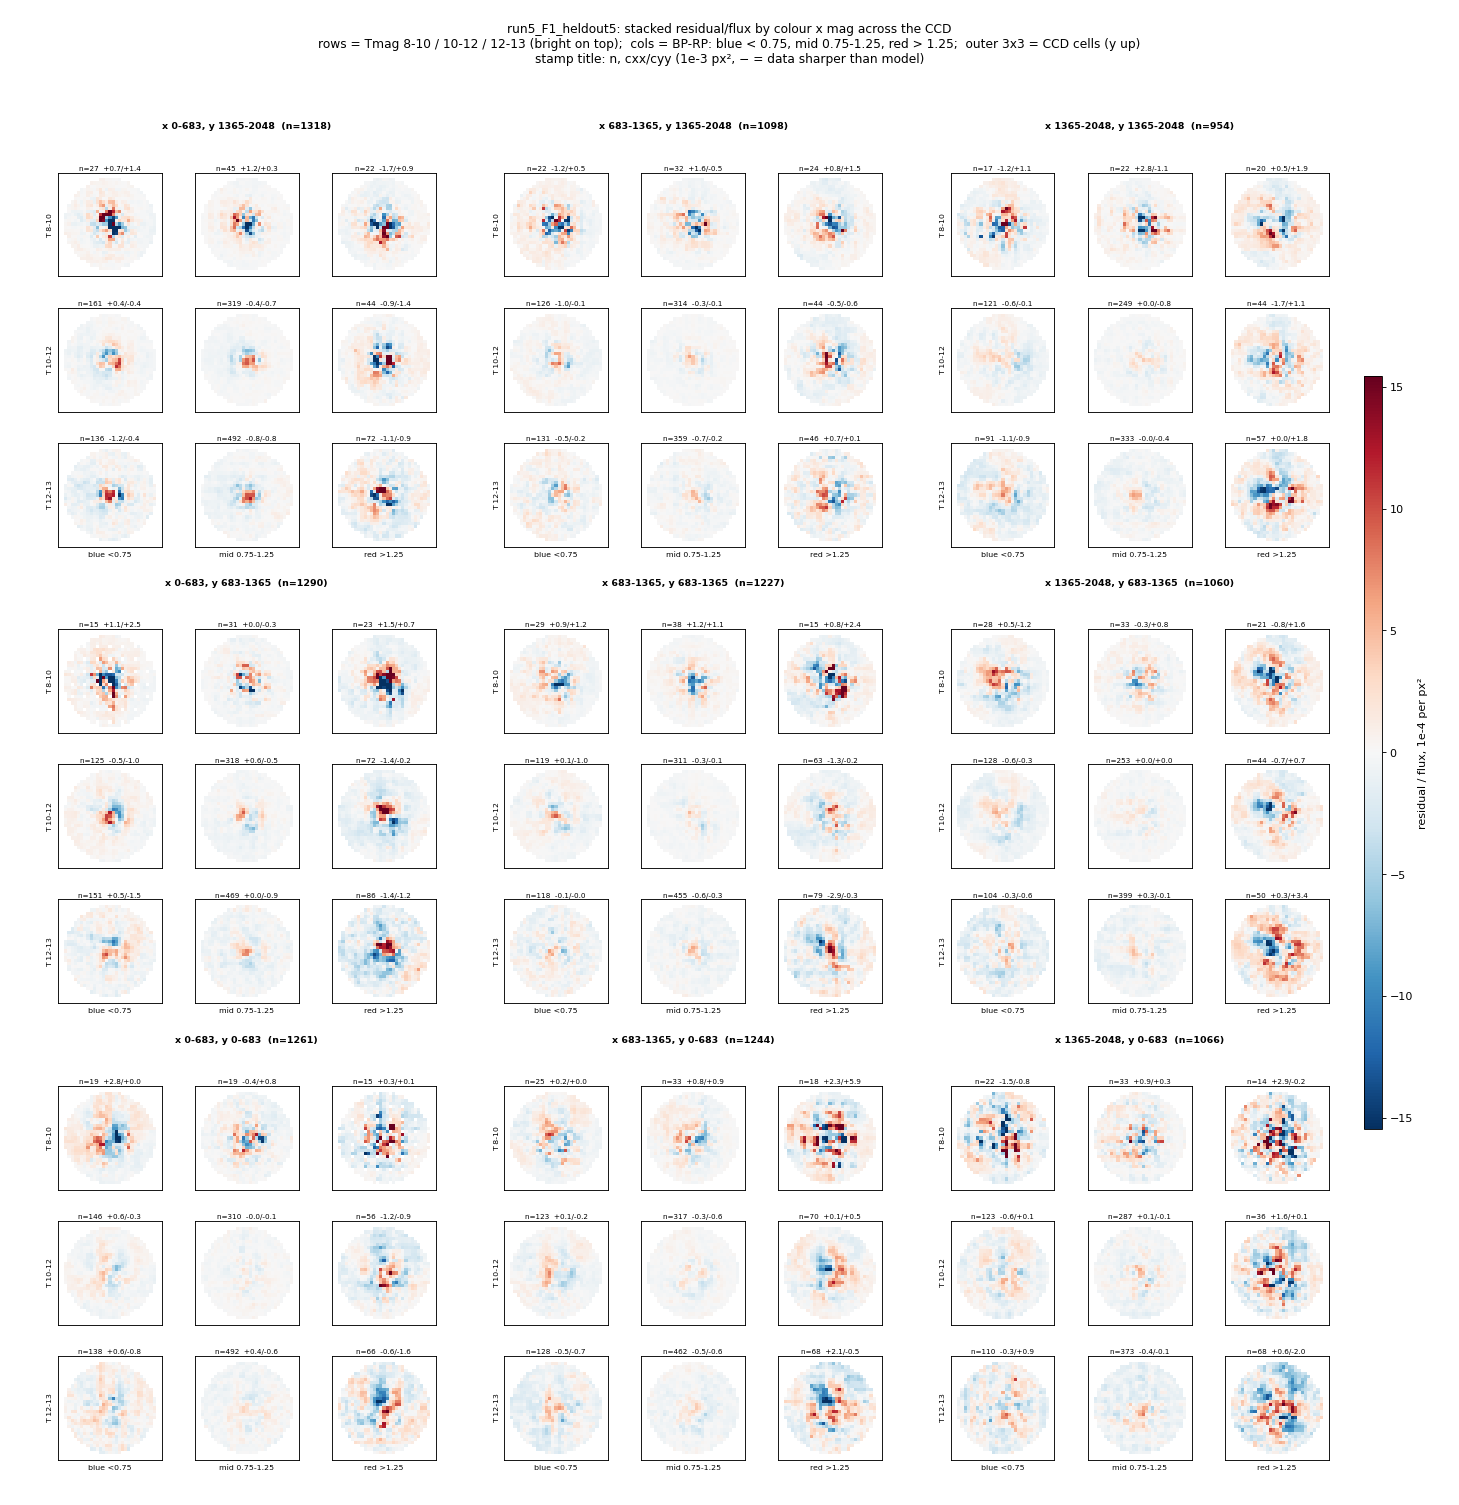
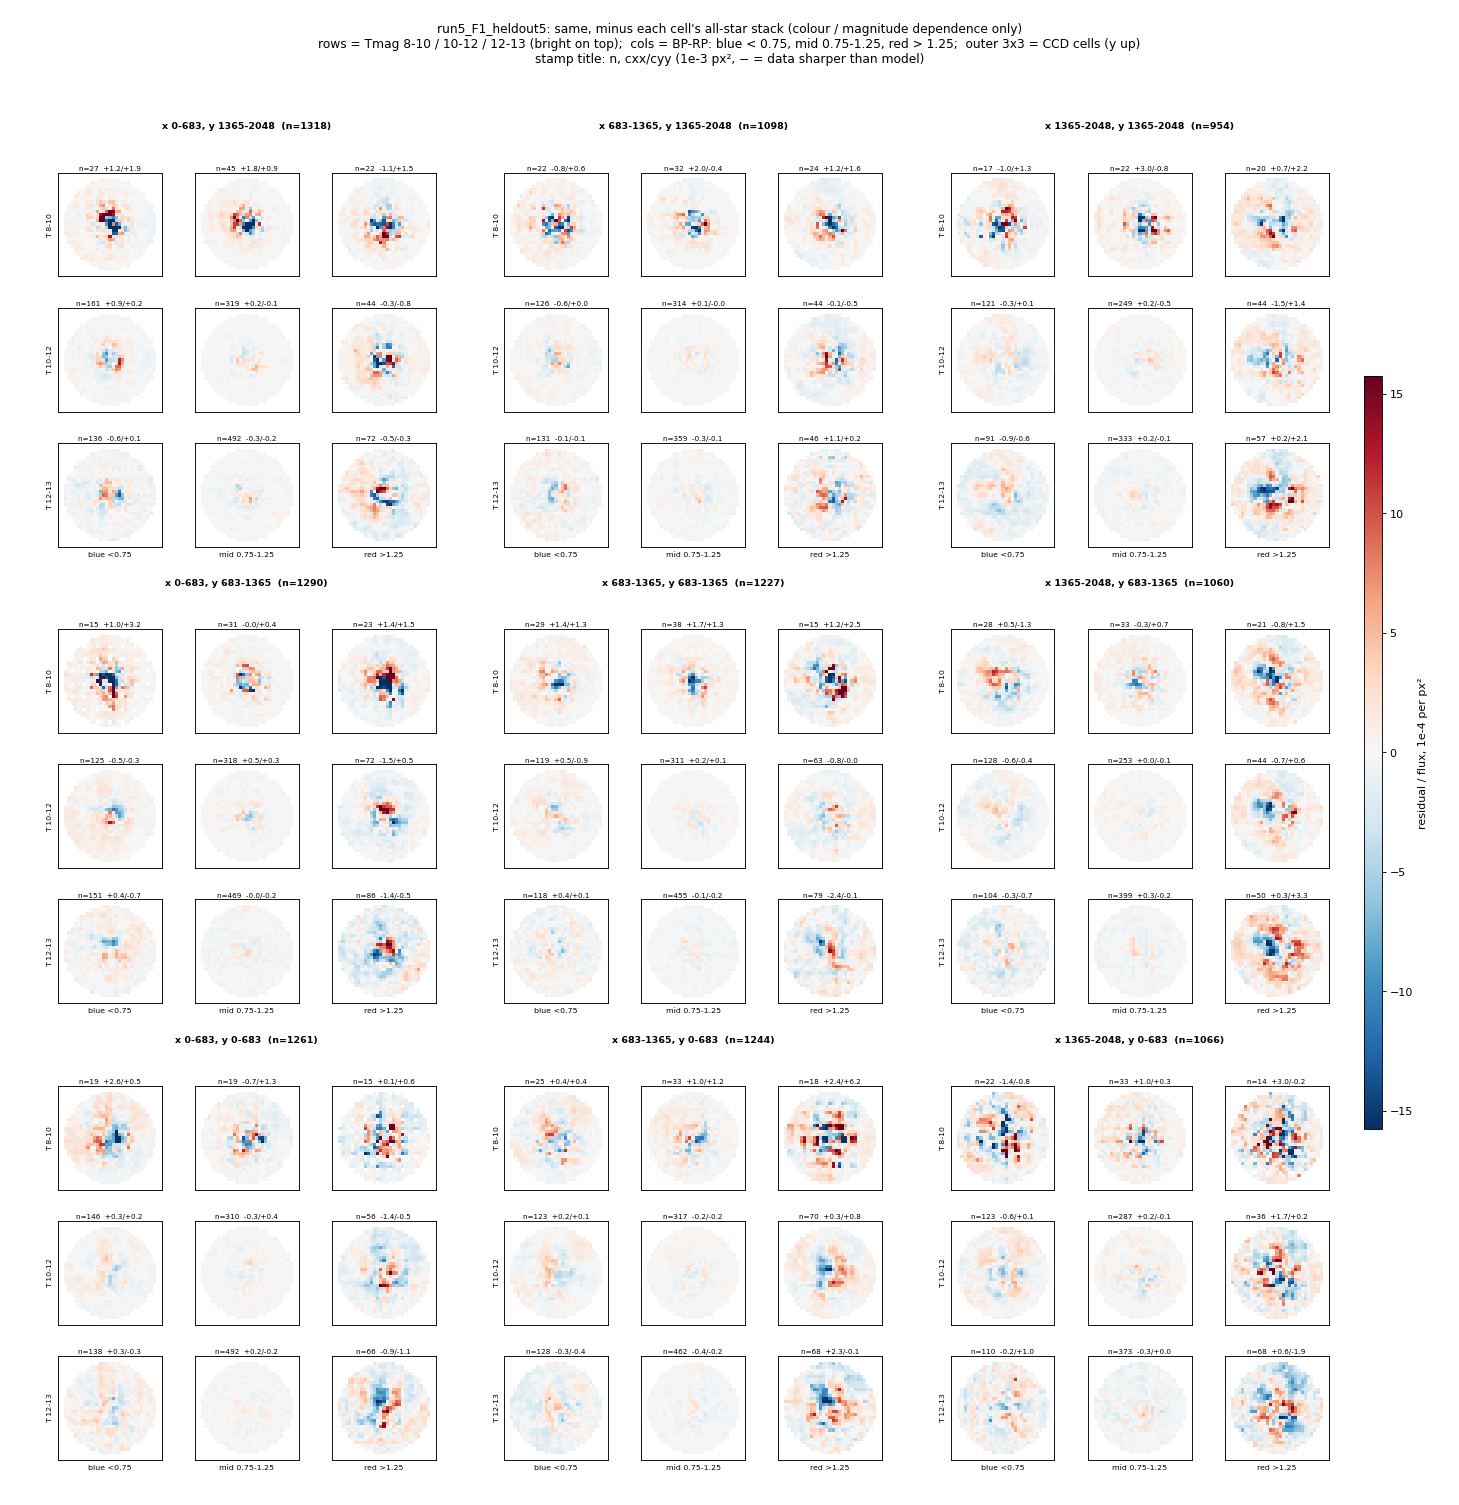
Final run (run5), 10,536 held-out stars, 5 folds pooled · left: residual / flux · right: minus each cell's all-star stack · interactive (all 5 fields, held-out / in-fold / all): claude.ai/artifact/UMr38JDhzXGZtTjv9kfCKC
New colour model: s1c = radial + coma
Physics generators vs basis functions
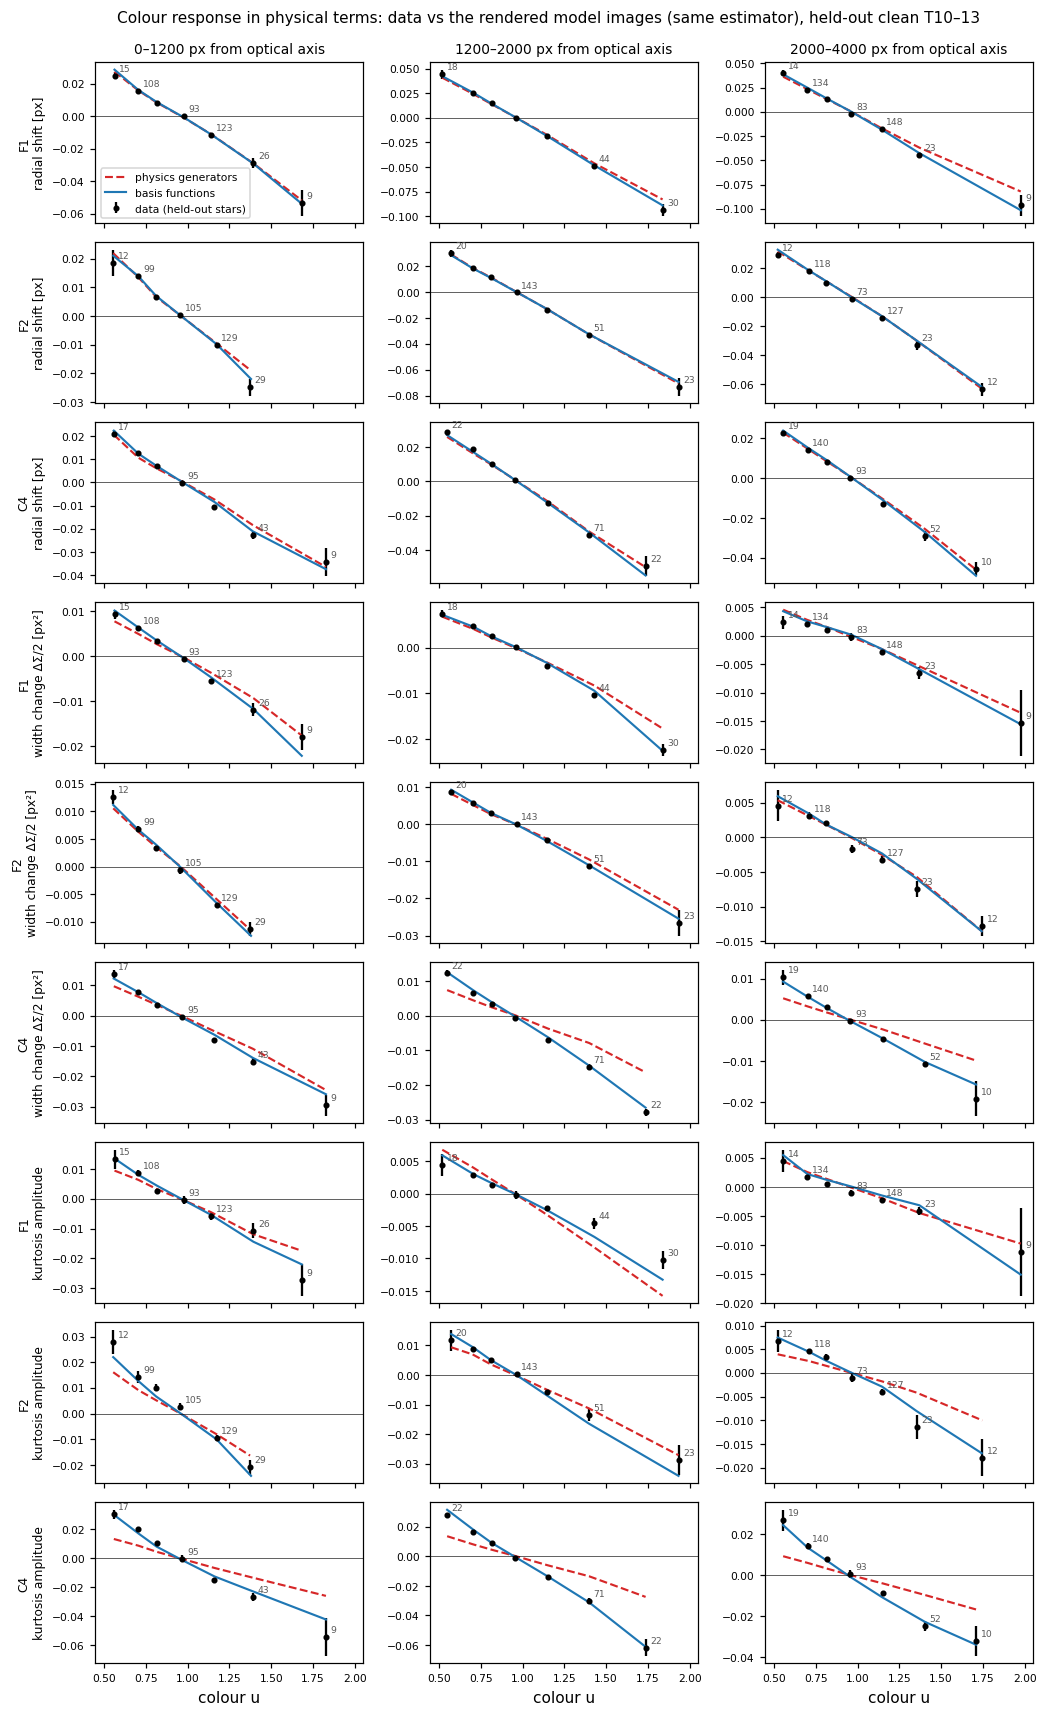
s1c basis functions (C4 ePSF node)
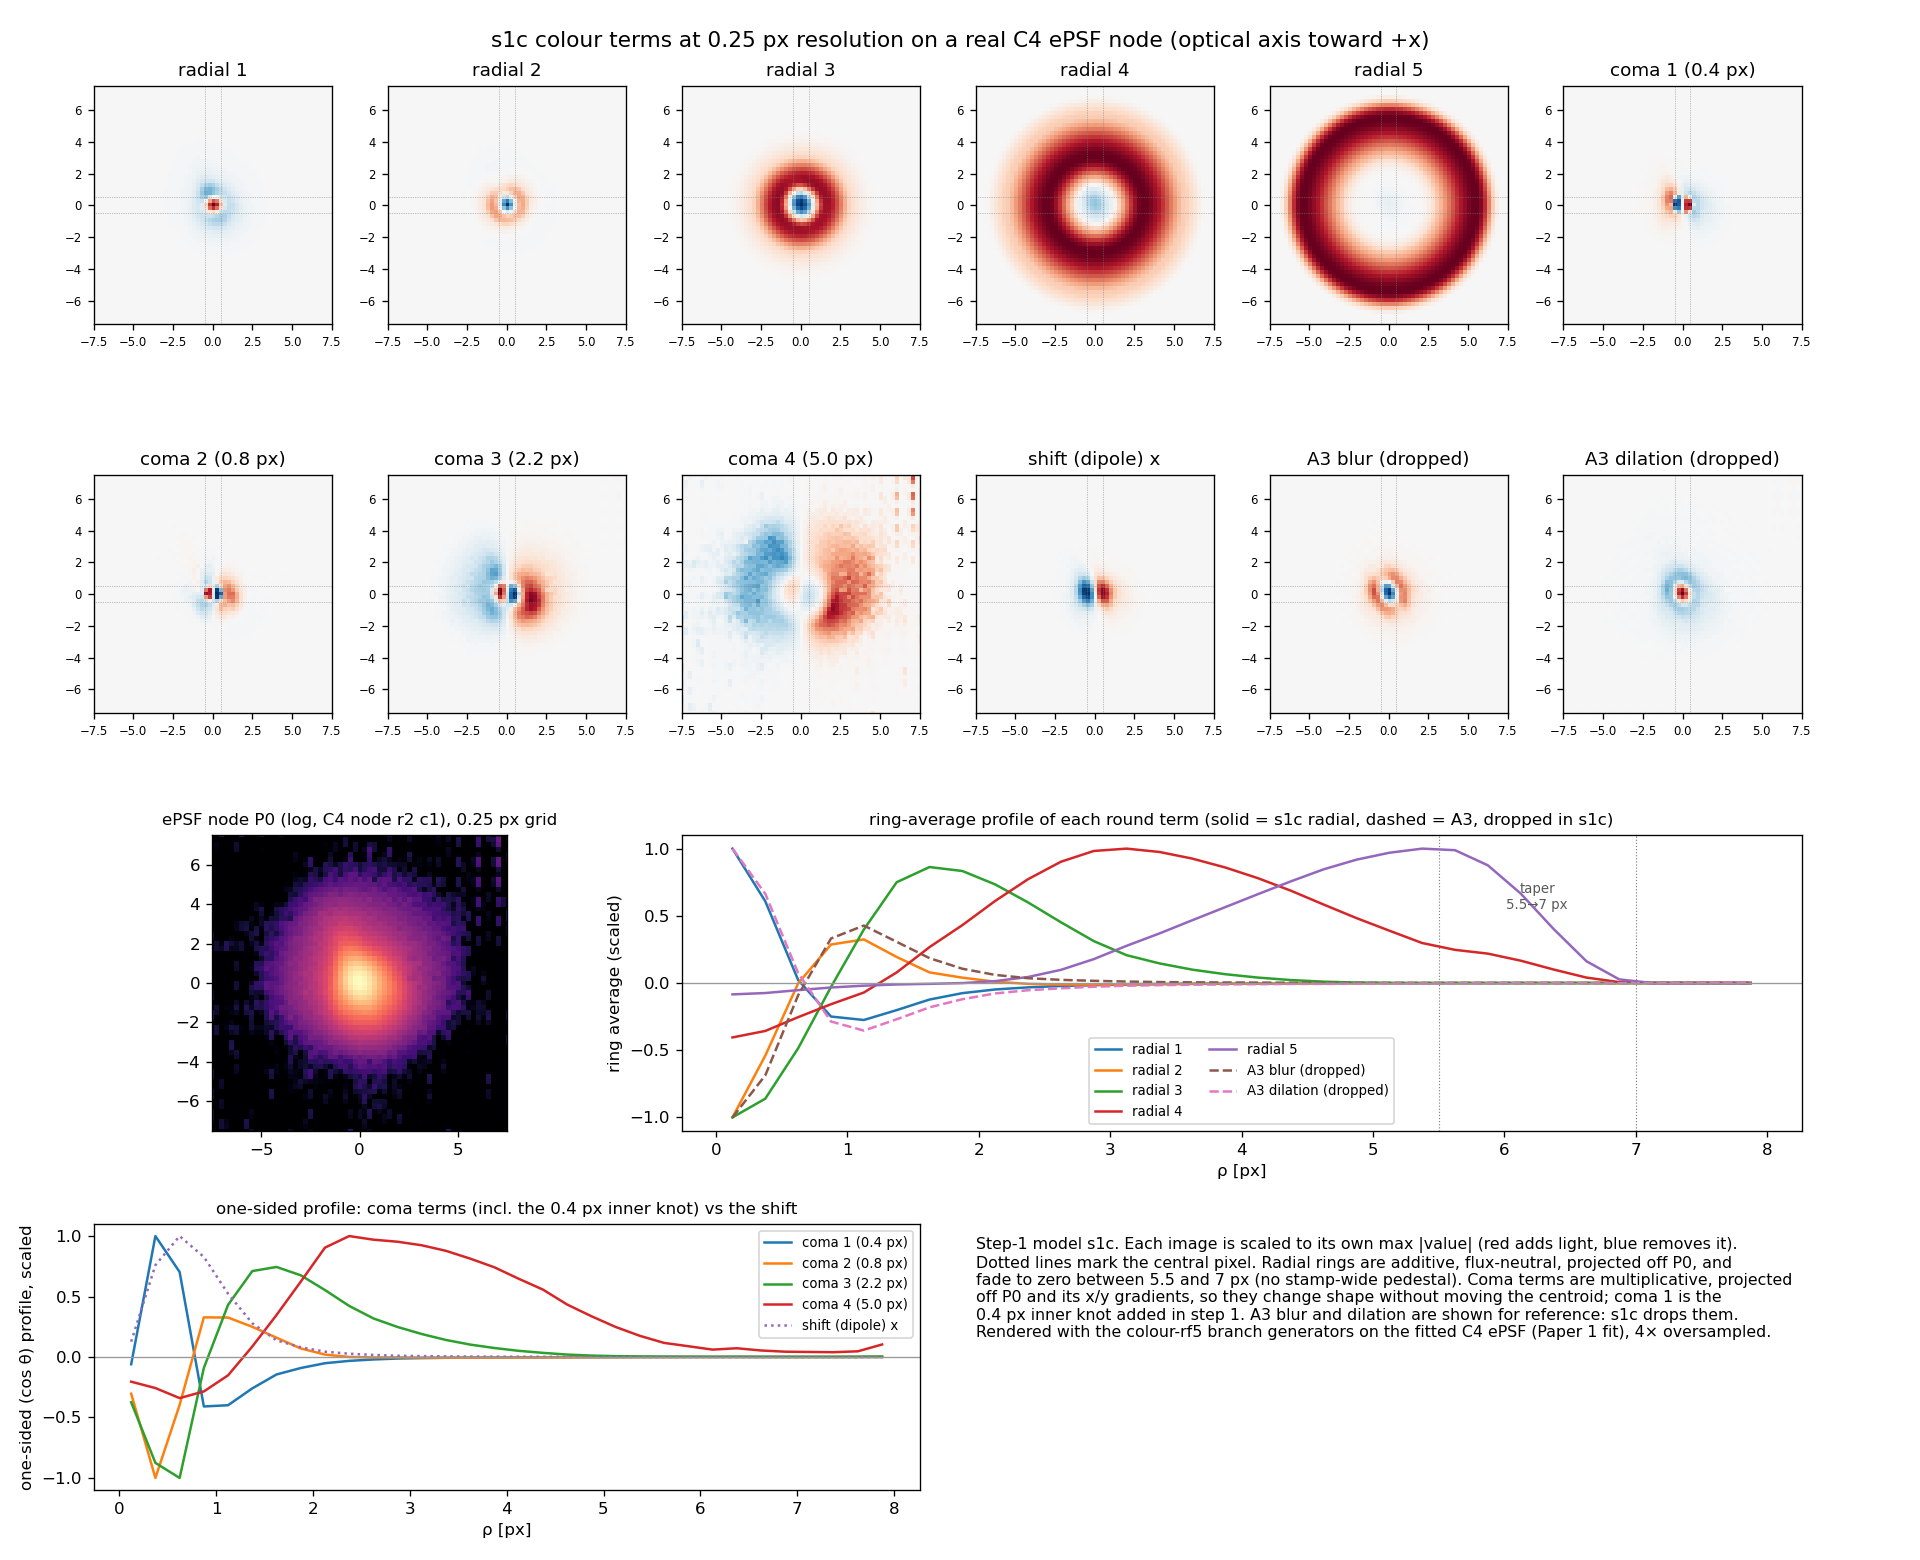
Added: radial taper 5.5→7 px · coma inner knot 0.4 px · colour law δ, δ², δr̃, δr̃²
Held-out core χ² vs A3: T 10–13 −5…−9% · T 8–10 and red −12…−32%
Preliminary: 2 folds, 3 fields
Decided 2026-10-09 · replaces the shift-only colour model
PSF width grows linearly with peak charge
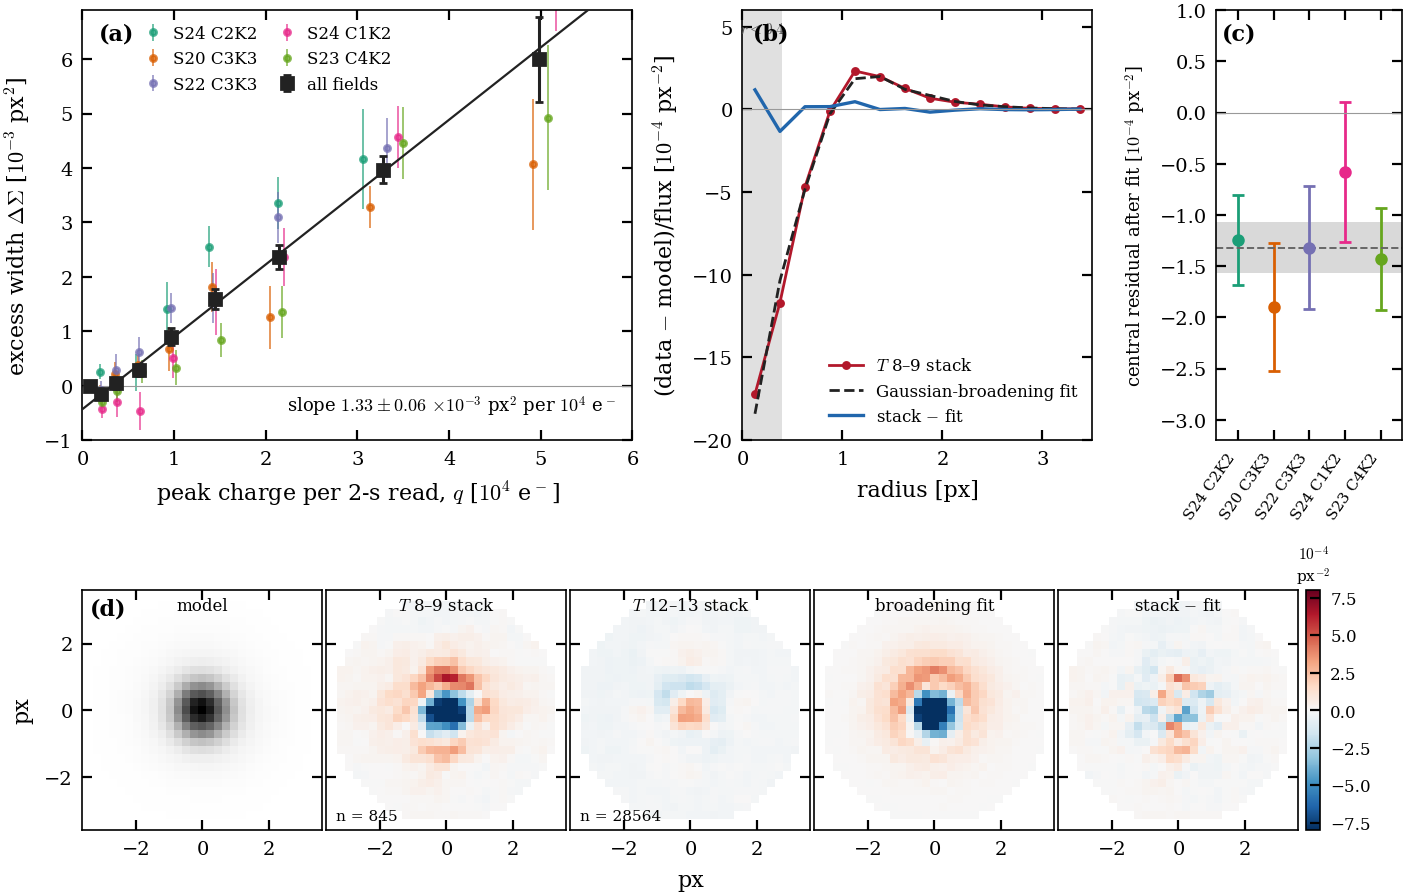
Slope: (1.33 ± 0.06) ×10⁻³ px² per 10⁴ e⁻, fields 1.05–1.65; zero below T ≈ 10.5
Blur explains 87 % of the T 8–9 stack; a central-pixel deficit is left in every CCD (5σ)
Not modelled in the adopted fit: about 1 % bright-star χ², under 1 mmag
Held-out stars, 5 fields × 5 folds · adopted model · paper Fig 14 · absolute ΔΣ scale has a 10–15 % systematic
A linear blur term removes about half
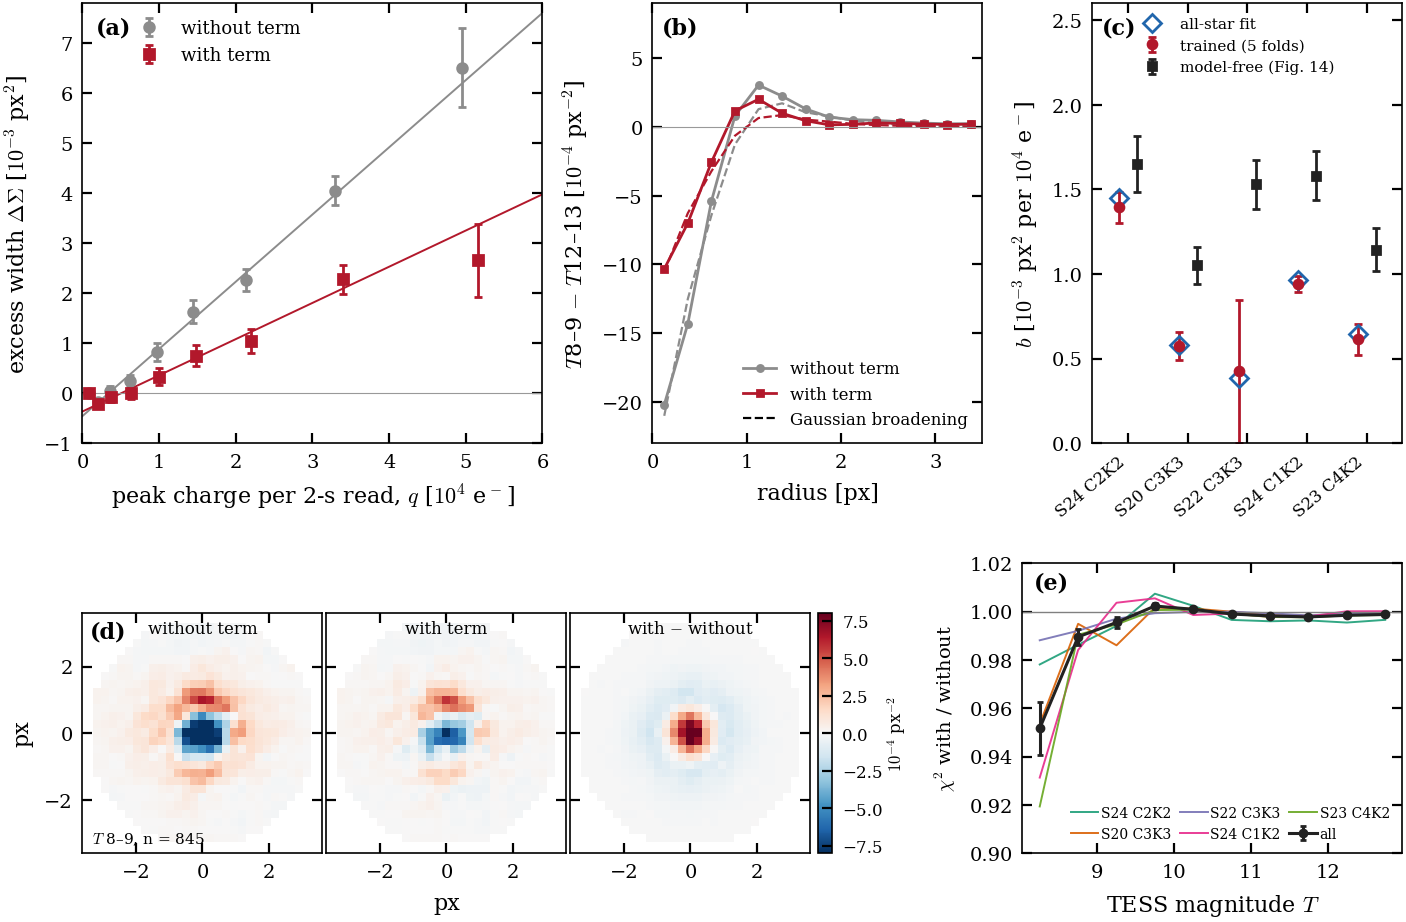
Removes ~50 % of the broadening, about uniform over the detector
Core residual remains: trained slope is below the measured one in every field
Gain is small: held-out χ² −1.2 % (T 8–10.5), −0.15 % faint; photometry under 1 mmag
Not adopted. Preliminary: switching it off below q ≈ 3×10³ e⁻ removes about two thirds
Appendix D · ΔΣ = b q / 10⁴, b trained with the ePSF · pre-registered gate failed · paper Fig D1
Cross-section: bright minus faint, and a Gaussian blur
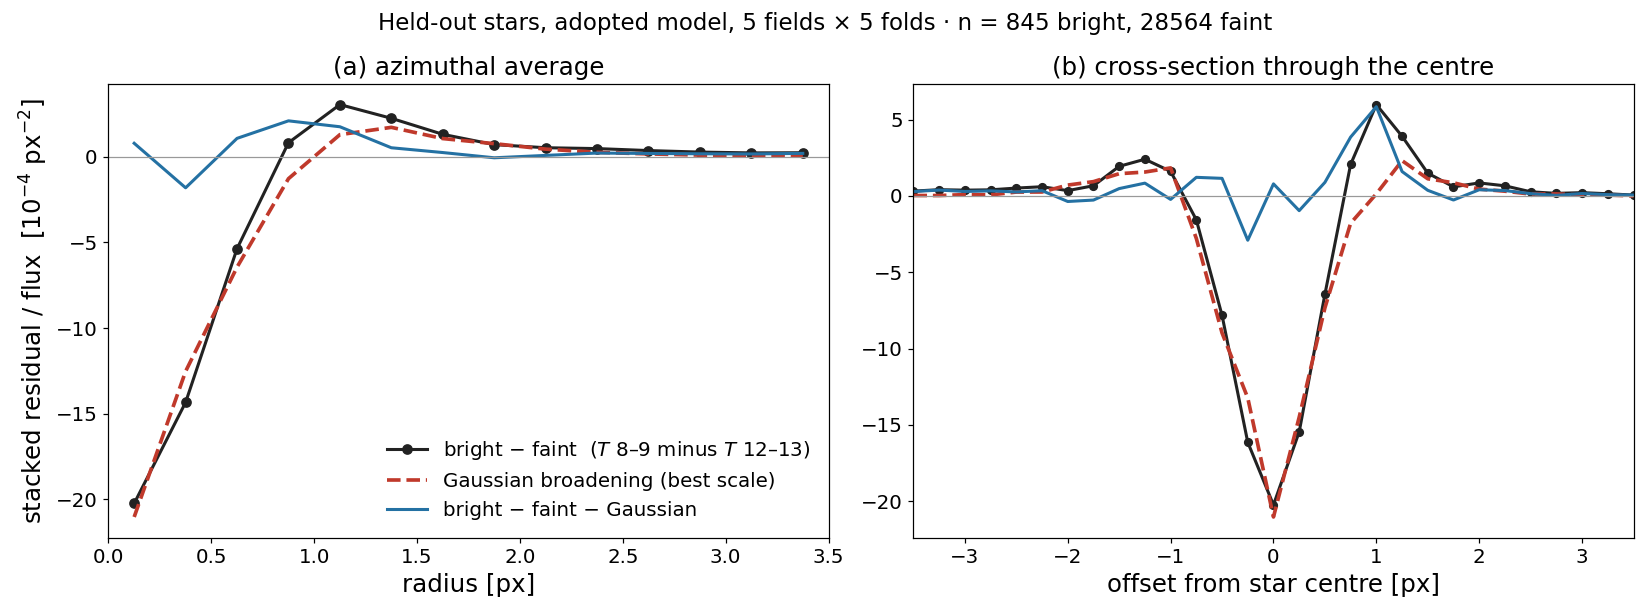
Bright − faint: negative core to −20×10⁻⁴ px⁻², positive ring at 1–1.5 px
Gaussian blur follows the whole shape; the remainder is 14 % of the profile rms, at the centre
Adopted model, held-out stars, 5 fields × 5 folds · 845 bright, 28,564 faint · same stacks as Fig 14 · Gaussian scale 0.72
The Gaussian blur does not match along every cut
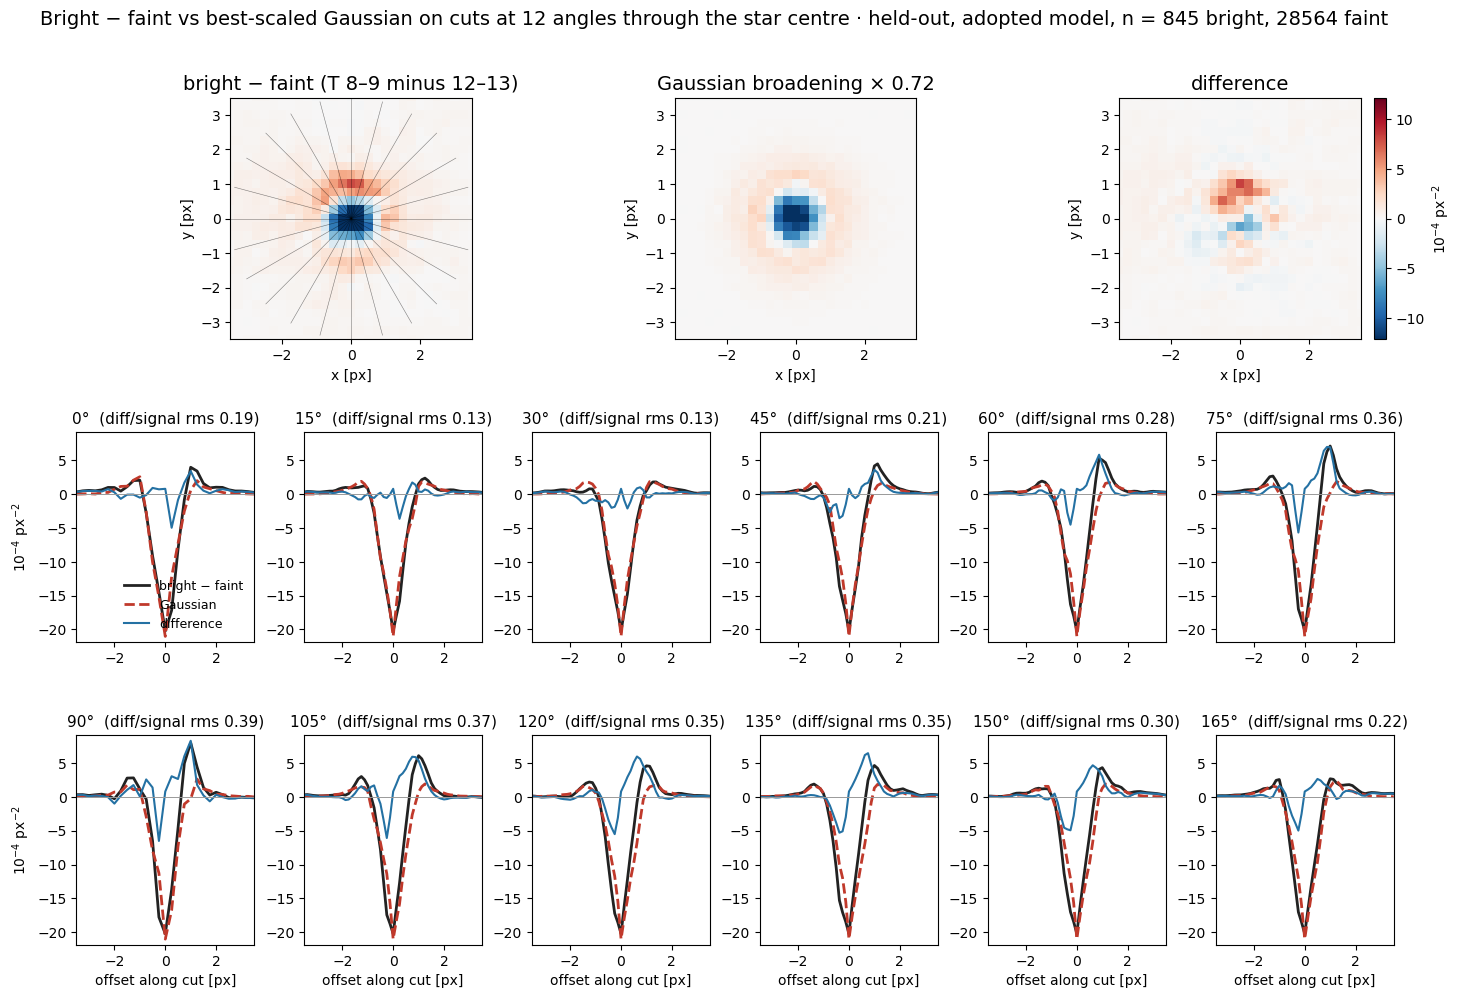
0°–30°: the Gaussian follows the profile (difference 13–19 % of the signal rms)
60°–135°: the bright − faint minimum is wider and the positive lobe on one side reaches +6×10⁻⁴ px⁻², which the Gaussian does not have (difference 28–39 %)
The difference image is a one-sided positive lobe about 1 px above the centre: the Gaussian is symmetric, the data are not
Same stacks and Gaussian scale (0.72) as the previous slide · cuts every 15° through the star centre, bilinear interpolation
Across the CCD, one Gaussian blur does not fit
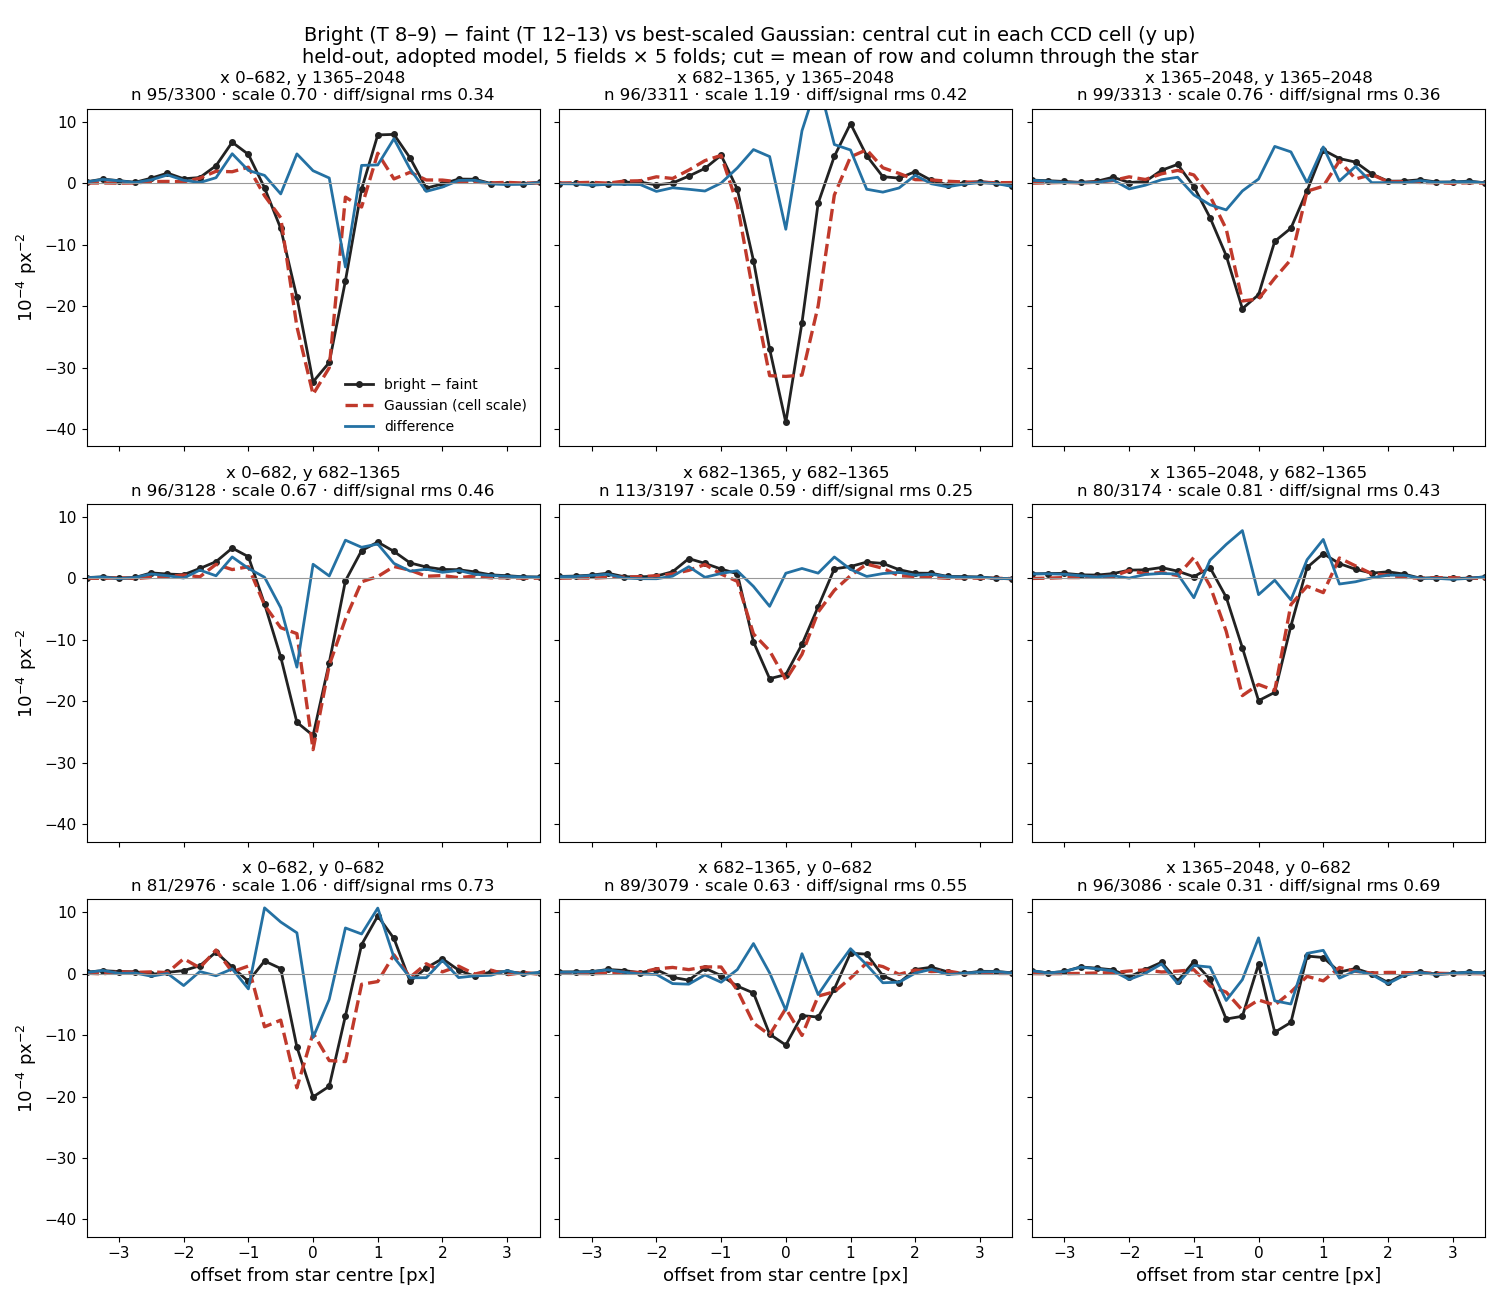
Scale changes with position: the best Gaussian amplitude is 0.31 to 1.19 of the reference, so no single blur fits all cells
Shape changes with position: in the top row the minimum is deeper or shifted by a quarter pixel, and the Gaussian is symmetric
Only the CCD centre fits well: remainder 25 % of the cut rms there, 34–73 % in the other cells
Adopted model, held-out stars, 5 fields × 5 folds · 80–113 bright and about 3000 faint per cell · CCD pixel cells, y up
The images behind the cuts, in each CCD cell
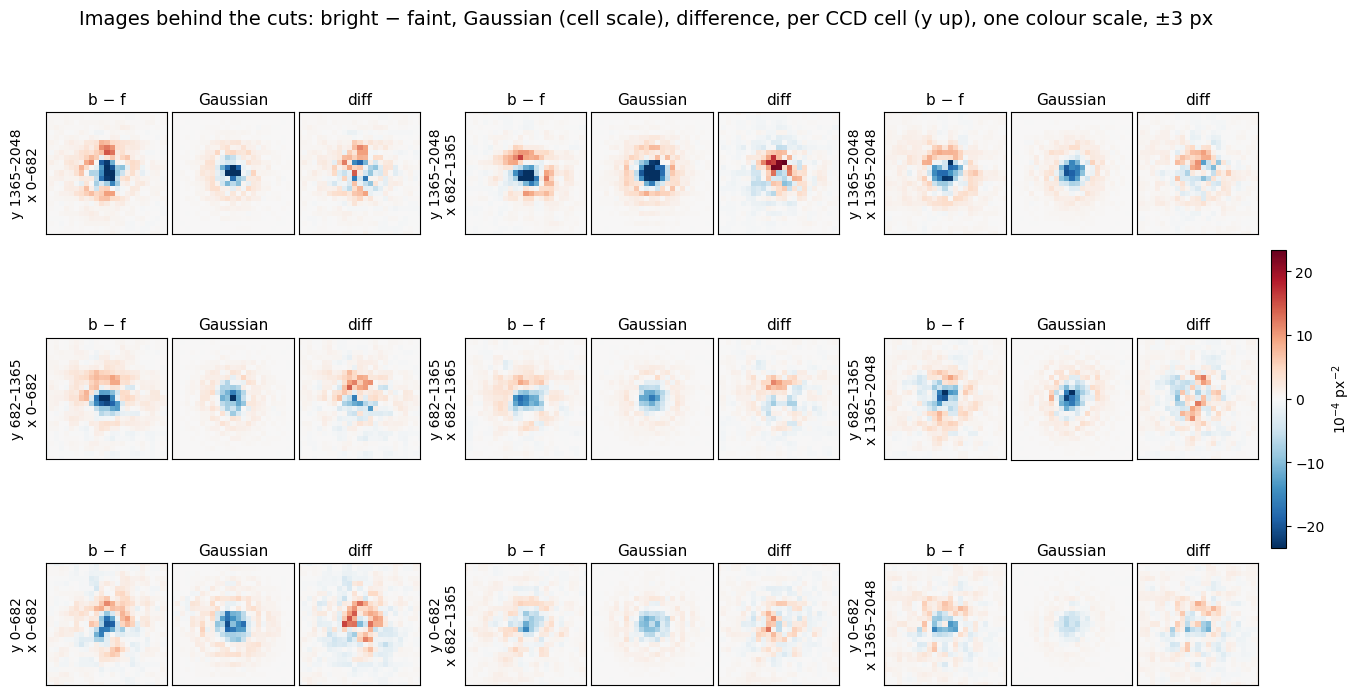
Each cell: bright − faint, Gaussian at the cell's scale, difference · one colour scale, ±3 px around the star · CCD cells, y up
TESS charge transport: partial correction
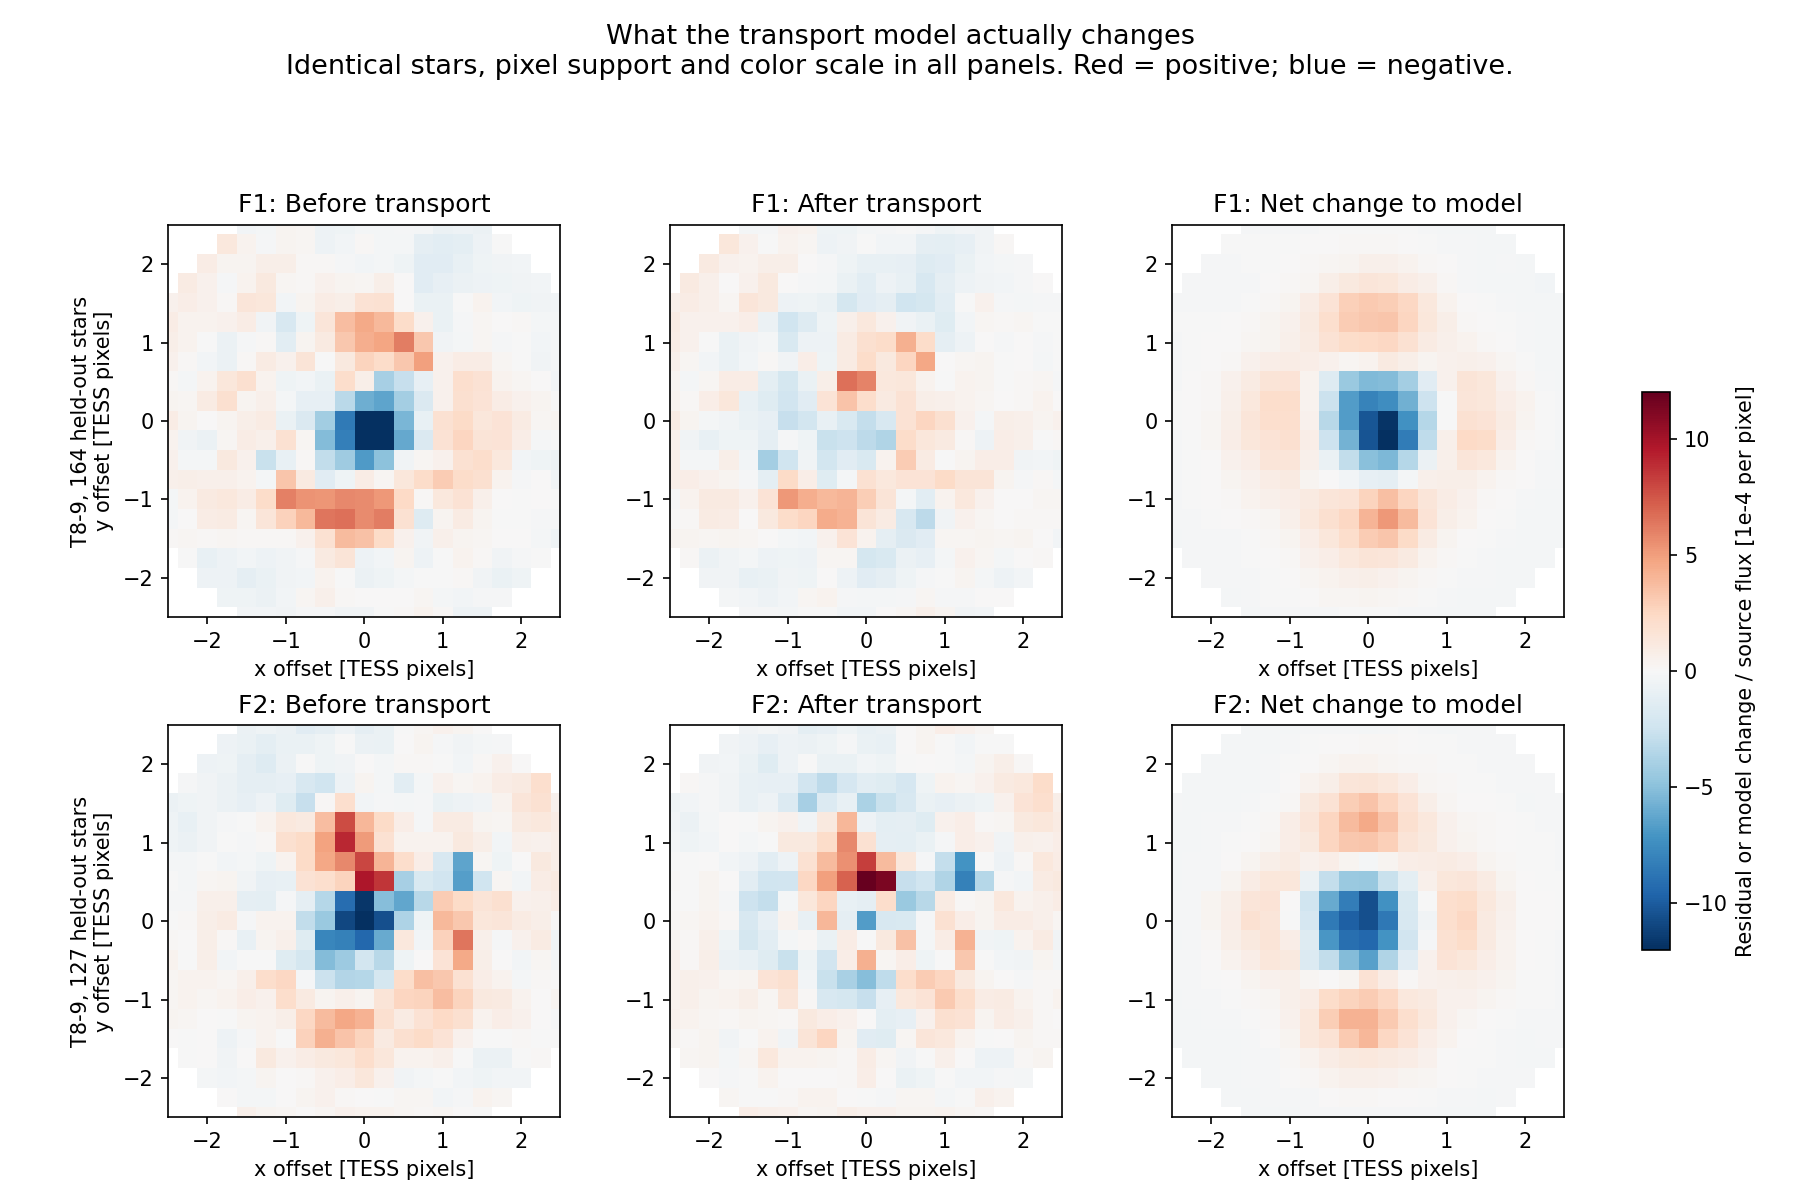
Columns: before · after · net change · T 8–9, same stars and scale · negative core, positive ring
Aperture correction per star
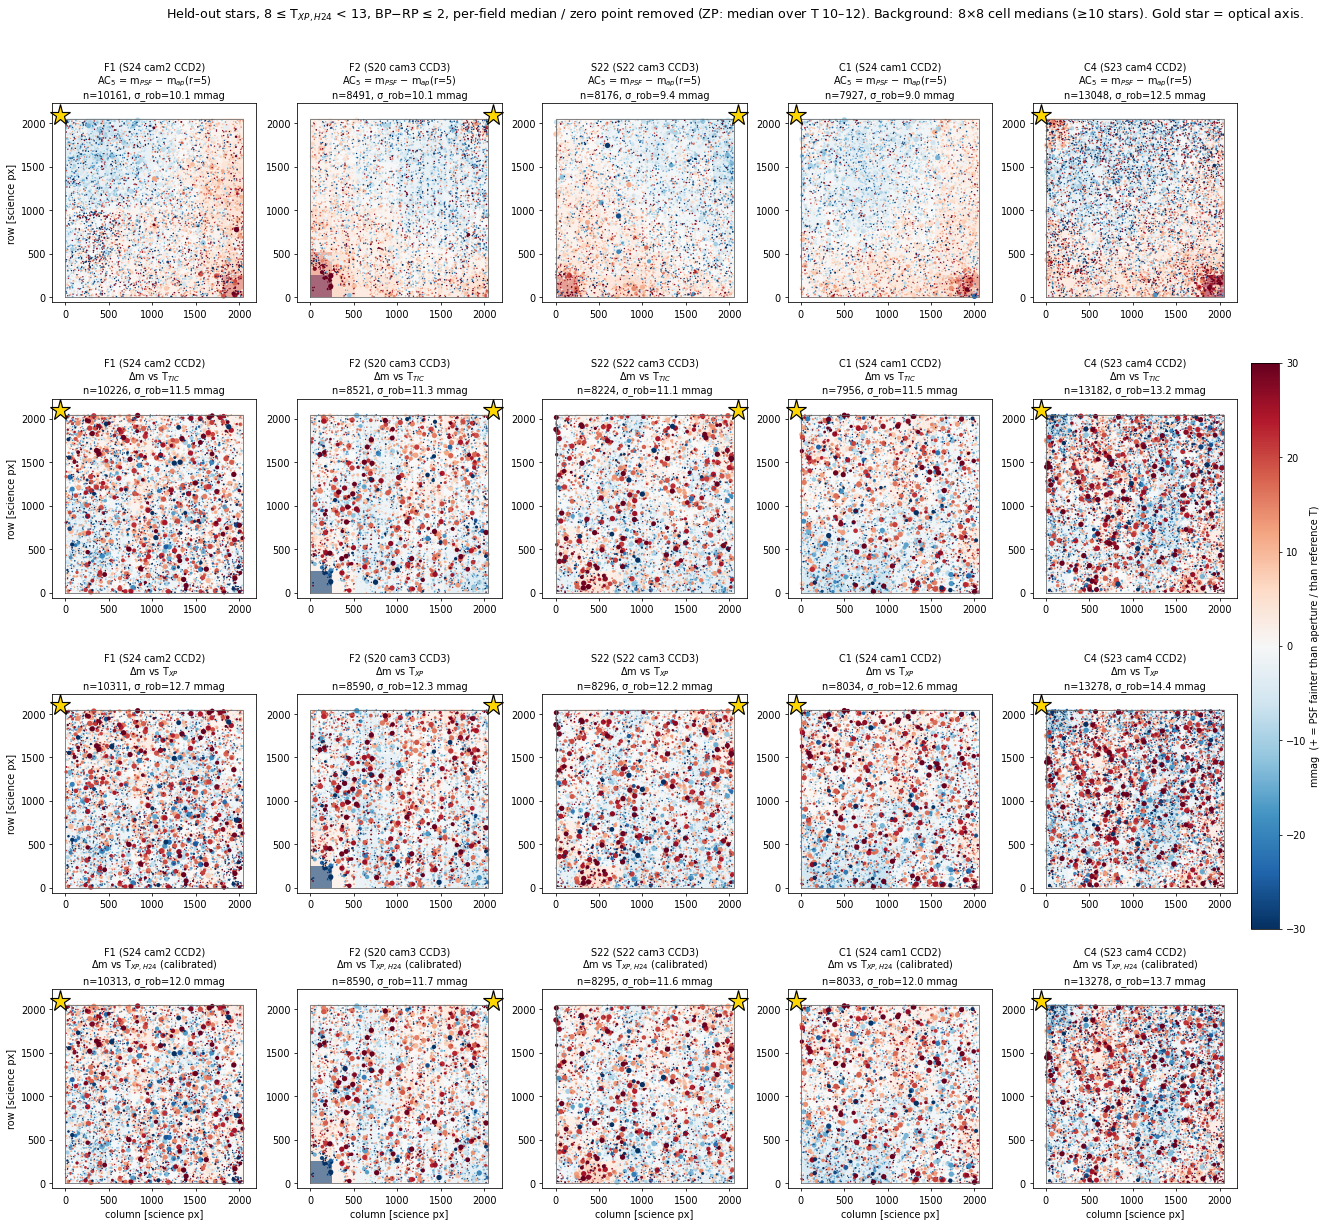
Row 1, aperture correction AC5 = mPSF − map(5 px): smooth across each CCD, σ 9.0–12.5 mmag per star
One strongly positive corner per FFI, always the corner farthest from the optical axis (★): PSF flux short of aperture flux, where the ePSF corner nodes are poorly constrained
Rows 2–4, Δm vs TIC, XP, Huang+24 XP: dominated by colour (σ 11–14 mmag); the reference changes the colour trend, not the spatial pattern
Columns: S24 C2K2 (F1) · S20 C3K3 (F2) · S22 C3K3 · S24 C1K2 (C1) · S23 C4K2 (C4) · held-out PSF fluxes, 8 ≤ T < 13, BP−RP ≤ 2 · per-FFI zero point (T 10–12) removed · + = PSF fainter · ±30 mmag
Δm distributions: colour dominates
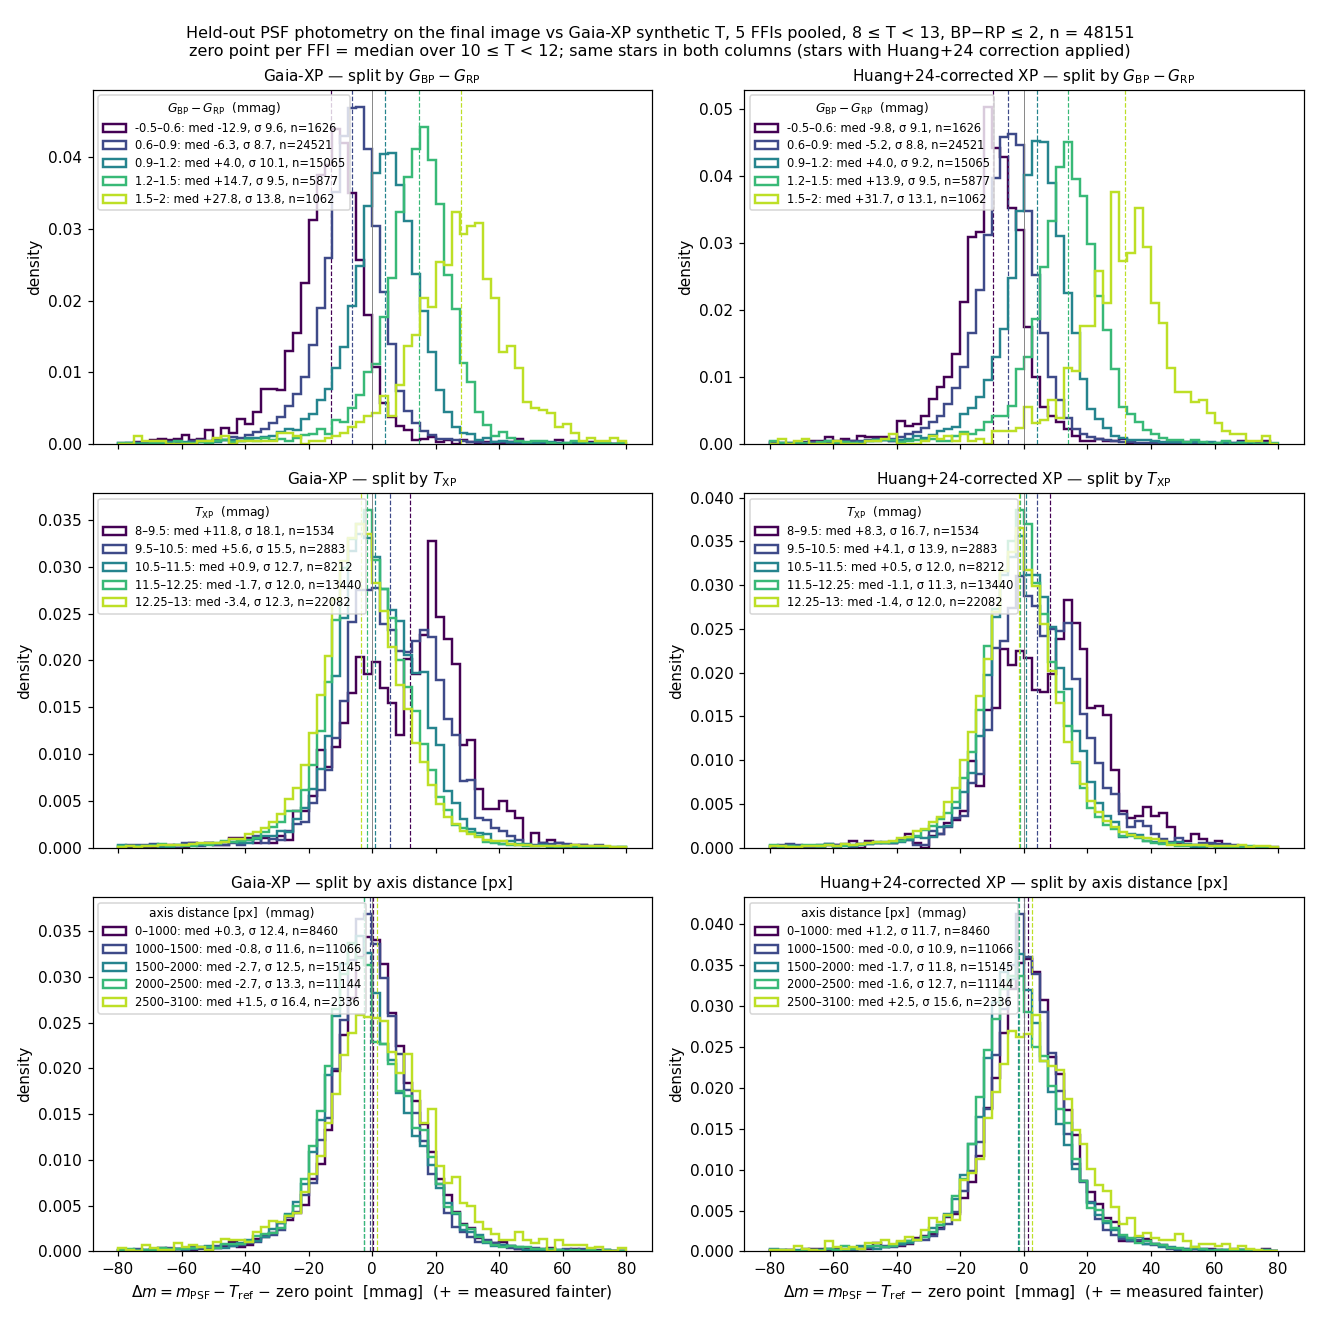
By colour (BP−RP <0.6 … 1.5–2): medians −12.9, −6.3, +4.0, +14.7, +27.8 mmag (Huang+24: −9.8 … +31.7), σ 9–10 per bin
By T: T 8–9.5 is bimodal only because half the bin are red giants (BP−RP ≈ 1.2)
By axis distance: medians move by only a few mmag
Colour trend removed first: T 8–9.5 vs 12.25–13 = +7.8 vs −1.0 mmag (XP), +4.4 vs −0.1 (Huang+24); far corner (2500–3100 px) +4 mmag and broader
Δm = mPSF − Tref − zero point · 48,151 held-out stars, 5 FFIs, final-image fits · zero point per FFI over T 10–12 · Huang+24 column: stars the correction was applied to (C2 ≤ 1.322)
PSF Δm vs Gaia-XP: a +15 → −4 mmag trend
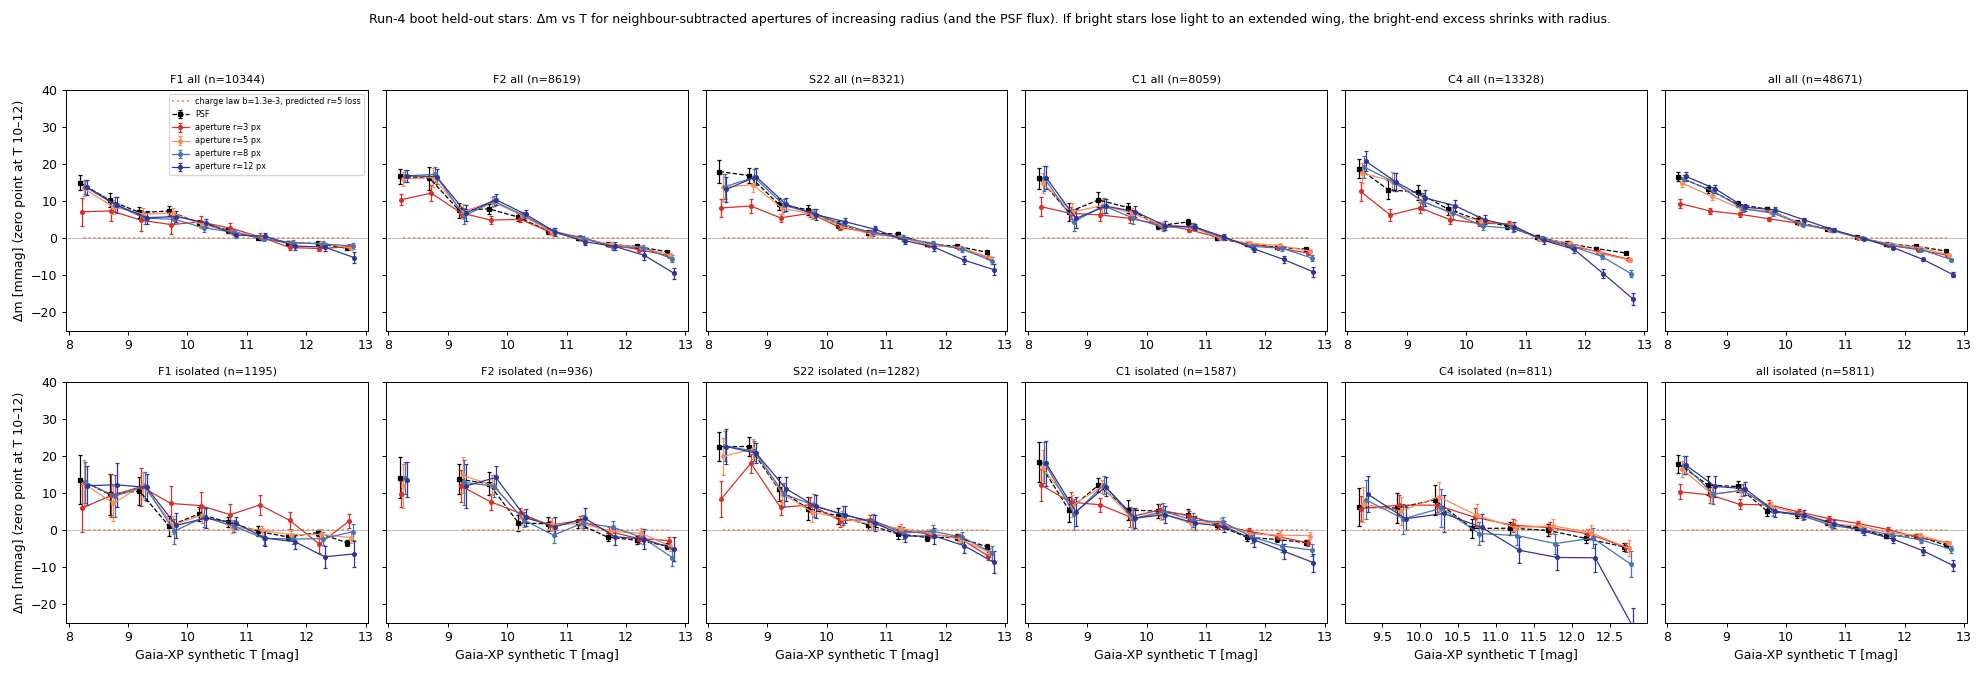
Δm = measured − Gaia-XP synthetic T · zero point at T 10–12 · top: all stars · bottom: isolated stars
Colour variable u: one number from the spectrum
u = the star's mean wavelength across the template's four PS1 bands: u = Σb sb λb, where sb is the share of the star's template flux in band b (from its Gaia XP spectrum) and λb = 617, 752, 866, 962 nm (r, i, z, y). Blue star → small u, red star → large u.
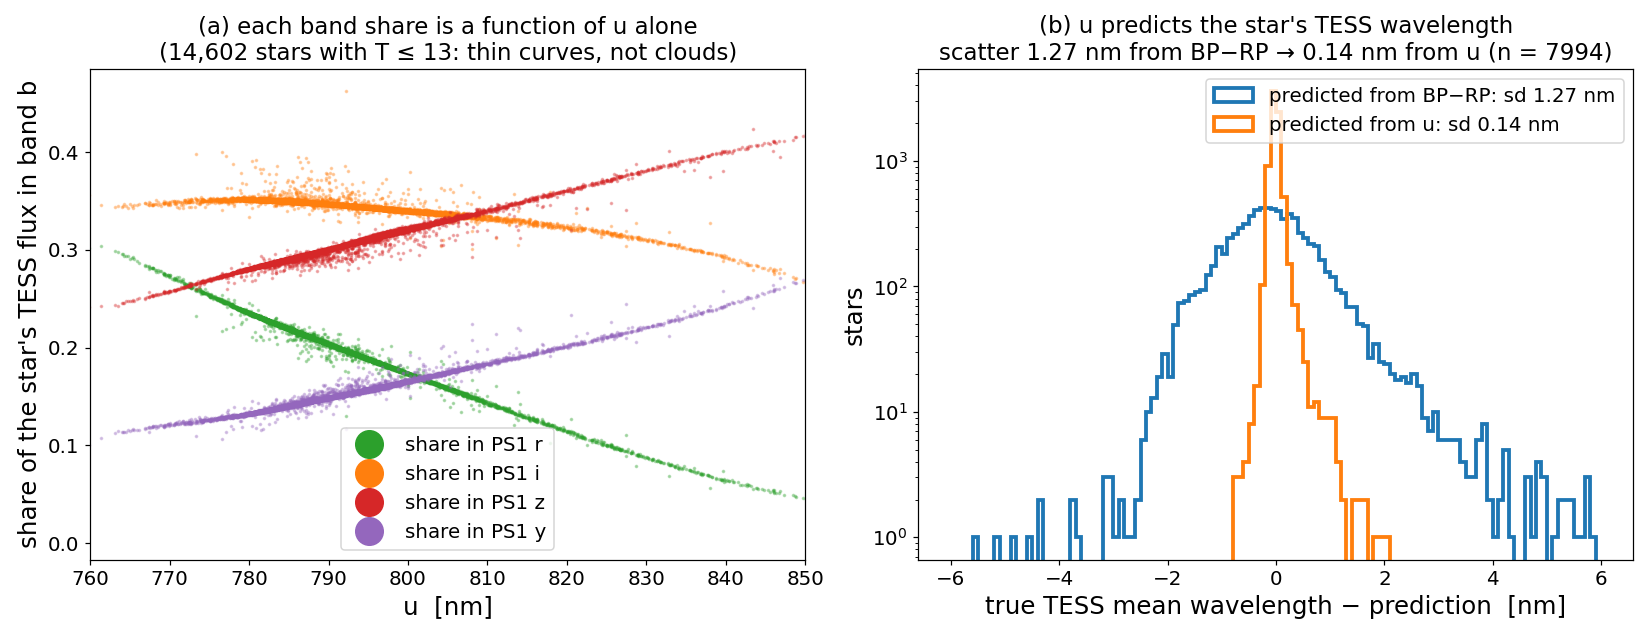
How (b) is measured: the true TESS mean wavelength of each isolated star is the photon-weighted mean of its full Gaia XP spectrum (336–1020 nm) through the TESS v2.0 response. It is predicted from a cubic fit to u (four PS1 band shares) or to BP−RP; the histogram is true − predicted.
u = Σ s_b λ_b · s_b: PS1 band share of the star's flux from Gaia XP · λ_b: band wavelength (nm)
Math: core χ² and colour variable u
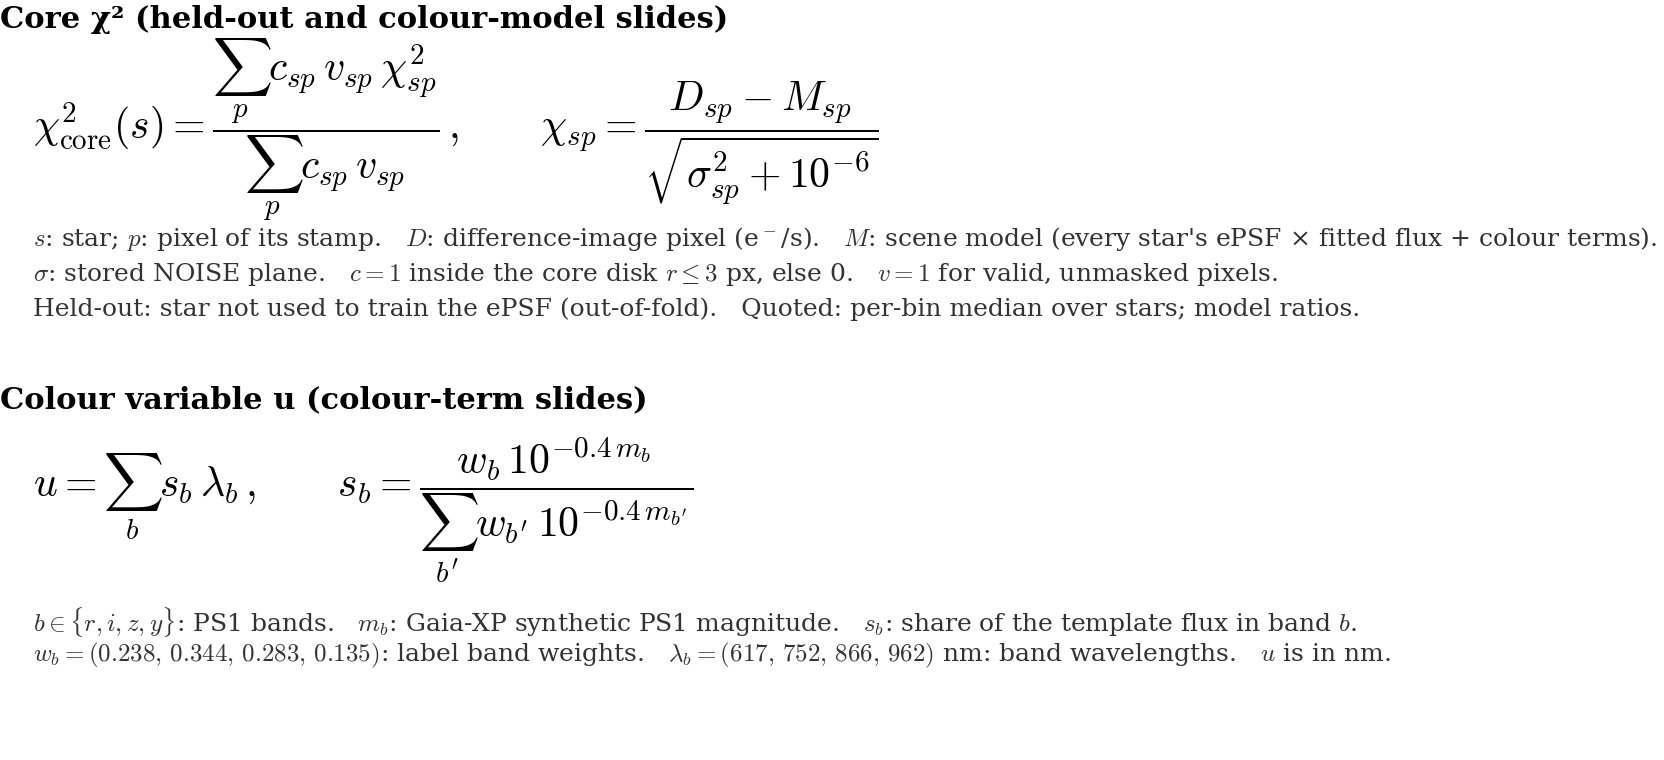
forward_model/scene_fit.py · xp_colour_20260925
Math: saturation margin and red deficit
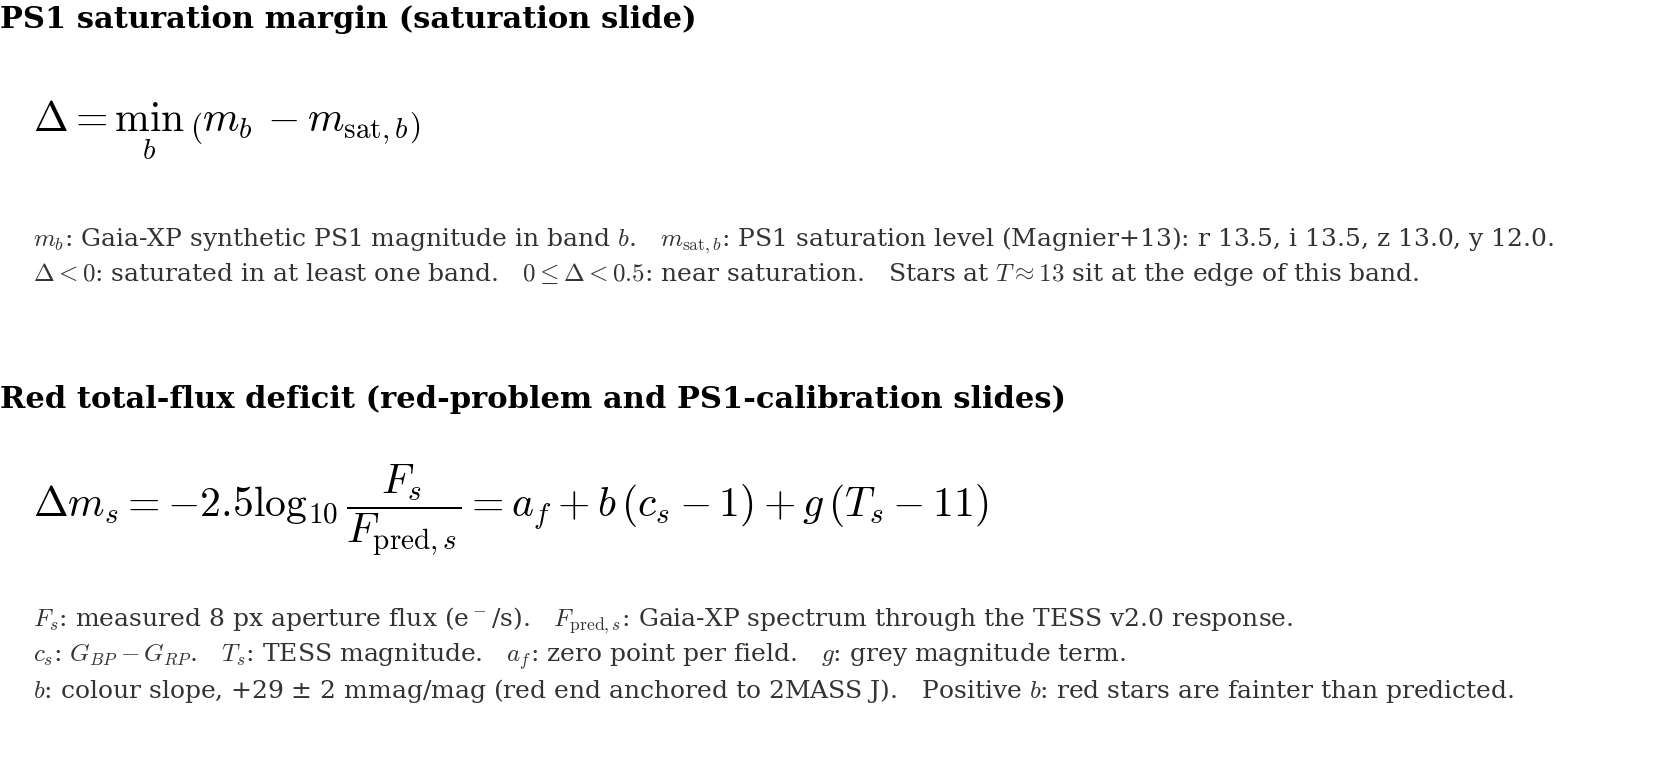
paper_figs.py (E2) · red_deficit_cause_20261012
Math: PSF width law and curve of growth
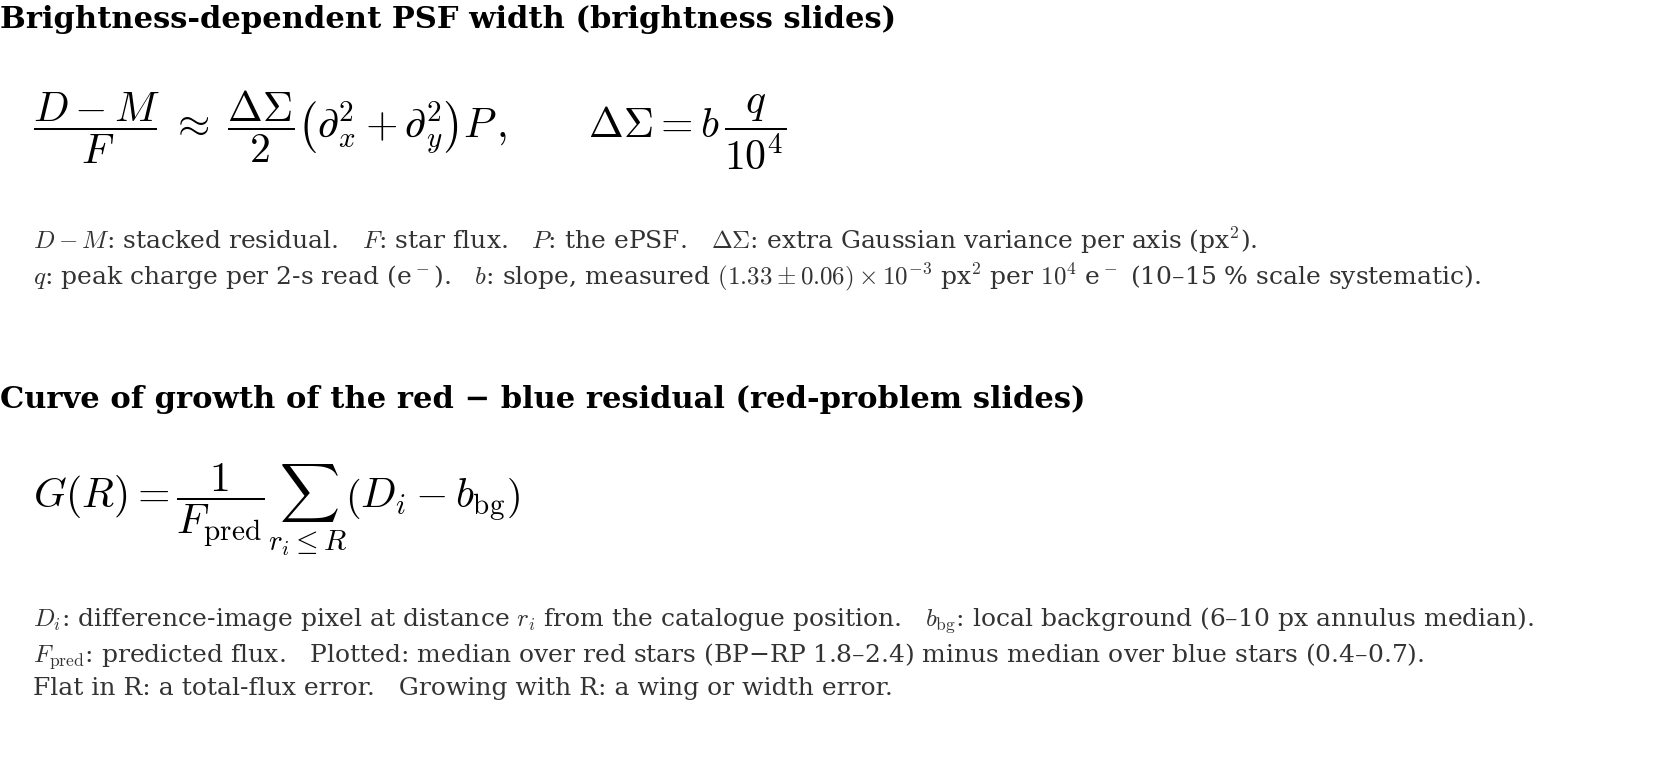
bwidth_campaign_20261012 · bandw_kernel_shift_20261009/red_resid_radius